The structure of Inter-Urban traffic:
A weighted network analysis
Abstract
We study the structure of the network representing the interurban commuting traffic of the Sardinia region, Italy, which amounts to 375 municipalities and 1,600,000 inhabitants. We use a weighted network representation where vertices correspond to towns and the edges to the actual commuting flows among those. We characterize quantitatively both the topological and weighted properties of the resulting network. Interestingly, the statistical properties of commuting traffic exhibit complex features and non-trivial relations with the underlying topology. We characterize quantitatively the traffic backbone among large cities and we give evidences for a very high heterogeneity of the commuter flows around large cities. We also discuss the interplay between the topological and dynamical properties of the network as well as their relation with socio-demographic variables such as population and monthly income. This analysis may be useful at various stages in environmental planning and provides analytical tools for a wide spectrum of applications ranging from impact evaluation to decision-making and planning support.
pacs:
89.75.-k, -87.23.Ge, 05.40.-aI Introduction
The informatics revolution has enabled the systematic gathering and handling of a large array of large scale networks data sets, enabling the analysis of their detailed structural features. In particular, mapping projects of the WWW and the physical Internet offered the first chance to study the topology and traffic of large-scale networks. Gradually other studies followed describing population networks of practical interest in social science, critical infrastructures and epidemiology (Albert and Barabàsi, 2002; Newman, 2003; Dorogovtsev and Mendes, 2003; Pastor-Satorras and Vespignani, 2004). The possibility of accessing and mining large-scale data sets allows a more detailed statistical analysis and theoretical characterization of correlation patterns, hierarchies and community structure of these networks, along with the setup of new modeling frameworks. In particular, the systematic study of these systems has shown the ubiquitous presence of complex features, mathematically encoded in statistical distributions with heavy-tails, diverging fluctuations, self-organization and emerging phenomena and patterns.
The statistical properties induced by these complex features indicate the presence of topological and structural properties that do not find an explanation in the paradigm put forward by Erdös and Renyi with the random graph model (Erdös and Renyi, 1960). Indeed, even if the Erdös-Renyi model rationalizes the small-world property of networks (i.e. the short distance measured in number of links among nodes), it fails in reproducing the high level of local cohesiveness observed in many networks (Watts and Strogatz, 1998). Additionally, several of these networks are characterized by the statistical abundance of nodes with a very large degree ; i.e. the number of connections to other nodes. For these ’scale-free’ networks, the degree probability distribution spans over a wide range of values which signals the appreciable occurrence of large degree nodes, the ’hubs’ of the system. Finally, it is important to remark that the topological features of networks turn out to be extremely relevant since they have a strong impact in assessing their physical properties such as robustness, vulnerability, or the ability to spread a disease (Barabàsi and Albert, 1999; Dorogovtsev and Mendes, 2003; Pastor-Satorras and Vespignani, 2004).
More recently, the activity on complex networks has been extended to the characterization of weighted networks. This representation allows the consideration of features pertaining to the dynamics and traffic flows occurring on networks, adding another dimension in the description of these systems. Also in this case, the analysis and the characterization of weighted quantities have pointed out the presence of large scale heterogeneity and non-trivial correlations (Barrat et al, 2004). The weighted graph representation provides valuable elements that open the path to a series of questions of fundamental importance in the understanding of networks. Among those, the issue of how dynamics and structure affect each other and the impact of traffic flows on the basic properties of spreading and congestion phenomena. Finally, it spurs the more theoretical questions on how all these properties may be considered in generative networks models.
In the realm of urban and environmental planning, spatial analysis and regional science, the interest for complex networks has noticeably increased during the last years. In his investigation of the structure of the modern urban fabric, Salingaros (2001 and 2003) invokes the concepts of small world network and scale free properties and suggests a parallelism between the city and an ecosystem. Starting from the principle that connective webs are the main source of urban life, Salingaros invites planners to apply complex networks analysis to understand properties such as resilience and self-organization. While these studies are mostly based on conceptual arguments, other authors (Shiode and Batty, 2000; Batty, 2001 and 2003) promote the development of quantitative analyses with a twofold perspective: (i) explaining the behavior of complex networks such as the world wide web in terms of geography, demography and economics; and (ii) improving the efficiency of advanced spatial analysis GIS-based tools, by integrating the foundation of complex networks analysis into geographic information science. Batty (2001) along with Salingaros acknowledges the existence of a link between efficient urban connectivity and self-preserving behaviors and fosters the development of complex networks to study the functional mechanisms of cities. It is interesting to note that a similar approach has been extremely fruitful in the study of the Internet in relation with the geographical and social environment (Yook et al, 2002; Gorman, 2001; Barthélemy et al, 2003; Gorman and Kulkarni 2004; Pastor-Satorras and Vespignani, 2004; Schintler et al, forthcoming).
In the domain of geographic information science, Jiang and Claramunt (2004) proposed to use complex network tools to investigate quantitatively the urban space syntax. Aiming at the improvement of the effectiveness of network GIS advanced analysis, they use topological measures of connectivity, average path length and generalised clustering to compare three large street networks of the cities of Gävle, Munich and San Francisco. Fertile research directions are also currently explored in the domain of transportation systems and human traffic analysis. For example, the small-world properties of the Boston subway system have been characterized by Latora and Marchiori (2000-2003) and Sen et al (2003) studied the topology of the Indian railway network. At the urban level, a network study has been carried out by Chowell et al (2003) using large scale simulations (with census and demographic data integration) in order to describe urban movements of individuals in Portland, Oregon (USA). On a larger scale, recent studies have focused on the network properties of major transportation infrastructure such as the US Interstate highway network and the airport network. (Gastner and Newman, 2004; Guimera et al, 2003). Finally, Barrat et al (2004) have provided the first study of the worldwide airports network including the traffic flows and their correlation with the topological structure. In this research area, the network approach might provide relevant information on issues such as traffic analysis and risk assessment in case of damages and attacks.
In the present work we use a network approach to study the Sardinian inter-municipal commuting network (SMCN), which describes the everyday work and study-led movements among municipalities in the Italian region of Sardinia. We obtain a weighted network representation in which the vertices correspond to the Sardinian municipalities and the valued edges to the amount of commuting traffic among them. We provide a detailed quantitative study of the resulting network, aiming at a first characterization of the structure of human traffic at the inter-city level and its relation with the topological structure defined by the connectivity pattern among cities. Very interestingly, while the network topology appears to fit within the standard random graph paradigm, the weighted description offers a very different perspective with complex statistical properties of the commuting flows and highly non-trivial relations between weighted and topological properties. We discuss these properties in relation with the geographical, social and demographical aspects of the system and show the potentiality of the network approach as a valuable tool at various stages of the policy-making and environmental planning process.
The paper is organized as follows. In the next section, we describe the dataset. In section 3, we carry out the analysis of the topology of the network. In section 4, we analyze the traffic and weight properties of this network and in section 5, we discuss the implications of our network analysis results in terms of urban and environmental planning. In section 6, we compare topological and weighted network analysis results with socio-economic characteristics of the Sardinian municipalities and we discuss their relations. We finally summarize our results in section 7, while in section 8 we discuss the different research directions that this work suggests.
II Setting the case study: Data and geographical features
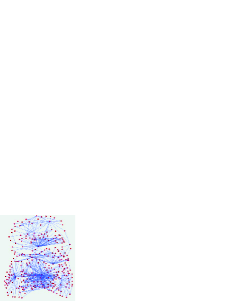
Sardinia is the second largest Mediterranean island with an area of approximately square kilometers and inhabitants. Its geographical location and morphological characters have determined an important history of commercial and cultural relations with trans-borders external communities and have also favoured the development of a strong social identity and of important political movements toward self-reliance and autonomy. At the date of 1991, the island was partitioned in municipalities, the second simplest body in the Italian public administration, each one of those generally corresponding to a major urban centre (in Figure 1, on the left, we report the geographical distribution of the municipalities). For the whole set of municipalities the Italian National Institute of Statistics (Istat, 1991a) has issued the origin-destination table (ODT) corresponding to the commuting traffic at the inter-city level. The ODT is constructed on the output of a survey about commuting behaviors of Sardinian citizens. This survey refers to the daily movement from the habitual residence (the origin) to the most frequent place for work or study (the destination): the data comprise both the transportation means used and the time usually spent for displacement. Hence, ODT data give access to the flows of people regularly commuting among the Sardinian municipalities. In particular we have considered the external flows which measure the movements from any municipality to the municipality and we will focus on the flows of individuals (workers and students) commuting throughout the set of Sardinian municipalities by all means of transportation. This data source allows the construction of the Sardinian inter-municipal commuting network (SMCN) in which each node corresponds to a given municipality and the links represent the presence of a non-zero flow of commuters among the corresponding municipalities.

The standard mathematical representation of the resulting network is provided by the adjacency matrix of elements (). The elements on the principal diagonal () are set equal to zero, since intra-municipal commuting movements are not considered here. Off-diagonal terms are equal to in the presence of any non-zero flow between and ( or ) and are equal to otherwise. The adjacency matrix is then symmetric and describes regular bi-directional displacements among the municipalities. The adjacency matrix contains all the topological information about the network but the dataset also provides the number of commuters attached to each link. It is therefore possible to go beyond the mere topological representation and to construct a weighted graph where the nodes still represent the municipal centres but where the links are valued according to the actual number of commuters. Analogously to the adjacency matrix , we thus construct the symmetric weighted adjacency matrix in which the elements are computed as the sum of the and flows between the corresponding municipalities (per day). The elements are null in the case of municipalities and which do not exchange commuting traffic and by definition the diagonal elements are set to zero . According to the assumption of regular bi-directional movements along the links, the weight matrix is symmetric and the network is described as an undirected weighted graph. The weighted graph provides a richer description since it considers the topology along with the quantitative information on the dynamics occurring in the whole network. It is however important to stress that while the nodes correspond to municipalities located in the physical space, the graph representation does not contain any information explicitly related to geographical distances and other spatial characteristic of the network. The definition of a network representation that correlates topological and traffic characteristics with the spatial properties of the SMCN requires more refined investigation and will be presented elsewhere (De Montis et al, forthcoming).
III The analysis of the topological properties of the SMCN
In this section, we analyze the topology of the SMCN and we propose possible territorial explanations for our findings. This network is relatively small being characterized by vertices and edges. The degree of nodes, which measures the number of links of each node, ranges between and and exhibits a high average value . The degree can be considered as a first indication of the topological centrality of a vertex: the importance of the corresponding municipal centre as attraction point for commuters in the network. A measure of the topological distance within the network is given by the shortest path length defining the distance between nodes in terms of links to be traversed by using the shortest possible path between the nodes. On the average, the shortest path length is , while the maximum length is just equal to . These values are small compared to the number of nodes, in agreement with a small-world behavior for which l typically scales as the logarithm of . Further information on the network’s topology is provided by the degree distribution defined as the probability that any given node has degree . In this case it is essential to distinguish between an ’exponential’ network similar to the usual random graph for which decreases exponentially fast, and scale-free networks indicative of hub-like hierarchies for which decreases typically as a power law (Albert and Barabasi, 2002; Amaral et al, 2000). In the present case, the degree probability distribution is skewed and is relatively peaked around a mean value of order (Figure 2).
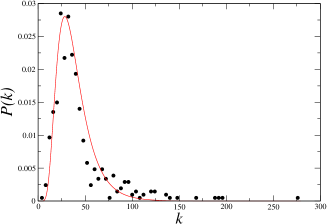
The tail of the distribution contains outliers with respect to a regular exponential decay, signaling the presence of municipal hubs, which exchange commuters with many others municipalities. However, a closer inspection of the distribution tail shows that the decay is not compatible with a heavy-tailed distribution. The tail has indeed a power-law behavior however with an exponent that ensures the convergence of the relevant moments of the distribution and does not imply a scale-free heterogeneity. In particular, the variance converges to a finite limit for infinitely large systems in contrast with scale-free networks, which have an infinite variance for infinite size networks.
A further relevant topological quantity is the clustering coefficient defining a measure of the level of cohesiveness around any given node. It is expressed as the fraction of connected neighbors
| (1) |
where is the number of links between the neighbors of the node and is the maximum number of possible interconnections among the neighbors of the node. This quantity is defined in the interval and measures the level of local interconnectedness of the network. If , the neighbors of the node are not interconnected at all, while corresponds to the case where all the neighbors are interconnected. A large clustering thus indicates the existence of a locally well-connected neighborhood of nodes. It is often convenient to average over all nodes with a given degree obtaining the clustering spectrum
| (2) |
where is the total number of nodes of degree . In Figure 3, on the left, we plot the clustering spectrum of the SMCN: we observe a decaying behavior with that varies from to values lower than .
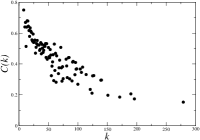
This indication of a decreasing clustering suggests that the SMCN behaves like other studied real networks, in that low degree municipalities belong to well interconnected working or studying communities while the high degree vertices, the urban hubs, connect otherwise disconnected regions. It is worth noting that this result is similar to the one obtained by Chowell et al (2003) for urban movement. There is a striking difference however since the SMCN is topologically very close to a random graph while the network studied in Chowell et al (2003) is a scale-free network. This similarity with a random graph is also confirmed by the average value of the clustering coefficient , that results to be of the same order of the clustering coefficient theoretically computed for the case of a generalized random graph, which is
| (3) |
predicting the value .
Another important property is the degree similarity of the neighbors of a node. This is measured by the average degree of the nearest neighbors of a given node
| (4) |
where denotes the set of neighbors of . Analogously to the clustering coefficient, we can average the assortativity over nodes with a given degree leading to
| (5) |
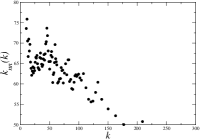
This spectrum measures the tendency of vertices to be connected with vertices with the same degree properties. If increases with , nodes have a tendency to connect to nodes with a similar or larger degree and the network is said to be assortative. In contrast, if is decreasing with , small degree nodes connect preferentially to hubs and the network is defined as disassortative. The result obtained for the SMCN is shown in Figure 3, on the right, and displays a with decreasing trend. This result seems to indicate that the SMCN belongs to the class of disassortative mixed networks. The disassortative behavior is typical of technological and transportation network and signals the presence of a global hierarchy in which the hubs tend to provide the connectivity to the small degree nodes at the periphery of the network.
IV The SMCN weighted network analysis
The ODT dataset provides the number of commuters among municipalities, allowing the construction of the weighted graph representation of the SMCN. The analysis of these commuting flows informs us on the system dynamical behavior and on the needs of the commuters in terms of regional transportation services and infrastructure. This information might provide relevant indication to researchers and decision-makers for addressing environmental policies and planning.
IV.1 Weight analysis
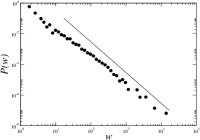
The values of the weights between pairs of vertices ranges between and with an average value much lower than . This fact is a signature of a high level of heterogeneity in the SMCN, since a peaked distribution of weights would very unlikely give a maximum value that is 3 orders of magnitude larger than the average. Indeed, the probability distribution that any edge has a weight displays a power-law decay with an exponent (Figure 4, on the left).
Another relevant quantity that characterizes the traffic is given by the strength of a node, defined as
| (6) |
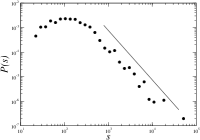
This quantity corresponds to the total traffic commuting in the town and can be considered as a measure of the traffic centrality of a municipality. For the SMCN, the strength varies between and while its average value is equal to . The probability distribution of the strength that any given node has a strength is fitted by a power-law regime with exponent (Figure 4, on the right). The strength provides an intuitive parameter for the description of the centrality of Sardinian municipalities according to the actual traffic handled generated and received by the municipality.
In the first instance, the variation in the weight and strength values implies that commuters’ flows are distributed in a broad spectrum with a large heterogeneity. It is worth commenting the implications of a power-law behavior of the statistical distributions and . This behavior defines the so-called heavy tailed distributions which have a virtually unbounded variance. A peculiar fact about a distribution with a heavy tail is that there is a finite probability of finding vertices with weight or strength much larger than the average value. In other words, the consequence of heavy tails is that the average behavior of the system is not typical. The characteristic weight (or strength) is the one that, picking up a vertex at random, should be encountered most of the times. This is evident in the bell-shaped distribution observed for the degree of the SMCN, in which the average value is very close to the maximum of the distribution and represents the most probable value in the system. On the contrary, the distributions shown in Figure 4 are highly skewed. Vertices have an appreciable probability of having large strength values, yet all intermediate values are probable and their mean does not represent any special value for the distribution. The power-law behavior and the relative exponent thus represent a quantitative measure of the level of heterogeneity of the network’s traffic.
Another important question concerns the distribution of the traffic among the different roads. All the connections could carry a similar flow or on the contrary one connection could dominate. A convenient measure of this is given by the disparity (Barthélemy et al, 2005), defined as
| (7) |
For hubs (), this quantity enables to distinguish situations (Figure 5, on the right) for which all weights are of the same order () from situations where only a small number of connections dominate ( is of order 1/n where ).
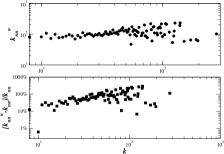
We computed the value of for each node and we average these quantities for each degree in order to obtain . The result is shown on Figure 5, on the left. We obtain here an average behavior of the form with . This result shows that the weights on the links attached to a given node are very heterogeneous. In other words, there are only a few dominant connections, while the traffic on all the other roads is very small.

IV.2 The analysis of traffic-topology correlations
In order to inspect in more detail the relation between the degree and the traffic, we show in Figure 6 the strength of nodes as a function of their degree. Despite the existence of inevitable fluctuations, we observe over a wide range of degrees a power-law behavior of the form with an exponent . Independent weights and connectivities would give a value (Barrat et al, 2004) and the result obtained here reveals that there is strong correlation between the traffic and the topology. The strength of the nodes grows faster than their degree: the more a municipality is connected with other centres the much more it is able to exchange commuters’ flows or, in other terms, the traffic per connection is not constant and increases with the number of connections.
The presence of weights also alters the definition of other structural measures. For instance, the standard topological clustering coefficient used in the previous section needs to be augmented by the inclusion of the actual traffic. In order to understand the weight structure and their relation with topology, the weighted clustering coefficient can be defined as follows (Barrat et al, 2004)
| (8) |
where is an element of the adjacency matrix and where is a normalization factor which ensures that belongs to . As for the topological case it is possible to average over all nodes of same degree obtaining the clustering spectrum . The weighted clustering coefficient counts for each triple formed in the neighborhood of the vertex i the weight of the two participating edges starting from i. In this way, we are not just considering the number of closed triangles but also their total relative weight with respect to the vertex’ strength. In the case of random networks but in real weighted networks, we can however face two different situations. If the topological clustering is generated by edges with low weight and therefore the cohesiveness is less important in terms of traffic properties. On the contrary, if we are in presence of a network in which the interconnected triples are more likely formed by edges with larger weight. We show in Figure 7 (on the right) an example of such a situation. It is clear that the interconnected triple has a major role in the network dynamics and organization, and that the clustering properties are not completely exploited by a simple topological analysis. The weighted clustering coefficient takes into account the weighted elements by an appropriate mathematical form.
In the SMCN the values of the weighted clustering coefficient are larger than the corresponding topological values (Figure 7, on the left) over the entire range of degree values. In contrast with the topological clustering, the weighted clustering coefficient is approximately constant over the whole range of connectivity.
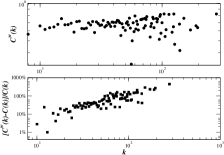

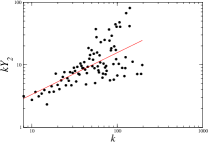
This result reveals the existence of a rich-club phenomenon in that important cities form a group of well interconnected nodes and that weight heterogeneity is enough in order to balance the lack of topological clustering. The rich-club phenomenon implies that in the SMCN the interconnected triplets are more frequently built by edges with a higher weight (Figure 7, on the right): in terms of local cohesiveness of workers’ and students’ commuting system, two different destinations available from a given city are more likely to be connected if the traffic flow leading to them is large. Similarly to the weighted clustering, we need to integrate the information on weights in a sensible definition of assortativity/disassortativity. This can be easily done by introducing the weighted average degree of the nearest neighbors of a given node
| (9) |

In this case, we perform a local weighted average of the nearest neighbor degree according to the normalized weight of the connecting edges. This definition implies that if the edges with the larger weights are pointing to the neighbors with larger degree and in the opposite case. The thus measures effective affinity to connect with high or low degree neighbors according to the magnitude of the actual interactions. In the SMCN the weighted average degree of the nearest neighbors displays a slightly increasing pattern, which is a signature of assortativity (Figure 8). This result is in sharp contrast with the behavior of the topological disassortativity and indicates an affinity of high-degree municipalities with other large centers with which they exchange high number of commuters: hubs have more frequently large traffic flows with municipalities with the same or higher-order degree. This phenomenon is illustrated on Figure 8, on the right: large weights connect hubs while the connection with nodes of smaller degree has smaller weights.
V Discussion: the SMCN and its relation with real environmental systems
V.1 Topology and environmental properties
The ranking connected to the degree (Table 1), an index of topological centrality, confirms the existence of administrative and socio-economic hierarchies: among the hubs, Cagliari is the most populated and regional capital town, Nuoro, Oristano and Sassari are province capital towns, Macomer and Quartu Sant’Elena are emerging productive and residential centres.
| Rank | Municipal centers | Degree |
|---|---|---|
| Cagliari | 279 | |
| Nuoro | 196 | |
| Oristano | 190 | |
| Macomer | 171 | |
| Sassari | 151 | |
| Quartu Sant’Elena | 140 | |
| Assemini | 139 | |
| Selargius | 127 | |
| Villacedro | 125 | |
| Ottana | 124 |
While the SMCN network is not scale free, the analysis of the degree probability distribution still reveals the presence of a relatively large number of well-connected towns that attract commuters from a fairly high number of satellite centers. The behavior of the clustering coefficient versus the degree indicates that for the clustering is relatively high and is a signature of the fact that small towns (small ) form very well connected clusters of municipalities exchanging students and workers. On the contrary, hub-towns () have less cohesive neighborood since they have commuting flows with several different local clusters of municipalities not interconnected among them. This kind of star-like topology with large municipalities acting as hub for several smaller groups of municipalities is confirmed by the analysis of the average nearest neighbor degree spectrum suggesting that the SMCN belongs to the class of dissassortative mixed networks. In this case, high degree hubs link preferentially with low degree municipalities. This topological analysis would suggest the existence of inter-municipal commuting districts of small towns, which pivot around a few urban poles and could be interpreted as the signature of a phenomenon often observed in urban and transportation systems when top functional rank towns attract commuters from small centers, behaving as urban poles. In such an environment, citizens of the satellite centers, being interested to regional-level services such as public administration, health and finance, prefer commuting to the pole rather than to a peer level town. The heterogeneity detected in the pattern of municipal centers could be seen as functional to an efficient behavior of the whole network, since each urban hub exchange commuters, and thus goods, services and revenues, with several small size towns. Turning to the geographical displacement of the hub centers, we can note that as expected they are located far away from each other. The distance between Cagliari and Sassari is equal to Km, while from Cagliari and Nuoro to Km, with respect to a total length of the island equal to Km.
V.2 Traffic and environment in the weighted characterization of the SMCN
The heterogeneity of the weights, as we saw in the previous chapters, is very high. This implies that the links are not all equivalent and thus warns against any interpretation based on the sole topology. Indeed, the analysis of the weighted network introduces new insights in the interpretation elaborated on the result of the topological properties under a variety of perspectives.
| Rank | Pairs of connected municipal centers | Weight |
|---|---|---|
| Cagliari-Sassari | 13,953 | |
| Sassari-Olbia | 7,246 | |
| Cagliari-Assemini | 4,226 | |
| Porto Torres-Sassari | 3,993 | |
| Cagliari-Capoterra | 3,731 |
Since the weights are distributed in a very heterogeneous pattern, the corresponding commuters’ flows display a wide range of values, which reflects the existence of a territorial hierarchy embedded and supported by the underlined transportation network. Precise indications emerge about dominant relations between some of the major poles of the island (Table 2): Cagliari, Sassari, Olbia, Assemini, Porto Torres and Capoterra.
In particular, the analysis of the strength probability distribution shows that municipalities identified as topological poles behave also as attractors of traffic flows. The strength is broadly distributed along the nodes, revealing a strong hierarchical dominance of the dynamic hubs over other smaller level centers.
| Rank | Municipal centers | Strength |
|---|---|---|
| Cagliari | 64,834 | |
| Sassari | 21,437 | |
| Quartu Sant’Elena | 18,431 | |
| Oristano | 12,130 | |
| Selargius | 10,084 | |
| Assemini | 7,915 | |
| Porto Torres | 6,886 | |
| Nuoro | 6,834 | |
| Carbonia | 6,616 | |
| Iglesias | 6,479 |
The analysis of the relation between strength and degree shows that traffic grows superlinearly with the degree confirming the fact that the more the topological hub-towns are connected and the larger their traffic centralities (ie. their capacity to attract Sardinian commuting students and workers). The ranking of Sardinian municipalities according to their strength is reported in Table 3.
From the behavior obtained for the disparity (Fig. 5), we see that only few connections emerging from the hub-towns carry a large amount of traffic, indicating a strong hierarchy and heterogeneity also in the local structure of the flows connecting large municipalities of the SMCN. This mirrors the underlying road network structure, which comprises a very small set of main highways (state roads), a large set of medium-sized roads (provincial roads) and a very large set of local roads (municipal roads). In particular, the link Cagliari-Sassari corresponds to state road number , named ’Carlo Felice’ that is the highway crossing longitudinally the island and can be considered as the backbone of the SMCN structure to which the lower hiearchical levels transportation structures connect.
The use of the traffic information provides further insight on the structure and hierarchy of the network. In particular the difference detected between weighted and topological clustering coefficients and weighted versus topological assortativity indicates the presence of a distribution of traffic flows that might be indicative of what sometimes is referred to as the rich-club phenomenon. Indeed, it is possible to observe that large traffic flows are characterizing the commuter traffic among municipalities with high centrality ranks as measured in terms of degree and strength. The accumulation of weight on these centers attenuates the decaying of the clustering and average nearest neighbour spectrum that appears to invert their behaviour by using the weighted definitions. This is the sign of the existence of a backbone of commuting patterns among large municipalities which are all interconnected, while the flows toward peripheral municipalities are indeed of small size. According to this picture, small municipalities are mostly connected each other through small traffic links, which correspond to the underlying second or third order roads. This completes the topological information and offers a clear picture of the ordering principles of the SMCN, in which a large number of small-size cities tend to become satellites of higher rank municipalities, shaping an overall network structure widely punctuated with star-like subsystems pivoting around important urban poles connected through dominant roads and the corresponding traffic flows. In this respect it appears that the network analysis presented here is able to provide an extremely detailed and quantitative characterization of the structure of the inter-urban traffic system.
V.3 Relating topology and traffic to socio-economic phenomena
In this section, we provide a discussion of the emergent topological and traffic properties in relations to the demographic and economic properties of the towns of the SMCN.


In the previous sections, we observe that the values of degree k and of the strength s, as indexes of topological and weighted centrality, confirm quantitatively historical structural hierarchies among Sardinian towns. The heterogeneity of the strength and the degree can be visualized as shown in the thematic map representations of Figure 9.
We explore now in quantitative terms the relation between the network properties and the environmental and economical indicators. One goal is to inspect whether the commuting network hubs correspond to economically relevant towns. As a measure of social and economic centrality of each town, we consider two variables: the total resident population (pop) in 1991 (Istat, 1991b) and the average monthly income (mmi). The average monthly income, an index of urban aggregated wealth, is defined as the product of the average monthly income per worker times the number of workers (Carcangiu et al, 1993). A map representation using these indicators is shown in Figure 10.


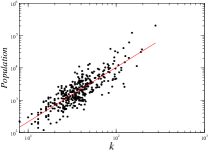
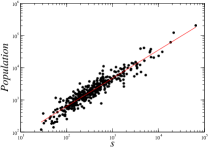
In Figure 11, we plot the variable as a function of the degree and the strength and we observe a clear positive correlation. The association between the population and these variables has a power-law behavior with two different exponents related by a factor . This is expected since we have already observed that traffic and degree are related by an empirical law . This implies that if the population has a scaling , the simple substitution of variable yields . This is confirmed in the analysis where the slopes of the two curves are related by a factor close to two. It is interesting to note that the population scales almost linearly with the traffic which suggest that a constant fraction of the population of every city commutes to another town, irrespectively of the size of the city.
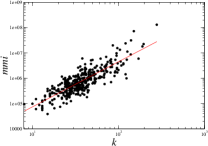
In Figure 12, the monthly municipal income () is plotted versus the degree and the strength . A positive correlation is signaled by a linear behavior on a log-Log scale which indicates the presence of a power law association. Also in this case, the exponents of the two relations confirm the general result of a quadratic relation between strength and degree.
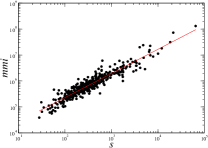
The results of this section confirm that the centrality measures (strength and degree) display trends consistent with the behavior of social and economic indicators such as population and income. In this sense, the higher the network centrality of a node, the higher is its demographic and economic size. The aforementioned territorial size measures, and grow much faster with the degree than with the strength . We can therefore identify a group of variables related to population (, , ) that are correlated by association laws with a behavior very close to the linear one. Their relation with the degree is however highly non-linear indicating that these variables grows much faster than the connectivity of municipalities. Indeed, inverting the relation between degree and traffic (or population) we have . The degree of a municipality is both an indicator of the level of economic and social exchange with other municipality and the transport infrastructure. The above relation implies that the economic and transportation infrastructures seem to grow at a pace slower than population indicators. It is not clear if this is a peculiar characteristic of the Sardinia region, due to political and urban planning decision, or a general property of population flows indicating a kind of adaptive equilibrium of a societal system. It is interesting to note that the worldwide airport network exhibits association trends among the network infrastructure and the population size very similar to those observed in this study (Barrat et al, 2004), suggesting a possible level of universality. The detailed study of other commuting and transportation networks is however needed in order to gain further insight on this issue.
VI Conclusions
In this paper, the inter-urban commuting system of the island of Sardinia has been represented as a weighted network. This representation allows the quantitative characterization of the capacity of attraction of each urban center on workers and students. By comparing the different levels of hierarchies emerging in the network with the pattern of demographic and economic poles we shed light on several structural and organizational properties of the inter-municipal traffic system.
At first sight, the SMCN is similar to a small-world random (Watts and Strogatz, 1998). The clustering organization of the SMCN however diverges from the usual random paradigm and similarly to other technological networks, such as the airline network, suggests a hierarchy of nodes where small municipalities are locally densely interconnected, while large municipalities (regional hub) provide the long range connectivity for different areas of the islands otherwise disconnected. This picture is reinforced by the evidence of a disassortative mixed network where the hub municipalities are found to act as star-like vertices connecting on average municipalities with low degree and low centrality ranking.
The weighted representation of the network allowed by the inclusion of traffic data complements the resulting picture with important information relating the commuter traffic to the available topological connectivity. We find that both the weights and the strengths are very broadly distributed, confirming the necessity of including those measures in a realistic description of the SMCN. In particular, the probability distributions of weights and strengths (commuter traffic handled by the municipality) display a power-law regime over a wide range of degree values: the SMCN behaves as a scale-free weighted network. In addition, the traffic is strongly correlated to the connectivity of the municipality and moreover, as shown by the disparity, it is largely concentrated on a very few links. This indicates that the more a town is connected, the much more it attracts commuters along a small number of dominant roads. Our analysis of weighted clustering suggests that important towns form a group of well-interconnected centers. It also shows that in the SMCN the main fraction of traffic exchanges occurs among the hubs of the network: hub centers accumulate their commuter traffic to same or higher order municipalities. In terms of environmental system analysis, a large number of small-size centers are commuting satellites of higher rank municipalities. The SMCN appears as widely punctuated with star-like subsystems pivoting around important urban poles connected preferentially through high traffic roads. In addition, the fact that the weighted clustering coefficient is large for the whole range of connectivity suggests that on the local scale there are micro-commuting basins, rationalized as inter-municipal districts of highly clustered small towns, which pivot around a few urban poles belonging to macro commuting basins.
Interestingly enough, there are striking similarities for the weight distribution and the clustering obtained in the present study with those obtained for the networks of population movements at the urban level (Chowell et al, 2003): this evidence suggests the existence of a set of basic mechanisms leading to common features in transportation systems at various granularity levels. In Table 4, the main characteristics of different transportations networks at different scales are shown. In particular, it seems that while the topological properties can vary, the broadness of the traffic distribution is a common feature to all these networks. Another common feature is the existence of correlation between the traffic and the topology.
| Network | ||||
|---|---|---|---|---|
| Global: WAN | Heavy tail | Broad | ||
| Inter-Cities | Light tail | Broad | ||
| Intra-urban | Heavy tail | Broad | n/a |
Finally, the existence of the municipality hierarchy that we have uncovered with the help of a weighted network analysis is confirmed by comparing demographic and economic urban polarization in Sardinia. Population and wealth, as proxies of the endowment of local resources, display a positive correlation with topological and dynamic centrality, strengthening the value of the network approach as a general tool for the analysis of inter-urban transportation systems.
VII Outlook
The results of this investigation open further questions that are currently under study. The indication of network centrality provides a powerful measure of similarity of the municipalities in attracting workers and students daily, more work however is needed to tackle the problem of the precise identification of the communities of workers/students commuting in Sardinia and their geographical basins. These studies may provide insights for bottom-up processes of decision-making and planning based on the definition of the existing emerging behaviors of the citizens. Finally, the SMCN is obviously not independent from geography and space. It refers to a physical network, mostly based on road systems, which display precise geographical characteristics. Further studies which include spatial aspects of the network are currently under progress. This forthcoming analysis will hopefully provide decision-makers and planners with relevant indications on the global effect of new infrastructure.
Acknowledgements.
A.V. is partially funded by the European commission under the project contract 001907 (DELIS). M.B. is on leave of absence from CEA-Centre d’Etudes de Bruyères-le-Châtel, Département de Physique Théorique et Appliquée BP12, 91680 Bruyr̀es-le-Cht̂el, France. The authors wish to thank Michele Campagna for his useful comments and discussions.VIII References
-
1.
Albert R, Barabàsi AL, 2002, ‘Statistical mechanics of complex networks’, Rev. Mod. Phys. 74, 47-97.
-
2.
Amaral LAN, Scala A, Barthélemy M, Stanley HE, 2000, ‘Classes of small-world networks’, Proc. Natl. Acad. Sci. (USA) 97, 11149-11152.
-
3.
Barabàsi AL, Albert R, 1999, ‘Emergence of scaling in random networks’, Science 286, 509-512.
-
4.
Barrat A, Barthélemy M, Pastor-Satorras R, Vespignani A, 2004, ‘The architecture of complex weighted networks’ Proceedings of The National Academy of Sciences 11, 3747-3752.
-
5.
Barthélemy M, Gondran B, Guichard E, 2003, ‘Spatial Structure of the Internet Traffic’ Physica A 319, 633-642.
-
6.
Barthélemy M, Barrat A, Pastor-Satorras R, Vespignani V, 2005, ‘Characterization and modelling of weighted networks’ Physica A 346, 34-43.
-
7.
Batty M, 2001, ‘Cities as small worlds’, Editorial Environment and Planning B: Planning and Design 28, 637-638.
-
8.
Batty M, 2003, ‘Network geography’ Paper 63, Centre of Advanced Spatial Analysis (CASA), UCL.
-
9.
Carcangiu R, Sistu G, Usai S, 1999, ‘Struttura socio-economica dei comuni della Sardegna. Suggerimenti da un analisi cluster’ (Socio-economic structure of Sardinian municipalities. Evidence from a cluster analysis), Working Papers, 3, CRENOS, Cagliari.
-
10.
Chowell G, Hyman JM, Eubank S and Castillo-Chavez C, 2003, ‘Scaling laws for the movement of people between locations in a large city’ Physical Review E 68, 066102.
-
11.
De Montis A, Barthélemy M, Campagna M, Chessa A, Vespignani V, forthcoming, ‘Topological and dynamic properties emerging in a real inter-municipal commuting network: perspectives for policy-making and planning’, Congress of the European Regional Science Association, Amsterdam, 23-27 August 2005.
-
12.
Dorogovtsev SN, Mendes JFF, 2003, ‘Evolution of networks: From Biological nets to the Internet and WWW’ Oxford Univ. Press, Oxford.
-
13.
Erdös P, Renyi P, 1960, ‘On the evolution of random graphs’ Publ. Math. Inst. Hung. Acad. 5, 17-60.
-
14.
Gastner MT, Newman MEJ, 2004, ‘The spatial structure of networks’ Cond-mat 0407680.
-
15.
Gorman SP, 2001, ‘The network advantage of regions: the case of the USA, Europe and China’ paper presented at the International Regional Science Association Meeting, Charleston, SC.
-
16.
Gorman SP, Kulkarni R, 2004, ‘Spatial small worlds: new geographic patterns for an information economy’ Environment and Planning B: Planning and Design 31, 273-296.
-
17.
Guimera R, Mossa S, Turtschi A, Amaral LAN, 2005, ‘The worldwide air transportation network: Anomalous centrality, community structure, and cities’ global roles’ Proc. Nat. Acad. Sci. (USA) 102, 7794-7799.
-
18.
Italian National Institute of Statistics (Istat), 1991a, 13th Censimento generale della popolazione e delle abitazioni, Matrice origine destinazione degli spostamenti pendolari della Sardegna (13th General census of population and houses, Origin destination matrix of the commuting movements of Sardinia).
-
19.
Italian National Institute of Statistics (Istat), 1991b, 13th Censimento generale della popolazione e delle abitazioni, (13th General census of population and houses).
-
20.
Jiang B, Claramount C, 2004, ‘Topological analysis of urban street networks’ Environment and Planning B: Planning and Design 31 151-162.
-
21.
Latora V, Marchiori M, 2000, ‘Harmony in the small-world’ Physica A 285, 539-546.
-
22.
Latora V, Marchiori M, 2001, ‘Efficient behaviour of Small-World Networks’ Phys. Rev. Lett. 87, 198701.
-
23.
Latora V, Marchiori M, 2002, ‘Is the Boston subway a small-world network?’ Physica A 314, 109-113.
-
24.
Latora V, Marchiori M, 2003, ‘Economic small-world behavior in weighted networks’ The European Physical Journal B 32, 249-263.
-
25.
Newman MEJ, 2003, ‘The structure and function of complex networks’ SIAM review 45, 167-256.
-
26.
Pastor-Satorras R, Vespignani A, 2004, ‘Evolution and Structure of the Internet’ Cambridge University Press, Cambridge, USA.
-
27.
Salingaros NA, 2001, ‘Remarks on a city’s composition’ Resource for Urban Design Information.
-
28.
Salingaros NA, 2003, ‘Connecting the Fractal City’ Keynote speech, 5th Biennial of town planners in Europe, Barcelona.
-
29.
Schintler AL, Gorman SP, Reggiani A, Patuelli R, Gillespie A, Nijkamp P, Rutherford J, forthcoming, ‘Scale-free phenomena in telecommunications networks’ Networks and Spatial Economics.
-
30.
Sen P, Dasgupta S, Chatterjee A, Sreeram PA, Mukherjee G and Manna SS, 2003, ‘Small World properties of the Indian Railway network’ Phys. Rev. E 67, 036106.
-
31.
Shiode N, Batty M, 2000, ‘Power law distribution in real and virtual worlds’ Paper 19, Centre of Advanced Spatial Analysis (CASA), UCL.
-
32.
Watts DJ, Strogatz SH, 1998, ‘Collective dynamics of ’small-world’ networks’ Nature 393, 440-442.
-
33.
Yook SH, Jeong H, Barabàsi AL, 2002, ‘Modeling the Internet’s large-scale topology’ Proc. Natl. Acad. Sci. (USA) 99, 13382-13386.