TESTS OF A ROMAN POT PROTOTYPE FOR THE TOTEM EXPERIMENT
Abstract
The TOTEM collaboration has developed and tested the first prototype of its Roman Pots to be operated in the LHC. TOTEM Roman Pots contain stacks of silicon detectors with strips oriented in two orthogonal directions. To measure proton scattering angles of a few microradians, the detectors will approach the beam centre to a distance of mm (= 1.3 mm). Dead space near the detector edge is minimised by using two novel “edgeless” detector technologies. The silicon detectors are used both for precise track reconstruction and for triggering. The first full-sized prototypes of both detector technologies as well as their read-out electronics have been developed, built and operated. The tests took place in the proton beam-line of the SPS accelerator ring. In addition, the pot’s shielding against electromagnetic interference and the longitudinal beam coupling impedance have been measured with the wire method.
1 Roman Pots for the TOTEM Experiment at LHC
The LHC experiment TOTEM [1] is designed for measuring the elastic pp scattering cross-section, the total pp cross-section and diffractive processes. These physics objectives require the detection of leading protons with scattering angles of a few rad, which is accomplished with a Roman Pot (“RP”) system having stations at 147 m and 220 m from the interaction point 5 where CMS will be located. Each station is composed of two RP units separated by 2.5 – 4 m depending on beam equipment integration constraints. Each RP unit consists of a vacuum chamber equipped with two vertical insertions (top and bottom) and a horizontal one. Each insertion (“pot”) contains a package of 10 silicon detectors in a secondary vacuum. The pots can be moved into the primary vacuum of the machine through vacuum bellows. In order to minimize the distance of the detectors from the beam, and to minimize multiple scattering, the wall thickness of the pot is locally reduced to a thin window foil (140 – 210 m).
The low impedance budget of the LHC machine (broadband longitudinal impedance limit ) imposes a tight limit on the RPs’ beam coupling impedance. Because of the beam’s bunch structure and its high intensity, the pick-up noise on the detector electronics caused by electromagnetic leakage is a potential concern and needs to be studied and minimised.
2 The Roman Pot Prototype in the SPS Beam
During the summer 2004 the TOTEM collaboration has performed tests on a prototype unit made of 2 vertical RPs. The unit has been installed in the LSS5 section of the SPS accelerator at CERN. The motors moving the pots towards the beam, the electronics of the detectors and the cooling system stabilising the temperature of the detectors inside the pots were operated remotely from a temporary control room in a surface building. The upper and lower pots contained each a set of 8 silicon strip detectors with 66 m pitch, built in two novel technologies allowing for efficiency up to the physical edge [1]. Six of them were read out with analogue APV25 chips and 2 with digital VFAT chips delivering the fast-or signal of all 512 strips. The latter were used for triggering the data acquisition system in coincidence with the sum signal of the four pick-up electrodes of a beam position monitor.
In the retracted pot position the thin windows were 40 mm away from the beam pipe axis. To watch the effect of the RPs’ movements on the beam quality, three beam loss monitors (BLMs) have been installed near the unit: one at 56 cm upstream on the top of the beam pipe and two at 65 cm downstream, one on the top and one on the bottom of the pipe. The BLMs used were cylindrical ionisation chambers filled with air.
TOTEM was the SPS main user during 2 shifts of 8 hours with dedicated coasting beam. Three bunch structures were tested: 1 single bunch in the ring, 4 bunches equally spaced, and 4 equally spaced trains of 4 bunches.
Detector data were taken with the two pots positioned independently between 6 mm and 14 mm ( mm) from the beam pipe centre. Because of contact problems with the Kapton connections between the individual detector/chip hybrids and the central electronics board of each pot, 4 out of the 16 detectors could not be read out. The high redundancy in the system’s design however allowed us to carry out the experiment as planned.
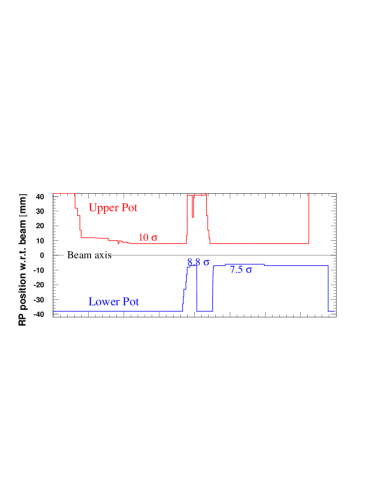

Figure 1 shows the scraping of the beam periphery by the pot as measured with the BLMs. The downstream monitors show spikes whenever one of the pots approaches the pipe centre closer than 10 mm (). As expected, the upstream BLM remains largely quiet, except when the bottom pot moves closer than , which creates an increased halo travelling around the ring. The general trend of increasing beam losses is caused by a slow beam growth as its quality deteriorates.

The trigger rates measured in the top pot for different distances are shown in Figure 2. Given the SPS revolution period of 23 s, the trigger probability varies between one trigger per 11 bunches at mm and one trigger per 18 bunches at mm. The latter distance corresponds to 17 , as also foreseen for the LHC at the 220 m station. The observed variation of the rate with the distance is not big because all measurements were made more than 8 from the beam centre where the halo is rather flat.
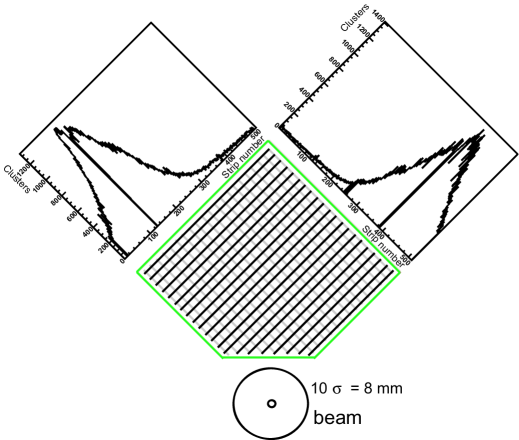
The response of the tracking silicon detectors conforms to expectations. Figure 3 shows the halo profiles measured by detector planes with orthogonal strips.
3 Laboratory Measurements of the RF Behaviour
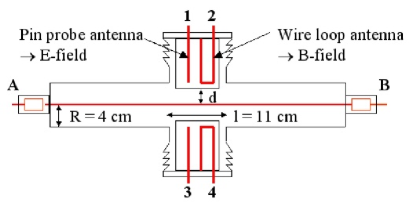
For the measurements of the pot’s radiofrequency behaviour a 0.3 mm thick wire was strung through the RP along its beam axis.
3.1 Attenuation of Electric and Magnetic Fields by the Roman Pot Window
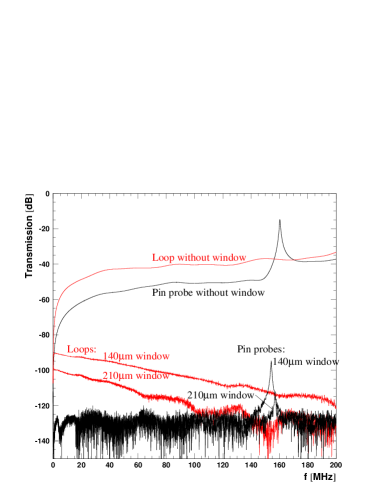
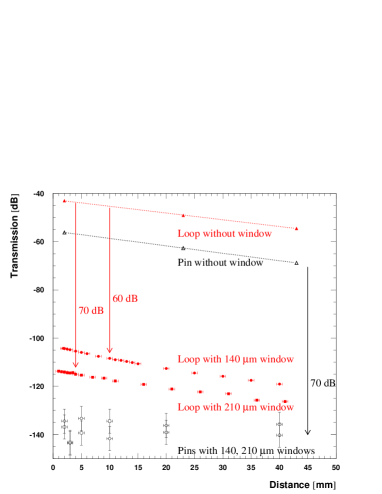
To determine the attenuation of electromagnetic fields by the RP’s windows, the silicon detectors were replaced with antenna insertions (Figure 4). A network analyser measured the transmission from one end of the RP (Port A) to each of the antenna outputs (Ports 1 to 4) for frequencies up to 200 MHz. The other end of the RP (Port B) was terminated with 50 . The transmitted signal was amplified by 30 dB. The top and bottom insertions had 210 m and 140 m thick windows respectively. To measure the pure signal coupling between the wire and the antennas, comparison measurements without any window have been made. The results for a distance of 2 mm are shown in Figure 5. The transmitted electric field is mostly smaller than the noise level of the measurement setup. Figure 6 shows the transmission from the wire to the antennas at the LHC bunch frequency 40 MHz as a function of the pot distance from the wire. The attenuation of the magnetic field by the 140 m and 210 m thick pot windows amounts to 60 dB and 70 dB respectively. The electric field is attenuated by at least 70 dB. The influence of bunch-generated fields on detectors and electronics remains to be measured in the future with a spark generator.
3.2 The Longitudinal Beam Coupling Impedance

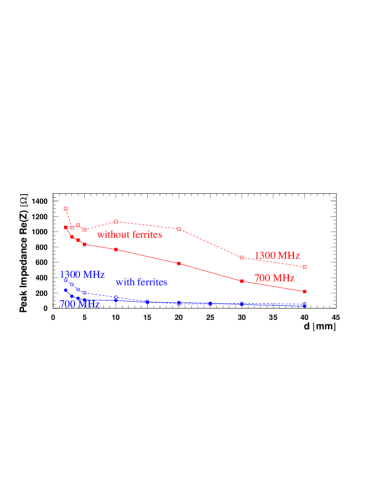
To determine the longitudinal beam coupling impedance , the complex transmission coefficient between Ports A and B (Figure 4) was measured with a network analyser. Then was calculated from with the RP at a distance , and a reference measurement with the RP in retracted position. The “improved log formula” proposed by Shaposhnikova and Jensen [2]
| (1) |
was used, where is the characteristic impedance of the unperturbed beam pipe, cm is the length of the perturbation (i.e. the diameter of the pot insertions), and is the frequency. The dash-dotted line in Figure 7 shows the real part of for mm with the original configuration of the RP. The dependence on is given in Figure 8 for the two main resonances. The approximately Gaussian LHC bunch structure with ns leads to a Gaussian envelope with GHz in the frequency distribution of the LHC current with harmonics every 40 MHz. Hence the relevant resonances lie well below 1 GHz. The dominant line at 740 MHz has an impedance of 1.2 k which yields an uncomfortably high where . After installation of little pieces of ferrite into the cavity around the RP insertion, this impedance is damped by a factor 5, demonstrating the effectiveness of the ferrite approach. For the final RP the geometrical ferrite arrangement will be optimised to further reduce the impedance.
References
- [1] TOTEM: Technical Design Report, CERN-LHCC-2004-002.
- [2] E. Jensen: PS-RF Note 2000-001, CERN 2000.