Environment influence on the IR fluorescence of Xe molecules in electron beam excited Ar–Xe mixture at high density
Abstract
We report new measurements of the near infrared (NIR) Xe excimer fluorescence in an electron–beam–excited Ar (90%)–Xe (10 %) mixture at room temperature. Previous measurements up to a density m-3 discovered a broad excimer fluorescence band at cm whose center is red–shifted by increasing (A. F. Borghesani, G. Bressi, G. Carugno, E. Conti, and D. Iannuzzi, J. Chem. Phys., 115, 6042 (2001) Bor ). The shift has been explained by assuming that the energy of the optical active electron in the molecule is shifted by the density–dependent Fermi shift and by accounting for the solvation effect due to the environment. We have extended the density range up to m confirming the previous measurements and extending the validity of the interpretative model. A detailed analysis of the width of the fluorescence band gives a value of 2.85 nm for the size of the investigated excimer state. Such a large value lends credence to the validity of the proposed explanation of the experimental findings.
pacs:
34.50.GbElectronic excitation and ionization of molecules; intermediate molecular states and 33.70.JgLine and band widths, shapes and shifts and 33.20.EaInfrared spectra1 Introduction
Irradiation of a noble gas sample with ionizing particles kogo ; nowak1 ; galy ; kannari , with lasers raymond84 ; museur94 , or with synchroton light dutuit78 may produce, in addition to excited and ionized atomic species, molecular excited states, such as Xe for instance, which are called excimers. Upon decay, excimers release a large fraction of the absorbed energy in the vacuum ultraviolet (VUV) range that is exploited in many applications. For this reason noble gas excimers play a significant role in many areas of physics.
In the laser physics area, ultraviolet– and vacuum ultraviolet lasers exploit excimers as light–amplifying media or as intermediate products in the kinetic chain leading to the population of the lasing level galy ; exc .
Excimer VUV fluorescence of noble gases is also used in scintillation particle detectors knoll . Fluorescence is the final step of the degradation of the energy released in the detector medium by an ionizing particle. The transition from the first excited excimer level to its dissociative ground state produces the VUV radiation koe that signals the passage of the energetic particle.
Among rare gases, Xe is particularly studied for several reasons. For particle–detection purposes, in fact, it combines a large atomic weight with a high scintillation yield and its VUV fluorescence occurs at the longest wavelength, thus making it more technologically amenable. Moreover, from a fundamental point of view, its excimers are more complex than those of other noble gases because of the larger spin–orbit coupling and overlap of atomic configurations.
The physical processes leading to excimer fluorescence in rare gases in low density limit are very well known nowak1 ; galy ; sauer85 ; audouard88 ; nowak2 ; keto97 ; mulliken70 ; moutard87 ; ulrich87 ; salamero81 ; millet78 . The potential curve of diatomic rare gas molecules in the ground state is repulsive except for a weak van der Waals attraction. An excited electronic state of the molecule can be obtained by promoting an electron to a Rydberg–like molecular orbital, whose nature may be either bonding or repulsive. Owing to the dissociative nature of the ground state, transition to it from a higher lying excimer level gives origin to fluorescence bands, whose width is related to the steepness of the potential of the molecular ground state.
In the case of Xe, two such VUV bands, named first– and second continuum, have been observed museur94 . The first excited excimer levels Xe and Xe (in the Hund’s case c) or and (in the notation, in which spin-orbit coupling is neglected) are produced in the collision of a neutral atom in its ground state Xe with atoms excited in the states 6s[3/2] and 6s[3/2] (in Racah notation), according to the reaction scheme moutard88
| (1) | |||||
| (2) |
The symbol ∗ indicates an excited state.
Subsequent radiative decay to the repulsive ground state
| (3) |
leads to the emission of the bands centered at 148 nm (first continuum) and 173 nm (second continuum). The former band is attributed to transitions from higher vibrational levels of the excimer level deriving from the A6s atomic configurations and is observed at very low pressure ( Pa). The latter band, exploited in Xe gas based detectors, appears and dominates at higher pressure because it occurs after vibrational relaxation of the excited molecule.
Much less attention has been devoted to possible infrared (IR) or near–infrared (NIR) fluorescence, related to transitions between higher lying excited states of the rare-gas dimers in pressurized gas, although some broad bands have been observed in noble gases at intermediate pressure ( MPa) kogo ; arai69 , IR scintillation has been detected in liquefied Ar and Xe bressi00 , and atomic IR scintillation has been revealed in alpha–particle–excited noble gas at low–pressure ( kPa) solim88 ; lindblom88 ; lindblom88b .
Only recently, a strongly peaked NIR fluorescence band has been detected at moderately high pressure ( MPa) in pure Xe and in an Ar–Xe mixture, both excited with an energetic electron beam Bor . The band, centered around cm has been attributed to a transition between bound– and dissociative levels of the Xe2 excimer, which are lying higher in the energy relaxation pathway that eventually leads to the population of the excimer levels responsible of the VUV continua.
The observed fluorescence spectra in pure Xe and in the Ar (90%)–Xe (10%) mixture are similar because they are both due to the de–excitation of the Xe excimer. In fact, energy transfers from Ar to radiative states of Xe∗ occurs readily and heteronuclear three–body collisions of the type
| (4) |
lead to the formation of the Xe2 species even in the mixture exc .
The main feature shown by the observed NIR band is that its center is red–shifted upon increasing the gas pressure. The wave number of the band peak decreases linearly with the gas density up to m m-3 is the density of the ideal gas at temperature K and pressure MPa.
The density dependence of the properties of the NIR band have been interpreted in terms of the influence of the environment on the excimer Bor . It is assumed that the higher lying Rydberg–like levels of the excimer are modified by two density–dependent effects. The first one is the solvation effect due to the presence of the atoms of the host gas. Many of them are encompassed within the large orbit of the electron in the Rydberg–like state and screen the Coulomb interaction between the electron and the Xe core, leading to a reduction of the difference between the energy levels. Thus, the solvation always moves the transition to longer wavelengths.
The second effect is due to the quantum nature of the electron and to its interaction with the atoms of the host gas. On a large orbit, the electron is quite delocalized and its wave function spans a region containing several atoms, with which it is thus interacting simultaneously. This fact leads to a density–dependent shift of the energy of the electron ground state that is negative or positive depending on whether the electron-atom interaction is either attractive or repulsive fermi34 .
This interpretative model of the observed red–shift gives good agreement with the experimental data in the investigated density range.
It is to note that this phenomenon is related to the modifications of the molecular properties of Wannier–Mott–type impurity states in high–density liquids raz70 , which have a unique parentage to the Rydberg states of an isolated molecule in a low density gas messing77 ; messing77b . Moreover, it would be interesting to ascertain why NIR excimer fluorescence has not been detected yet in liquefied rare gases.
In the previous measurements Bor , it has been also observed that the width of the fluorescence band increases linearly with the gas density in both the pure gas and the mixture. It is known that a linear increase of the width of a band or line with increasing density is due to an increase of the collision rate, which decreases the mean lifetime of the atomic or molecular species. The analysis of the broadening of the band may therefore lead to the evaluation of the collision cross section of the excimer and to an estimate of its size that would allow the verification of the conditions, under which the model of the excimer as a Rydberg–like atom is valid. This analysis was not carried out in the previous mesurements Bor .
For these reasons, we have carried out further and accurate measurements of the NIR fluorescence in the Ar–Xe mixture by extending the investigated density range up to m approximately 3 times larger than in the previous measurements. The goal is to confirm the validity of the interpretative model.
2 Experimental details
The experimental goal is the detection and analysis of the NIR spectrum emitted by a gas sample at high pressure and excited by an ionizing electron beam. We have used the same apparatus described in detail in the previous paper Bor . We report here only its main features and some minor modifications. The electron beam is produced by a home made electron gun described in a previous work belogurov00 . Electrons are injected in ns–long pulses with energy keV. Each pulse contains nC charge and are repeated at a rate of Hz. The beam enters the gas chamber through a m–thick Kapton film. Upon crossing the film, electrons lose about of their initial kinetic energy and the beam in the gas partly loses its directionality. The range of energetic electrons in the gas varies approximately between 5 and 100 mm, depending on the gas pressure.
The gas sample is kept at room temperature inside a cylindrical stainless–steel chamber, which is evacuated down to mbar before being filled with the gas. The gas is passed through an Oxisorb cartridge for purification purposes. The pressure is measured with a Sensotec STJE/1833-35 pressure gauge with an accuracy of kPa. The cell is leak proof up to MPa.
The density is computed from the pressure values by using the equation of state of Argon found in literature rabi . We have also calculated the density of the mixture by assuming an ideal gas mixture law and using the appropriate equation of state rabi . Although at room temperature Xenon is relatively close to its critical temperature, the differences in the densities computed in either way are less than even at the highest pressure.
The emitted light exits the chamber through a quartz window and it enters a FTIR (Fourier Transform InfraRed) Michelson–type interferometer (Equinox , Bruker Optics). The interference signal is detected by an InGaAs photodiode (G, EG&G) kept at room temperature. The output signal of the photodiode is pre–amplified by using an active integrator with a conversion factor of mV/C and an integration constant of s. The signal is then digitized by a 16–bit A/D converter and is stored in a computer.
Because the electron source is pulsed and each pulse is too short to obtain a complete interferogram, a step–scan technique is used haseth . The movable mirror scans the whole range in equal steps, whose amplitude is controlled by a reference He–Ne laser, until a complete interferogram is acquired. At each intermediate position of the mirror several light pulses are recorded and averaged together in order to improve the S/N (Signal-to-Noise) ratio. The interferogram is converted to spectrum by commercial software.
The interferometer has been carefully aligned with respect to the IR source in order to maximize the signal detected by the photodiode and, at the same time, to have good interference. A first calibration has been implemented by using an IR solid state laser with nm.
As instrumental function we use a –term Blackmann–Harris function in order to suppress the wiggles in the wings of the peaks in the spectrum. Because the shape of the spectral line, measured at finite resolution, is the convolution of the natural and instrumental line shapes, the natural line shape can only be observed if the width of the instrumental line shape is small compared to natural line width allard82 .
Because the full width at half maximum of the fluorescence band is cm we have set the intrumental resolution to 100 cm Such resolution has been chosen for two reasons. It must be not too low in order to avoid excessive instrumental broadening and not too high in order to limit the acquisition time to reasonable values. In fact, the electron beam degrades the Kapton film that consequently releases impurities that quench the formation of the excimers and the fluorescence intensity might decrease too much during each experimental run.
3 Experimental results
We have measured IR time–integrated emission spectra in Ar– Xe gaseous mixture up to MPa at room temperature. The corresponding gas densities are comprised in the range m-3. We have extended by a factor 3 the density range explored in the previous experiment Bor .
In Figure 1 we show a typical spectrum obtained for MPa.
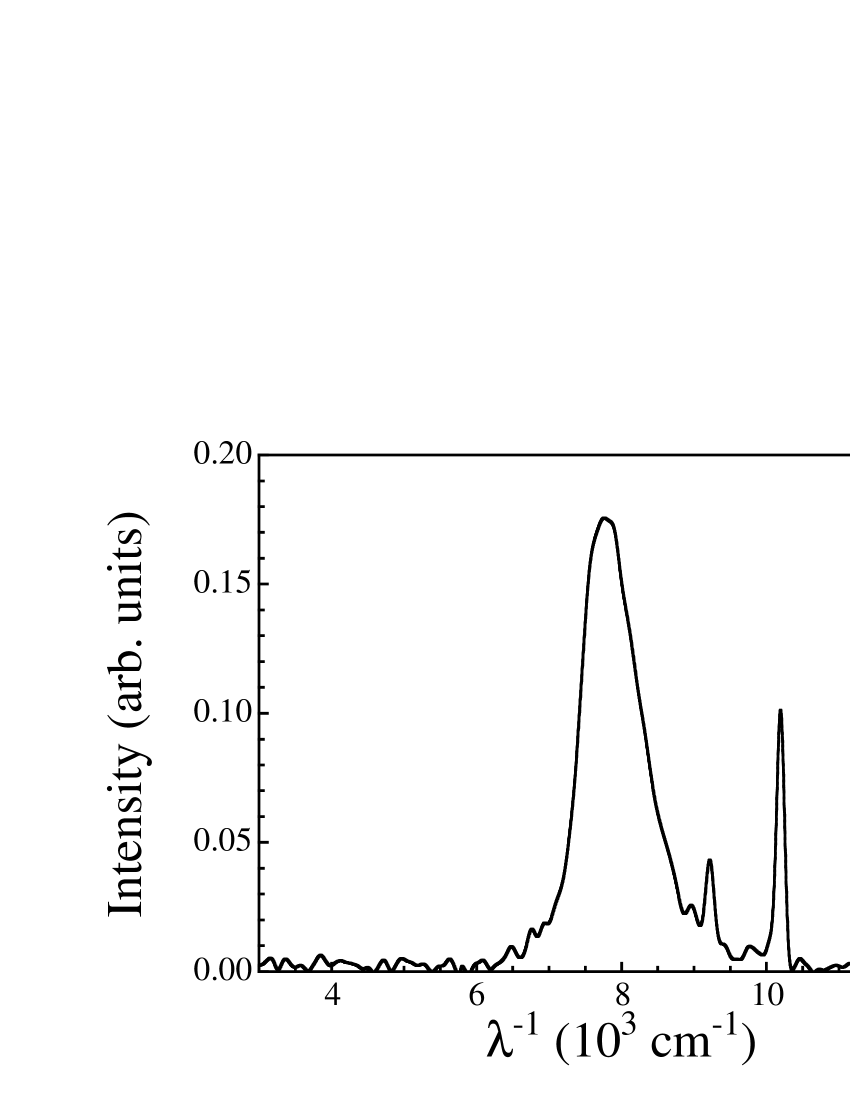
The main feature is the broad continuum band centered at cm very similar to that previously observed Bor .
This band has been observed also in pure Xe Bor and is thus ascribed to a bound–free transition of the Xe excimers.
In addition to the excimer band, two atomic lines can be observed in the spectrum, which are used as a reference to check the accuracy of the determination of the wave number of the fluorescence band, which is located nearby. These line are Xe I lines present in the NIST databases Nist3 . The first one occurs at cm-1 and is associated with the ps transition sadeghi77 . The second one, at cm is associated with the ps transition. This latter line appears to be enhanced in Ar–Xe mixture with respect to pure Xenon at low pressures galy and also at higher pressures Bor .

In Figure 2 we show two spectra recorded at two different pressures, namely MPa and MPa, which correspond to the densities m-3 and m respectively. It is evident that the fluorescence peak undergoes a red–shift as the pressure is increased and that its width also increases. Such behavior confirms the results obtained previously for smaller densities Bor .
The red–shift of the emission band can be best seen by plotting the position of its maximum as a function of the density, as shown in Figure 3. In order to give an estimate of the statistical accuracy of the central wavenumber reported in this Figure, several lorentzian fits of the spectrum have been carried out on different data ranges around the peak.
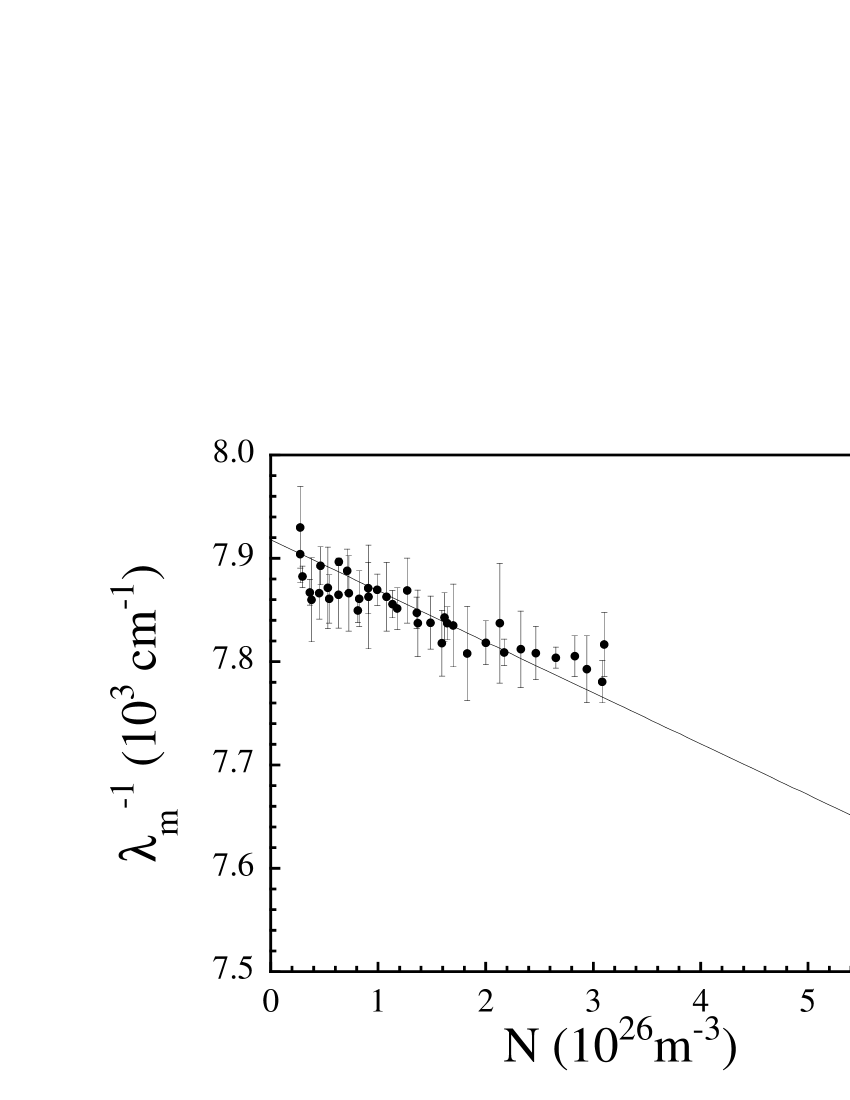
The central wavenumber of the band decreases linearly with The present data are compatible, within the experimental accuracy, with the data of the previous work, in which a third–order polynomial fit of the spectrum around the maximum was used to determine its position Bor .
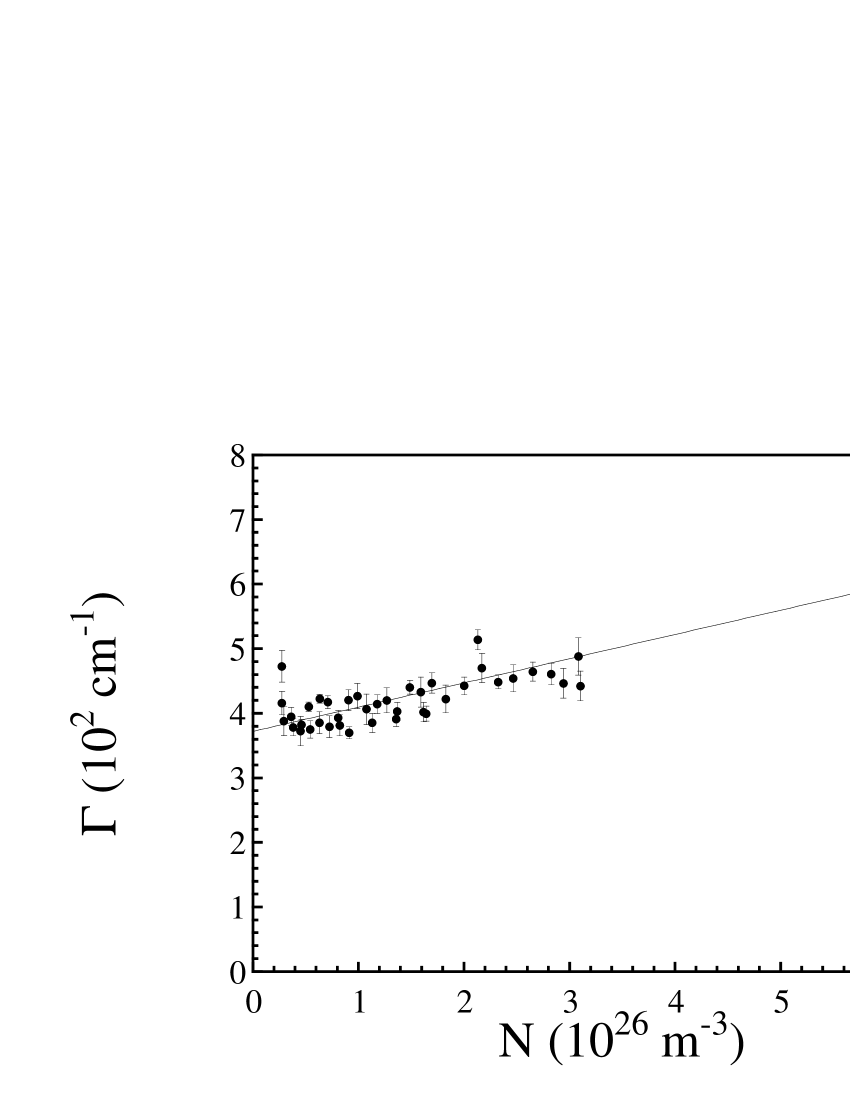
Another important feature of the excimer band is its pressure broadening. In Figure 4, the half width at half maximum, is shown to increase linearly with The error bars have been determined with a procedure similar to that used for Figure 3.
4 Discussion
The excimer band maximum is centered at cm-1 that corresponds to nm and to a transition energy of eV. Such a large energy value corresponds to electronic transitions.
The large width of the NIR continuum suggests that the transition takes place between a high–lying bound excimer level to a lower dissociative one. If the transition were involving two bound excimer levels, its width should be much sharper mulliken70 .
Moreover, the transition from the first excited excimer level to the ground state corresponds to an energy of eV. Thus, the observed emission does not involve the excimer ground state and is a transition between higher lying excimer levels, which are populated in one of the possible route, in which the initial electron kinetic energy is dissipated in the system.
The observed wavelength range may correspond to the energy difference between the stable excimer level ( ) of Ad configuration, correlated with the Xe (1S0) +Xe∗ (pPp) (or Xe∗ (p5[2P3/2]d)) dissociation limit, and the energy level of the XeS + Xe∗ p5 [2P3/2] s). The bound potential curves derive from p and d atomic levels, which are the first excited states of Xe. The dissociative potential curves derive from the s atomic level mulliken70 .
It is easy to see from Figure 3 that the wavenumber of the center of the NIR continuum depends linearly on The negative slope of the linear fit clearly indicates red–shift. The parameters of the linear fit are
The previous experiment Bor , carried out in a more restricted density range, yielded the values cm-1 for the intercept at zero density, and for the slope, respectively. The present measurements are compatible, within the experimental accuracy, with the previous ones. However, the present data have a larger statistical significance owing to the higher number of experimental points and to the larger density range investigated.
We have developed a simple model that takes into account the interaction of the outer electron in the excimer with the atoms of the host gas in order to explain the observed density dependent red–shift Bor . This model is also able to explain the reason why the red–shift of the excimer band in pure Xe () is much larger than in the mixture.
The electronic structure of homonuclear excimers can be accurately described by an ionic molecular core (Xe) plus an electron in a diffuse Rydberg orbital, whose radius is much larger than the internuclear distance kogo . The evolution of a Rydberg state as a function of density bears some similarities with the Wannier impurity states in liquids or solids messing77b . The Wannier excitons are related to high–extravalence excitations of atomic and molecular impurities messing77 ; messing77b , which show a density–dependent red–shift when the impurity is embedded in a high polarizable medium, while they are blue–shifted when the host gas is less polarizable messing77 .
This analogy suggest to describe excimer decays in dense noble gases in the same way as Wannier–Mott excitons are treated in liquids and solids raz70 . The energy eigenvalues of the n Wannier impurity state are given by raz70
| (5) |
where is the gas phase ionization potential, is the polarization energy of the medium due to the ionic positive core, and is the density of the host. is the energy of the bottom of the conduction band relative to the vacuum level. The last two terms of the energy eigenvalues in Equation 5 turn out to be density dependent.
The last term in Equation 5 expresses the coulombic interaction of the electron with the host atoms. (eV) is the exciton effective Rydberg constant, which takes into account the effective electron mass in the conduction band. is the free electron mass. is the dielectric constant of the medium that can be calculated with the Lorentz–Lorenz formula , where is the atomic polarizability and the vacuum permittivity.
The term can be approximated at the present densities by the Fermi potential that describes a quantum effect related to the large ratio of the wavelength of the Rydberg electron to the interatomic distance. The interaction of the Rydberg electron with the atoms of the host gas produces a density–dependent shift of the electron energy. For large electron orbits it converges to a limit that is proportional to the density fermi34
| (6) |
where and is the Planck constant. is the scattering length for electron–atom interaction, which is negative for an attractive potential and positive for a repulsive one zecca96 . If , is also negative. This implies a density–dependent red–shift of the spectral lines.
The Fermi energy shift probably, does not contribute to the energy of the final state because, when the excimer decays to a lower–lying repulsive level, its radius in the final state is much smaller than that of the starting state and its mean lifetime is too short for the outer electron to sample the environment. Therefore, the energy of the dissociative state is written by dropping in Equation 5
| (7) |
Furthermore, it is assumed that is the same in the initial and final states.
The central wavenumber of the transition between the upper level of principal quantum number and the lower dissociative level of principal quantum number is
| (8) |
and are the usual universal constants. At the densities of this experiment, the dielectric constant can be approximated to first order in the density by
By expanding to first order in and rearranging, we obtain
| (9) |
where
The first term in parentheses in Equation 9 is a solvation energy and, thus, it always shifts the spectrum to longer wavelengths. The second term increases this shift if or decreases it if . In Equation 9, is a fitting parameter that corresponds to the experimental value of the wavenumber in the zero–density limit, i. e., the mean energy of the transition.
We note that the concentration of the mixture is large enough to permit excimer formation, but also small enough that the Xe excimers are surrounded by Argon atoms. Thus, in Equation 9, on average, the atomic polarizability and the scattering length of Ar are used. Their values are Fm maitland81 and a zecca96 , respectively. The theoretical slope is thus m to be compared with the present value The difference between the experimental and the theoretical determinations of the slope might be traced back to the approximation of neglecting the Fermi contribution in the final state.
Another important piece of information that can be obtained from the experimental data is the density dependence of the width of the excimer band. The increase of collision frequency by increasing pressure causes a broadening of the band. By inspecting Figure 4, we observe that is well fitted to the straight line
| (10) |
where cm-1 is the half–width in the zero-density limit, and m2 (or cm-1m3 in practical units) is positive and clearly indicates broadening.
The data reported in Figure 4 have been corrected for the instrumental line width cm-1. The observed width is related to the true width and the instrumental one as
| (11) |
and the influence of on the true width is at most.
In the case of an atomic line, the width represents the total number of spontaneous transition per second from an initial excited energy state to a final one and it is related to the mean lifetime of the state by the uncertainty principle. For a continuous band, however, the transition involves a broad continuum of final energy states, so that the width is an estimate of their energy range. In any case, there is an evident pressure dependent band broadening similar to line broadening in pure atomic transition margenau36 .
In addition to instrumental broadening, Doppler– and collision broadening, which will be described in Appendix, may affect the width of the band. In the present case, the Doppler effect gives a broadening cm -1 and is completely negligible. Impact broadening is proportional to the density with a proportionality coefficient m two orders of magnitude smaller than the observed and is therefore neglible, too.
At the densities of this experiment, the average interatomic distance is comparable to the atomic van derWaals radii and the results of the impact broadening theory cannot be applied.
In this situation, we characterize the broadening according to pure kinetic theory by introducing an effective total scattering cross–section that can be determined from the experimental band width. This procedure will enable us to give an estimate of the size of the excited state of Xe investigated in this experiment.
The measured half–width is related to the mean lifetime of the species from the relation
| (12) |
where is the inverse mean lifetime in the zero–density limit and is the collision frequency. is the average velocity. is the temperature, is the gas constant, and is the reduced molecular mass of the XeAr system maitland81 . is the total cross–section and can be determined from the slope of the linear fit of as a function of
The fit of the experimental data yields m2. The cross section is related to the collision diameter which represents the distance between the particle centers at the instant of collision, by , as it is derived from quantum mechanics in the limit of the low–energy hard–sphere scattering schiff84 .
The collision diameter for the Xe excimer–Ar atom system turns out to be nm. The Argon hard sphere diameter is nm maitland81 . Thus, the excimer diameter turns out to be nm. Such a large value supports the assumption that the orbit of the outermost electron is large enough to encompass several atoms of the host gas, thus justifying the approximation of continuum dielectric screening used in the model.
5 Conclusions
We have carried out accurate measurements of the NIR fluorescence band of Xe excimers produced in an electron–beam–excited Xe–Ar gaseous mixture as a function of the gas density, up to a maximum density where is the density of the ideal gas at standard temperature and pressure. We have thereby extended by a factor 3 the density range explored in the previous measurements Bor , which spanned the density up to 7.5
We have observed a red–shift of the excimer spectra that is linear with up to In the density range common to both series of measurements, the results are compatible with each other within the experimental accuracy. Therefore, the present measurements essentially confirm and extend the results obtained in the previous experiment Bor .
We have quantitatively explained the density dependent shift of the maximum with a model that puts into evidence the interaction between the outermost electron of the Xe2 molecule and the atoms of buffer gas. A great polarizability and a negative scattering length of the buffer gas produce a red–shift. This fact is well confirmed by experimental measurements in pure Xe gas Bor , for which these requirements are met.
The density dependent red–shift of the excimer fluorescence in this system, as far as its dependence on the electron–atom scattering length and on the atomic polarizability of the gas atoms, bears strong analogies with the shift of the high–extravalence excitation transition to the s state of Xe impurity in fluid Ar and Ne messing77 .
Finally, for the first time the analysis of the broadening of the Xe excimer band has been carried out. Collisions are the most important causes of the band broadening. From the density dependence of the band width the collision cross section of the XeAr system can be computed and the molecular radius can be determined. Its value for the Xe molecule turns out to be 2.85 nm. Such a large value lends credence to the model of the excimer as an ionic core plus an electron in a Rydberg–like state, whose very large orbit encompasses many atoms of the host gas.
Appendix
In this Appendix we briefly describe the main mechanisms that can concur to the broadening of a line or band. The first one is the Doppler effect, which is independent of the density of the gas. It causes the emission band to take on a gaussian shape, whose width is margenau36
| (13) |
is the speed of light and is the reduced molecular mass of the XeAr system. For this experiment, K, cm-1 and is completely negligible with respect to the band full–width.
The other effect is collision broadening. The impact theory has been developed in the limit of low densities allard82 ; margenau36 ; vleck45 ; lewis59 , at which atoms or molecules interact via van der Waals forces. The potential due to a long–range attraction, as firstly derived by London london30 , is
| (14) |
where is the distance between the two interacting particles e is given by maitland81
| (15) |
where are the atomic polarizabilities of the two different atoms at the imaginary frequency . The expected broadening depends on and linearly on the density allard82
| (16) |
where is a numerical factor allard82 .
It is possible to calculate if is known and compare it with the value of the experimental fit in order to estimate the influence of van der Waals broadening.
For the Xe2–Ar system is unknown. However, estimates of for the system Xe–Ar are available from density functional theory, Jm6 and96 . We thus obtain m m2. The result is nearly two orders of magnitude smaller than the experimental and the van der Waals broadening is negligible in our experiment.
It is to remark the fact that we have used a value that is not the correct one. There are indications in literature and96 that for a system consisting of a noble gas plus a diatomic molecule is approximatively twice as large as for the system, in which the molecule is replaced by its parent atomic species. Even using such a larger value this correction remains negligible.
We have considered here only dipole-dipole interaction. In order to give a more complete treatment of impact broadening, repulsive interaction and higher–order multipole interactions should be taken into account hind66 ; hind70 but they give even more negligible contributions.
Finally, this theory is valid only for atoms in the wings of the potential, for which the atom–atom distance is greater than the van der Waals radius, namely, at pressures much lower than those of this experiment, in which the average interatomic distance is comparable with the van der Waals radius.
References
- (1) A. F. Borghesani, G. Bressi, G. Carugno, E. Conti, and D. Iannuzzi, J. Chem. Phys. 115, 6042 (2001)
- (2) S. Arai, T. Oka, M. Kogoma, and M. Imamura, J. Chem. Phys. 68, 4595 (1978)
- (3) G. Nowak, L. Frey, and J. Fricke, J. Phys. B: At. Mol. Phys. 18, 2851 (1985)
- (4) J. Galy, H. Brunet, C. Dominique, P. Roger, and J. L. Teyssier, J. Phys. B: At. Mol. Phys. 25, 5141 (1992)
- (5) F. Kannari and W. D. Kimura, J. Appl. Phys. 63, 4377 (1988)
- (6) T. D. Raymond, N. Boewering, C.-Y. Kuo, and J. W. Keto, Phys. Rev. A 29, 721 (1984)
- (7) L. Museur, A. V. Kanaev, W. Q. Zheng, and M. C. Castex, J. Chem. Phys. 101, 10548 (1994)
- (8) O. Dutuit, R. A. Gutcheck, and J. Le Calvé, Chem. Phys. Lett. 58, 66 (1978)
- (9) C. K. Rhodes (ed.), Excimer Lasers, Topics in Applied Physics, vol. 30 , (Springer, Berlin, 1979)
- (10) G. F. Knoll, Radiation Detection and Measurements, (Wiley, New York, 1989)
- (11) H. H. Koehler, L. J. Ferderber, D. L. Redhead, and P. J. Ebert, Appl. Phys. Lett. 21, 198 (1972)
- (12) R. Sauerbrey, H. Einzenhoefer, U. Schaller, and H. Langhoff, J. Phys. B: At. Mol. Phys. 19, 2279 (1985)
- (13) E. Audouard, P. Laporte, J. L. Subtil, and N. Damany, J. Chem. Phys. 89, 6176 (1988)
- (14) G. Nowak and J. Fricke, J. Phys. B: At. Mol. Phys. 18, 1355 (1985)
- (15) J. W. Keto, H. Cai, M. Kykta, C. Lei, T. Moeller, and G. Zimmerer, J. Chem. Phys. 107, 6080 (1997)
- (16) R. S. Mulliken, J. Chem. Phys. 52, 5170 (1970)
- (17) P. Moutard, P. Laporte, J. L. Subtil, N. Damany, and H. Damany, J. Chem. Phys. 87, 4576 (1987)
- (18) A. Ulrich H. J. Koerner, W. Kroetz, G. Ribitzki, D. E. Murnik, E. Patthias, P. Kienle, and D. H. Hoffmann, J. Appl. Phys. 62, 357 (1987)
- (19) Y. Salamero, A. Birot, H. Brunet, H. Dijols, J. Galy, and P. Millet, J. Chem. Phys. 74, 288 (1981)
- (20) P. Millet, A. Birot, H. Brunet, J. Galy, and B. Pons-Germany, J. Chem. Phys. 69, 92 (1978)
- (21) P. Moutard, P. Laporte, J. L. Subtil, N. Damany, and H. Damany, J. Chem. Phys. 88, 7485 (1988)
- (22) S. Arai and R. Firestone, J. Chem. Phys. 50, 4575 (1969)
- (23) G. Bressi, G. Carugno, E. Conti, D. Iannuzzi, and A. T. Meneguzzo, Nucl. Instrum. Meth. Phys. Res. A 440, 254 (2000)
- (24) O. Solim, D. Kronman, P. Lindblom, U. Rosengard, and K. Vuorinen, Nucl. Instrum. Meth. Phys. Res. A 268, 209 (1988)
- (25) P. Lindblom and O. Solim, Nucl. Instrum. Meth. Phys. Res. A 268, 204 (1988)
- (26) P. Lindblom and O. Solim, Nucl. Instrum. Meth. Phys. Res. A 268, 212 (1988)
- (27) E. Fermi, Il Nuovo Cimento 11, 157 (1934)
- (28) B. Raz and J. Jortner, Proc. Roy. Soc. London, Ser. A 317, 113 (1970)
- (29) I. Messing, B. Raz, and J. Jortner, Chem. Phys. 23, 23 (1977)
- (30) I. Messing, B. Raz, and J. Jortner, Chem. Phys. 25, 55 (1977)
- (31) S. Belogurov, G. Bressi, G. Carugno, E. Conti, D. Iannuzzi, and A. T. Meneguzzo, Nucl. Instrum. Meth. Phys. Res. A 449, 254 (2000)
- (32) V. A. Rabinovich, A. A. Vasserman, V. I. Nedostup, and L. S. Veksler, Thermodynamical Properties of Ne, Ar, Kr, and Xe, (Hemisphere, Washington. D.C., 1988)
- (33) P. R. Griffiths and J. A. de Haseth, Fourier Transform Infrared Spectroscopy, (Wiley, New York, 1986)
- (34) N. Allard and J. Kielkopf, Rev. Mod. Phys. 54, 1103 (1982)
- (35) C. J. Humphries and W. F. Meggers, J. Res. NBS 10, 139 (1933)
- (36) N. Sadeghi and J. Sabbagh, Phys. Rev. A 16, 2336 (1977)
- (37) A. Zecca, G. P. Karwasz, and R. S. Brusa, Nuovo Cimento A 19, 1 (1996)
- (38) G. C. Maitland, M. Rigby, E. Brian Smith, and W. A. Wakeham, Intermolecular Forces. Their Origin and Determination, (Clarendon, Oxford, 1981)
- (39) H. Margenau, Rev. Mod. Phys. 8, 22 (1936)
- (40) L. I. Schiff, Quantum Mechanics, (McGraw Hill, New York, 1984)
- (41) J. H. Van Vleck and U. F. Weisskopf, Rev. Mod. Phys. 17, 227 (1945)
- (42) H. Margenau and M. Lewis, Rev. Mod. Phys. 31, 569 (1959)
- (43) F. London, Z. Phys. 63, 245 (1930)
- (44) Y. Andersson, D. C. Langreth, and B. I. Lundqvist, Phys. Rev. Lett. 79, 102 (1996)
- (45) W. R. Hindmarsh, A. D. Petford, and G. Smith, Proc. Roy. Soc. A 297, 296 (1966)
- (46) W. R. Hindmarsh, A. N. DuPlessis, and J. M. Farr, J. Phys. B: At. Mol. Phys. 79, L5 (1970)