Scaling Phenomena in the Growth Dynamics of Scientific Output
Abstract
We analyze a set of three databases at different levels of aggregation (i) a database of approximately publications of 247 countries in the period between 1980–2001. (ii) A database of 508 academic institutions from European Union (EU) and 408 institutes from USA in the 11 year period between during 1991–2001. (iii) A database comprising of 2330 Flemish authors in the period 1980–2000. At all levels of aggregation we find that the mean annual growth rates of publications is independent of the number of publications of the various units involved. We also find that the standard deviation of the distribution of annual growth rates decays with the number of publications as a power law with exponent . These findings are consistent with those of recent studies of systems such as the size of R&D funding budgets of countries, the research publication volumes of US universities, and the size of business firms.
pacs:
PACS numbers: 89.90.+n, 05.45.Tp, 05.40.FbI Introduction
One outcome of World War II and the role science and technology (S&T) played in that conflict was a heightened awareness on the part of policy makers of how developments in science and technology affect the security, economic development, and public good of a nation (Durlauf, 1996; Chandler, 1962; Gort, 1962). Since that time, science and technology studies focusing on the complex relationships influencing research, development, and innovation have produced many policy-relevant results. Vannevar Bush’s ground-breaking Report to the President on a Program for Postwar Scientific Research (based on the linear model presented in (National Science Board, 2000); Mansfield 1991; Jaffe 1996) dominated policy thinking in the period after World War II but, within the knowledge industry, emerging new concepts—such as the national innovation system—have highlighted the complex interactions between research, development, and innovation and have clarified their economic and social relevance (Durlauf, 1995).
It is now clear that R&D spending decisions e.g., how to partition funds among disciplines (e.g. weighted toward life sciences or natural sciences ) or how much to spend on individual projects (e.g.spending for the human genome project or global warming or renewable sources of energy) can dramatically impact the pattern of development, strongly influence which advances occur first and, if strategic decisions are haphazard, seriously jeopardize the competitiveness of the entire S&T system (Pakes, 1996). These concerns are even more pressing now than they were 50 years ago because
-
(i)
the scale of the S&T systems and the available resources are now much larger,
-
(ii)
scientific advances now take place much more rapidly,
-
(iii)
cutting-edge research today is often multidisciplinary (e.g., in the new field of bio-informatics, biologists, mathematicians, and physicists sometimes cooperate and sometimes compete), and
-
(iv)
research results and technological innovations have a stronger impact on economic growth and competitiveness.
To make informed choices, decision makers need information that is timely, reliable, and clear (Luwel, 1999). To answer these needs, the field of quantitative S&T studies has gone through a revolutionary period (CWTS, 2000) during which many new indicators have been identified (Garfield, 1979), but in spite of important advances, this is still an extremely complex project with many unsolved questions. Indicators are, by definition, retrospective and heuristic (National Science Board, 2000), and there are many difficulties associated with the development of indicators (Moed, 1995; Plerou, 1999) that are general, robust, and applicable (i) across different S&T fields, (ii) for different aggregation levels (from research groups to entire countries), (iii) equally well for input and output measures.
Most bibliometric indicators are one-dimensional i.e., they analyze only one variable such as R&D spending, number of publications, number of citations, or time evolution. Indicators based on these variables (e.g., OECD S&T-indicators, NSF Science and Engineering Indicators, EU Science and Technology Indicators) are well-known to policy-makers, but to better understand the underlying processes driving the R&D system and how they impact economic development, we need to better understand the relationships among these variables and thus far, little work has been done in this area. Appropriate research could produce more complex indicators that may enable us to more accurately predict the output and impact of policy changes. Indeed, OECD has already stated that such “blue sky” indicators are indispensable policy tools in a knowledge economy driven by research and technological innovation. The approach adopted in this paper is inspired by (Derek de Solla Price, 1963) who conceived science as a physical system. He aimed at simple laws, similar to those in planetary physics discovered by Newton. Rather than applying laws from classical physics, our goal is to develop more sophisticated R&D indicators by using concepts and tools recently developed in the field of statistical physics. Specifically, we will apply two of that field’s fundamental concepts: scaling and universality (Stanley, 1999).
I.1 Scaling and Universality
The utility of the “universality” concept can be explained through an analogy with the Mendeleev periodic table of atomic elements. During the last century, Mendeleev noticed that some elements shared similar physical and chemical properties. That observation prompted him to organize the atomic elements known at that time into a table in which atomic elements with similar properties occupy the same column. By organizing the elements into this table, Mendeleev found that some cells of this periodic table were left empty. Later, those empty cells were found to correspond to newly-discovered atomic elements whose chemical and physical properties were well-predicted by their position in the table.
Analogously, the study of critical phenomena in statistical physics has shown that the phase transition of very different systems—e.g., water at the critical point, a polymer at its collapsing temperature, or a magnet undergoing a temperature change—could be classified into a few classes, each class being described by the same scaling functions and the same scaling laws.
This result motivates a question of fundamental importance: “Which features of this microscopic inter-particle force are important for determining critical-point exponents and scaling functions, and which are unimportant?” This question has been answered for physical systems, but is still lacking an answer for other systems. The discovery of universality in physical systems is also of great practical interest. Specifically, when studying a given problem, one may pick the most tractable system to study and the results one obtains will hold for all other systems in the same universality class.
Here we extend a recent study by (Plerou 1999; Moed 1999;) and investigate to what extent the concept of scaling can (i) be used to study R&D systems by analyzing the publication output of academic research institutions and authors and (ii) lead to new and more sophisticated indicators. Contrary to technological innovation, scientific knowledge is a public good and researchers establish intellectual property for their results by publishing them. The processes leading to new scientific knowledge are complex and, to a large extent, driven by a government’s R&D-policy. This policy varies considerably over countries in areas such as the total public investment in R&D, the priority setting between scientific disciplines, the institutional organization (universities, public research institutes, etc.) and the way research itself is funded (more or less competitively driven).
I.2 Growth of Organizations
Consider the annual growth rate of an organization’s size
| (1) |
where and are the size of the organization being considered in the years and , respectively. The organization can be a business firm (Stanley, 1996; Amaral, 1997; Buldyrev, 1997; Takayasu, 1998; Sutton, 2000; Wyart, 2002), a country (Canning, 1998), a university research budget (Plerou, 1999), a voluntary social organization, or a bird species (Keitt, 1998; Keitt, 2002). We expect that the statistical properties of the growth rate depend on , since it is natural that the magnitude of the fluctuations will decrease with . We partition the growth rates into groups according to their sizes to test whether the probability density conditioned on the size has the same functional form for all the different size groups (Stanley, 1996; Amaral, 1997; Buldyrev, 1997).
If the conditional distribution of growth rates has a functional form dependent on S, we expect the standard deviation —which is a measure of the width of —to be dependent on S. Thus, if when we plot the scaled quantities
| (2) |
all curves from the different size groups collapse onto a single curve, then follows a universal scaling (Amaral, 1997, Buldyrev, 1997)
| (3) |
where is a symmetric function independent of of a specific “tent-shaped” form. Models (Amaral, 1998; Matia, 2004) discusses how the tent-shaped form of can be interpreted by a convolution of a log normal distributions and a Gaussian distribution. Interestingly, our studies reveal that decays as a power law Stanley (1996), Buldyrev (1997)
| (4) |
where is known as the scaling exponent.
II Data For Different Levels of Aggregation
II.1 Data of Publication of Countries
We analyze a database consisting of the total annual publications of 247 countries between 1980–2001. We extract the data from the CD-ROM version of the Science Citation Index (SCI) published by the Institute for Scientific Information (ISI) at Philadelphia, USA, founded by Eugene Garfield.
We count country publications in three distinct ways, which we illustrate with an example: Consider one publication co-authored by researchers affiliated with four different institutions in three different countries. Two of the study’s authors are affiliated with a particular US institution, a third author to a second US institution, a fourth with a Dutch institution and the last author with a Belgian institution. For this case, one can define at least four different assignments of the publication to the three countries involved.
In an ideal case, one would assign fractions of a paper to a country on the basis of the proportion of authors from each country. Thus, in the example, 0.6 publications would be assigned to the US, 0.2 to the Netherlands and 0.2 to Belgium. However, in the database analyzed, authors are not tagged to institutions. Therefore, for multi-authored papers from different institutions, the distribution of authors among institutions or countries cannot be determined. In our study, publications were assigned to countries on the basis of the geographic location of the authors’ institutions rather than that of the authors themselves. Thus, three counting schemes can be applied. The first is denoted as “fractional count.” Since two institutions are located in the US, one in the Netherlands and one in Belgium, 1/2 of the paper is assigned to US, and 1/4 to each of the other two countries. This count will be denoted as fractional count throughout this paper. A second, denoted as “integer count, type I” assigns two publications to the US, one publication to the Netherlands and one publication to Belgium. Finally, the third, denoted as “integer count type II” assigns one publication each to the US, the Netherlands, and Belgium.
The fractional count definition has the advantage that it conserves the total number of publications regardless of the number of authors. Our fractional count is not a perfect solution to the assignment of publications to countries as it is based on contributing institutions rather then on individual contributors, but it is the best we are able to generate with the data available. Moreover, at the level of countries, differences between a fractional assignment based on institutions and that based on authors can be expected to level out to a considerable extent. The two integer count definitions are important because they provide a way to determine the weight of national and international collaborations on the research of a country. In fact, type II integer counts reflect international collaboration, and type I integer counts reflect institutional collaboration both at the national and the international level.
By considering the three distinct counting methods for publications, we generate three databases for analysis. From each of these databases we select the subset of countries which had non-zero publications during the entire 22-year period. This procedure eliminates 123 countries—some of which were created during the observations period (due mainly to changes in Eastern Europe and the disintegration of the USSR) and some with very low publication rates—yielding 124 countries.
II.2 Data of Publication of Institutes
We analyze a database consisting of the total annual publications of 508 institutes from European Union (EU) and 408 academic institutions from USA in the 11 year period between during 1991–2001. Publication by institutes is recorded according to the fractional counting scheme described before. Publications were assigned to institutions on the basis of the institutional affiliations of publishing authors, taking into account variations in the institutions’ name.
II.3 Data of Publication of Flemish Authors
We analyze a database consisting of the total annual publications of 2330 authors between 1980–2001. The database contains articles, letters, notes and reviews in CDROM version of SCI 1980-2000 Flemish researchers active in natural and life sciences who during 1991-2000 were member of a Committee or who submitted a proposal to the Flemish Research Council FWO-Vlaanderen.
Publication by Flemish authors is recorded in two distinct ways, which we illustrate with an example: Consider one publication co-authored by two different researchers. Two different counting schemes can be applied. The first is denoted as “fractional count” where each author receives a score of . A second, denoted as “integer count” assigns to each author each author a score of .
III Analysis
III.1 Countries
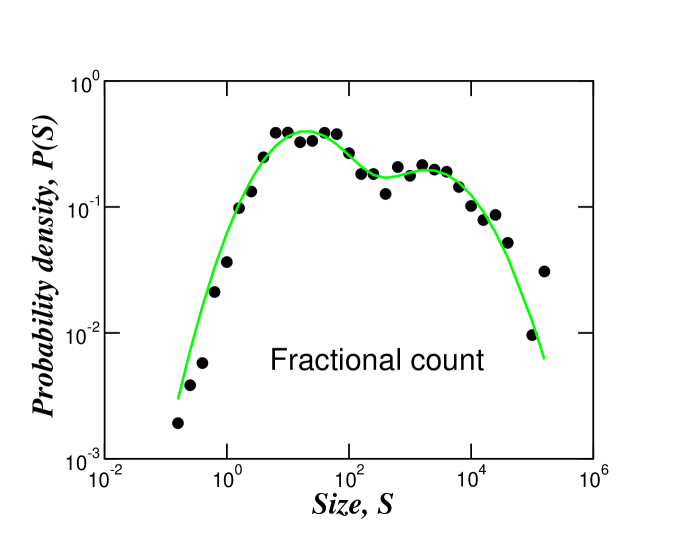
Figures 1 and 2 present results for the size distribution of the countries according to the fractional counting schemes. Figure 1 displays the histogram of the logarithm of the number of publications of 124 countries for the 22 year period between 1980–2001. We observe that the distribution exhibits a bi-modal size distribution which implies that the set of 124 countries can be divided into two classes. In the class with larger sizes we find countries from the European Union, the North American subcontinent, the Organization for Economic Co-operation and Development (OECD), and populous countries such as India, China, and South Africa. In the class with smaller sizes we find developing countries of the African and South American continents and countries from the Middle East. The bi-modal distribution suggests the existence of two different classes of countries which have an economic and scientific collaboration among themselves. Note that this result is different from that found for the GDP of growth of countries (Canning, 1998). In terms of GDP different countries exhibit a uni-modal distribution, but we see that in terms of scientific outputs, perhaps because of a more aggressive science policy, countries exhibit a bi-modal distribution. Analysis applying the two integer counting schemes generated patterns that are similar to that obtained with the fractional counting schemes. This feature is also indicative of the scientific collaboration among different countries in the two classes observed. One expects that in the case where every country scientifically collaborates uniformly with every other country there would not be any segregation into different classes. The multiplicative growth process in scientific publications is present in each of these two classes, giving rise to a log-normal distribution, which is a prediction of Gibrat’s theory (Gibrat, 1931) which states that growth rates of firms are independent and uncorrelated to the firm size and hence the probability distribution of the firm sizes is log-normal.
We define the deflated size of the publications of a country as
| (5) |
where and is the number of publications of a country in year . The annual growth rate of a country’s publication is defined as
| (6) |
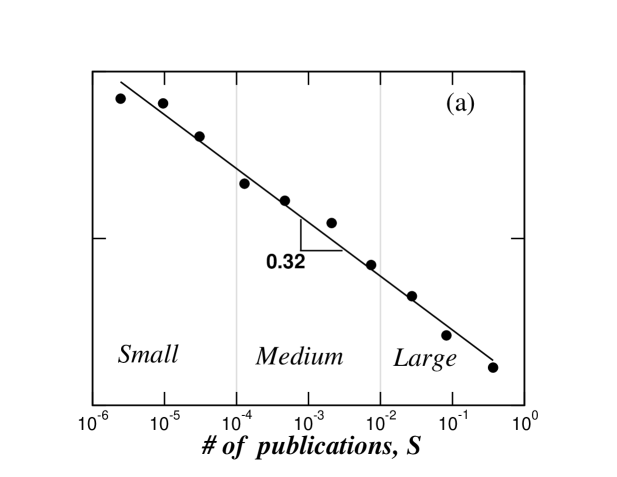
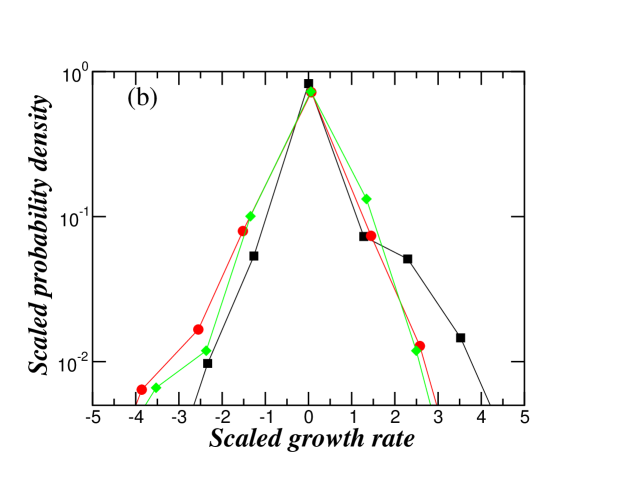
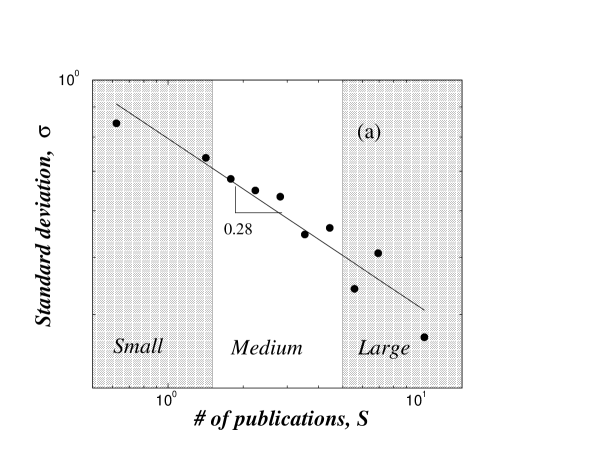
with year. We expect that the statistical properties of the growth rate depend on , since it is natural that the magnitude of the fluctuations will decrease with . We next calculate the standard deviation of the distribution of growth rates as a function of . Figure 2(a) demonstrates that decays as a power law
| (7) |
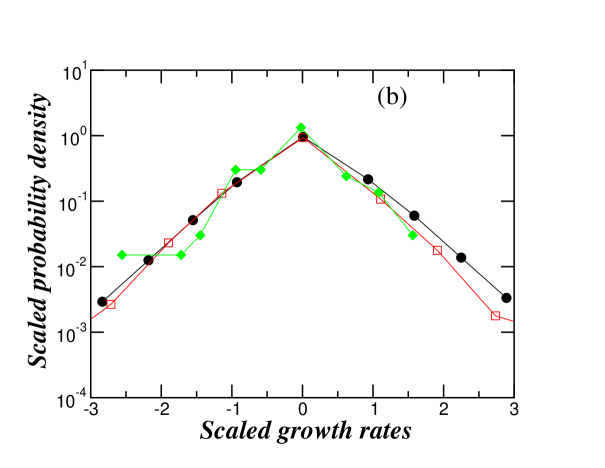
with . To test if the conditional distribution of growth rates has a functional form independent of the size of the country, we plot the scaled quantities
| (8) |
for 3 different groups partitioned with respect to their size of publication : small (), medium (), and large (). Figure 2(b) shows that the scaled conditional probability distributions collapse onto a single curve (Stanley, 1999), suggesting that follows a universal scaling eq. 8.
FIGURE 1 AND 2 ABOUT HERE
III.2 Academic Institutions
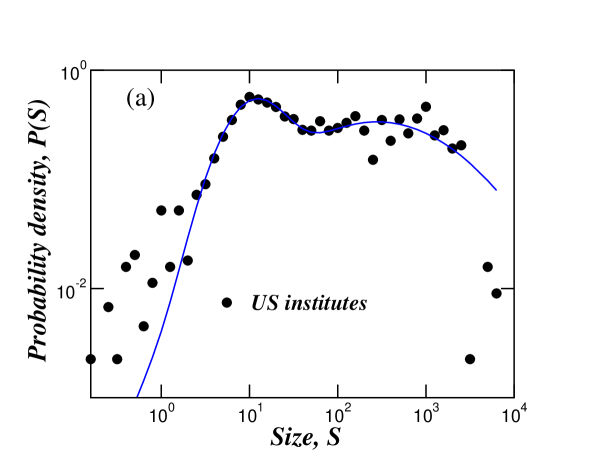
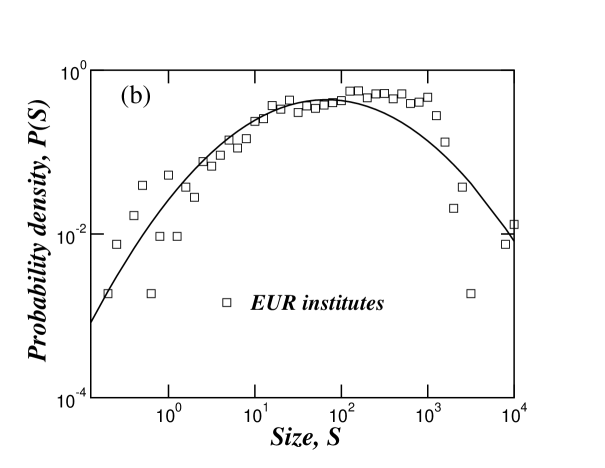
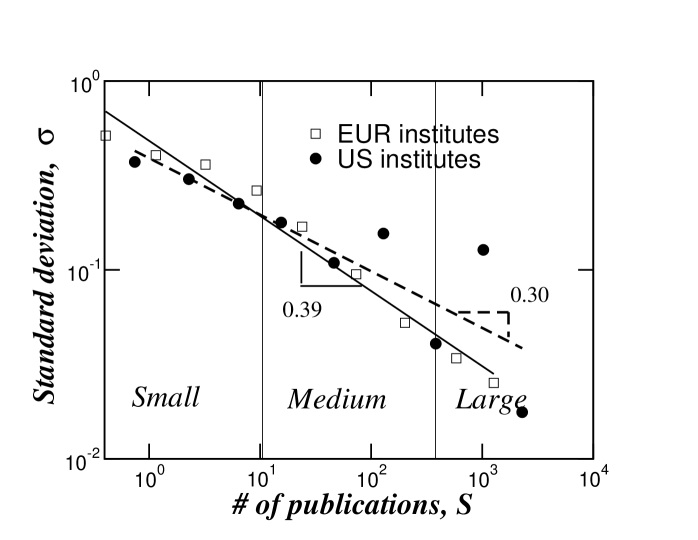
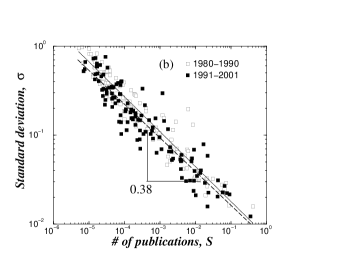
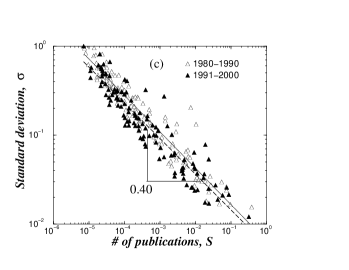
We now present results for the size distribution of the institutional publication according to the different regions. Figure 3a displays the histogram of the logarithm of the number of publications of 408 USA institutes for the 11 year period between 1991–2000. We observe that the distribution, for EU institutions unlike the US institutions, exhibits a uni-modal size distribution which was unlike that observed for publication of countries. Note that this result is similar to that found for the GDP of growth of countries (Canning, 1998). A possible conjecture of observing uni-modal distribution as opposed to a bi-modal distribution of size is a more homogeneous collaboration among institutes. The multiplicative growth process in scientific publications gives rise to a log-normal distribution, which is a prediction of Gibrat’s theory. The distribution for US academic institutions exhibit a bi-modal rather than a uni-modal pattern. The values of the scaling parameter , however, are statistically similar in the two academic systems [c. f. Table 1].
FIGURE 3 AND 4 ABOUT HERE
III.3 Authors
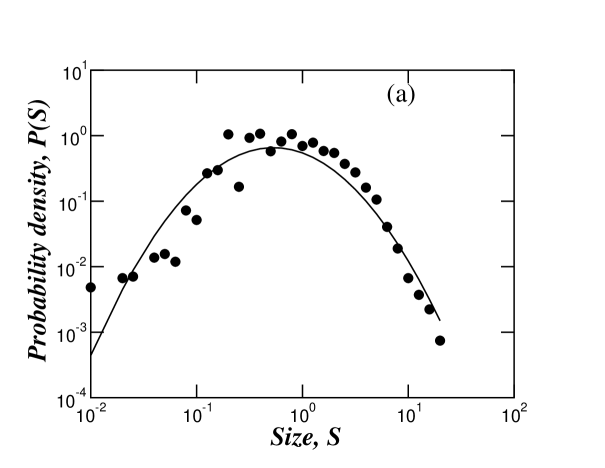
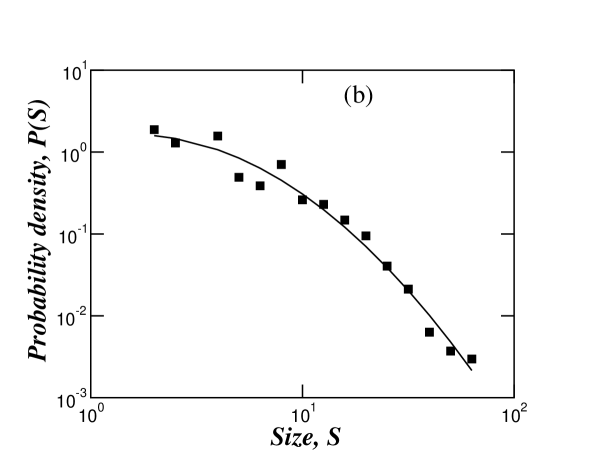
Next we present results for the size distribution of the Flemish publication according to the different counting schemes. Figure 5 displays the histogram of the logarithm of the number of publications of 2330 countries for the 21 year period between 1980–2000. We observe that the distribution, for two different counting schemes, exhibits a uni-modal size distribution which was unlike that observed for publication of countries. Note that this result is similar to that found for the GDP of growth of countries (Canning, 1998). In terms of GDP different countries exhibit a uni-modal distribution, and we see that in terms of scientific outputs at the level of authors this feature is similar. This feature is also indicative of the scientific collaboration among different authors in a uniform way. One expects that in the case where every author scientifically collaborates uniformly with every other author there would not be any segregation into different classes. The multiplicative growth process in scientific publications gives rise to a log-normal distribution, which is a prediction of Gibrat’s theory. Table 1 summarizes the estimates of scaling exponent [c.f. eq. 4] for different levels of aggregation. We observe that for different level of aggregation or for different counting schemes we get statistically similar values.
TABLE 1 ABOUT HERE
FIGURE 5 AND 6 ABOUT HERE
IV Deviation from Scaling Laws for Countries
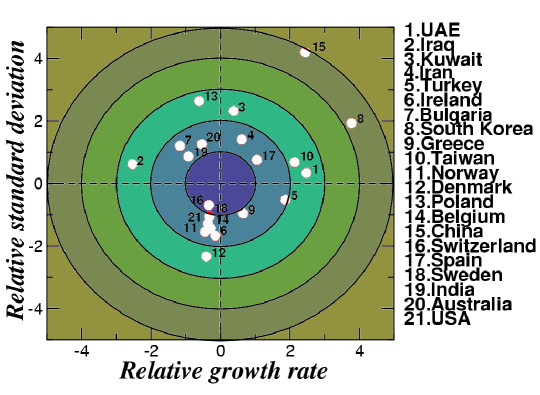
Next we look at the joint distribution of the relative growth rate and the relative deviation of from the scaling laws found in the previous section. First we define the mean growth rate of a country as , where is the growth of country in year . Next we evaluate the relative growth rate of country as , where is the standard deviation of {} of country . We then evaluate the deviation of the countries from the scaling law
| (9) |
where is a constant. We define , where is the size of country and then evaluate , where is the standard deviation of {}, evaluated over 124 countries. The scatter plot of would fall inside a circular region of 1 standard deviation for countries following the scaling laws closely. Countries for which () falls outside the 2 standard deviation zone can be hypothesized to pursue a different science and technology policy than that pursued by the rest of the world with 95% probability.
Figures 7 displays the relative growth rate plotted against the deviation of from the best fit line i.e., . Circular lines in the plots mark the different zones of standard deviation in and . Countries falling outside the one standard deviation zone have deviate significantly from the mean properties of world scientific outputs. Countries falling in the first quadrant outside the one standard deviation zone in this plot have positive growth, but the standard deviation in the growth rate implies that the fluctuation in the growth is high. Countries falling in the second quadrant have high positive growth and also less standard deviation in growth, indicating a more stable growth process. Countries falling outside the one standard deviation zone in this quadrant are quickly developing countries. Scientific research from these countries may produce newer fields resulting in high positive growth and bigger fluctuations. Countries outside the one standard deviation zone in the third quadrant are countries with strongly decaying science policies. Both the standard deviation of growth and the growth is negative, suggesting a very strong decay. Countries in the fourth quadrant outside the one standard deviation zone have higher standard deviation in growth, but the growth itself is negative. The countries in this quadrant have a chance to move over to the first or second quadrant because of higher fluctuations. These are the newly developed countries which may be recently investing in scientific research.
FIGURE 7 ABOUT HERE
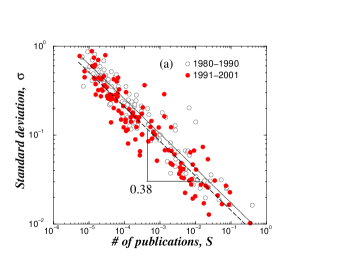
Figures 8 display the standard deviation of the growth rates of all 124 countries plotted as a function of , in two periods between 1981-1990 and 1991-2000 for (a) fractional, (b) integer type I, (c) integer type II counting schemes. Comparison of scaling laws in these two consecutive decades may be indicative of any policy or political regime changes that countries possibly have undergone. We observe that the countries have identical scaling laws in the two consecutive decade.
Next we study the deviation of from the best fit line in for the two 11 year periods between (a) 1980-1990 and (b) 1991-2000 (c.f. Fig. 7, which is the entire 22 year period). We observe that China and South Korea had a very high deviation of growth rate from the average growth rate of world publication during the period 1980-1990. During the second half of the analysis period we observe both countries as deviating less from the average world publication grow rate. We also observe the growth rate of USA as becoming more stable and moving inside the 1 standard deviation zone in the 2nd half of the analysis period. Dramatic policy changes are also observed for countries such as Iran which shift from the negative 2 standard deviation zone to the positive 2 standard deviation zone during these two decades. Developing countries such as India become more stable in terms of their science policy and move inside the 1 standard deviation zone and countries such as Japan become more deviant and more within to the 1 standard deviation zone.
FIGURE 8 ABOUT HERE
V Discussion
We have described a research approach that may be quite new in the field of scientific policy and that may shed light on the behavior and characteristics of S&T systems. Understanding these processes and the data characterizing them is of great relevance not only for S&T studies but also for science policy. Indeed, countries are increasingly stressing performance because research funding is becoming more and more an instrument for safeguarding long term economic competitiveness. Scientific research can be modeled as an input-output process, according to which inputs such as the stocks of scientific knowledge and existing techniques, skilled personnel, scientific instruments, recruited personnel, and financial resources, are transformed by conceptual, experimental, and technical work of scientists into outputs, particularly scientific contributions, to a discipline in the form of new scientific knowledge, techniques, and trained scientists.
Our study deals with scientific performance or scientific excellence. National governments, particularly in OECD countries, make large investments in basic scientific research. During the past decades, the need for accountability in scientific research and research student training has increased strongly. As indicated earlier and observed empirically, this type of aggressive science policy by a group of countries may be a cause of the bi-modal distribution of sizes.
Our studies on the EU and the institutions reveal another special characteristic observed within the EU but not in US institutions. The uni-modal size distribution is indicative of a homogeneous collaboration among institutes of all size. A bi-modal distribution which is observed in US institutions is indicative of a clustering effect of institutes of two different size classes. Whether or not we observe this clustering effect in collaboration among institutes in EU and USA the scaling parameter of growth remains statistically similar to that observed for countries. It is indeed remarkable that for all levels of aggregation i.e., from countries to research institutes to authors, the scaling parameter of growth as a function of size remains statistically comparable. These important results observed in the scientific output of countries and research institutes were not observed in the GDP of countries or other S&T input output indicators like citation.
In our macroscopic analysis in which we study the statistical properties of the growth rates in the annual number of articles published by a country, a certain statistical regularity was found between a country’s standard deviation and its total volume of published articles. The standard deviation as a function of the total number of articles published decays as a power law. The exponent in the power law equation is denoted in statistical physics as the scaling exponent. A closer inspection of the results reveals that for some countries, the standard deviations in their annual growth rates deviate substantially from the expected scores given by the total number of papers they published. The significance of such a deviation and what it can teach us about the efficiency of the various national research systems will be addressed in the next phase of our research.
We thank X. Gabaix, S. Havlin, M. Salinger, for helpful discussions and suggestions, and NSF for financial support.
| Level of | Counting Schemes | |
| Aggregation | ||
| Countries | ||
| Fractional Count | 0.32 0.05 | |
| Integer Count I | 0.32 0.05 | |
| Integer Count I | 0.34 0.05 | |
| Institutes | ||
| EU | Fractional Count | 0.39 0.05 |
| USA | Fractional Count | 0.30 0.05 |
| EU + USA Combined | Fractional Count | 0.35 0.05 |
| Flemish Authors | ||
| Fractional Count | 0.28 0.05 | |
| Integer Count | 0.22 0.05 |
References
- (1) Amaral, L. A. N., Buldyrev, S. V., Havlin, S., Leschhorn, H., Maass, P., Salinger, M. A., Stanley, H. E. and Stanley, M. H. R. (1997).“Scaling Behavior in Economics: I. Empirical Results for Company Growth,.’ J. Phys. I France, 7, 621–633.
- (2) Amaral, L. A. N., Gopikrishnan, P., Matia, K., Plerou, V., and Stanley,H. E. (2001). “Application of Statistical Physics Methods and Concepts to the Study of Science and Technology Systems”. Leiden: Proc. 2000 International Conference on Science and Technology Indicators Sociometrics 51, 9–36.
- (3) Buldyrev, S. V., Amaral, L. A. N., Havlin, S., Leschhorn, H., Maass, P., Salinger, M. A., Stanley, H. E. and Stanley, M. H. R. (1997) “Scaling Behavior in Economics: II. Modeling of Company Growth.” J. Phys. I France, 7, 635–650.
- (4) Canning, D., Amaral, L. A. N., Lee, Y., Meyer,M., and Stanley,H. E. (1998) “A Power Law for Scaling the Volatility of GDP Growth Rates with Country Size,” Econ. Lett., 60, 335–341.
- (5) Chandler, A. (1962). Strategy and Structure. Cambridge: MIT Press.
- (6) CWTS. (2000). Program of Sixth International Conference on Science and Technology Indicators (S&T 2000). Leiden.
- (7) Durlauf, S. N. (1996). “On the Convergence and Divergence of Growth Rates.” The Economic Journal, 106, 1016–1018.
- (8) Durlauf, S. N., and Johnson, P. (1995) “Multiple regimes and cross-country growth behavior.” J. Applied Economics, 10, 365–384.
- (9) Garfield, E. (1979).Citation Indexing: Its Theory and Applications in Science, Technology and Humanities. NY: Wiley.
- (10) Gibrat, R. (1931). Les Inégalités Economiques, Paris: Sirey.
- (11) Gort, M. (1962). Diversification and Integration in American Industry. Princeton: Princeton University Press.
- (12) Jaffe, A. B., and Trajtenberg, M. (1996). “Flows of knowledge from universities and federal laboratories: Modeling the flow of patent citations over time and across institutional and geographic boundaries.” Proc. Nat. Ac. Sci. USA, 93, 12671–12677.
- (13) Keitt, T., and Stanley, H. E. (1998). “Scaling in the Dynamics of North American Breeding-Bird Populations.” Nature, 393, 257.
- (14) Keitt, T. H., Amaral,L. A. N., Buldyrev,S. V., and Stanley,H. E. (2002). “Scaling in the Growth of Geographically Subdivided Populations: Scale-Invariant Patterns from a Continent-Wide Biological Survey” [Focus issue: The biosphere as a complex adaptive system] Phil. Trans. Royal Soc. B: Biological Sciences, 357, 627–633.
- (15) Lee, Y.,Amaral, L. A. N., Canning,D., Meyer,M., and Stanley,H. E. (1998). “Universal features in the growth dynamics of complex organizations.” Phys. Rev. Letters, 81, 3275-3278.
- (16) Luwel, M., Noyons, E. C. M., and Moed, H. F. (1999). “Bibliometric Assessment of Research Performance in Flanders: Policy Background and Implications,” R&D Management, 29, 133–141.
- (17) Mansfield, E. (1991). “Academic research and industrial-innovation”. Research Policy, 20, 1–12.
- (18) Matia, K., Fu, D., Buldyrev, S. V., Pammolli, F., Riccaboni, M., Stanley, H. E. (2004). “Statistical properties of business firms structure and growth”.Euro. Phys. Lett. preprint.
- (19) Moed, H. F., De Bruin, R. E., and Van Leeuwen,Th. N. (1995). “New Bibliometric Tools for the Assessment of National Research Performance: Database Description, Overview of Indicators and First Applications,” Scientometrics, 33, 381–422.
- (20) Moed, H. F. and Luwel, M. (1999). “Science Policy: the Business of Research,” Nature, 400, 411–412.
- (21) National Science Board. (2000) Science & Engineering Indicators – 2000. Arlington.
- (22) Pakes, A. and Sokoloff,K. L. (1996) “Science, technology, and economic growth.” Proc. Nat. Ac. Sci. USA, 93, 12655–12657.
- (23) Plerou, V., Amaral, L. A. N., Gopikrishnan, P. Meyer, M., and Stanley, H. E. (1999). “Similarities between the Growth Dynamics of University Research and of Competitive Economic Activities,” Nature, 400, 433–437.
- (24) Price, Derek de Solla. (1963) Little Science, big Science. NY: Columbia University press.
- (25) Stanley, M. H. R., Amaral, L. A. N., Buldyrev, S. V., Havlin, S., Leschhorn, H., Maass, P., Salinger, M. A., and Stanley, H. E. (1996). “Scaling Behavior in the Growth of Companies.” Nature, 379, 804–806.
- (26) Stanley, H. E. (1999) “Scaling, Universality, and Renormalization: Three Pillars of Modern Critical Phenomena,” Rev. Mod. Phys.[Special Issue for the Centennial of the American Physical Society], 71, S358–S366.
- (27) Sutton, J. (2002). “The Variance of Firm Growth Rates: The ‘Scaling’ Puzzle,” Physica, 312, 577-587.
- (28) Takayasu, H., and kuyama, K. (1998). “Country Dependence on Company Size Distributions and a Numerical Model Based on Competition and Cooperation,” Fractals, 6, 67–79.
- (29) Wyart, M., and Bouchaud, J.-P. (2002). “Statistical Models for Company Growth,” cond-mat/0210479.