Multifractal Analysis of Human Retinal Vessels
Abstract
In this work it is shown that vascular structures of the human retina represent geometrical multifractals, characterized by a hierarchy of exponents rather then a single fractal dimension. A number of retinal images from the STARE database (www.parl.clemson.edu/stare) are analyzed, corresponding to both normal and pathological states of the retina. In all studied cases a clearly multifractal behavior is observed, where capacity dimension is always found to be smaller then the information dimension, which is in turn always smaller then the correlation dimension, all the three being significantly lower then the DLA (Diffusion Limited Aggregation) fractal dimension. We also observe a tendency of images corresponding to the pathological states of the retina to have lower generalized dimensions and a shifted spectrum range, in comparison with the normal cases.
pacs:
05.40.-a, 61.43.Hv, 87.57.-s, 87.57.NkOver the past decade, there have been several attempts family ; mainster ; landini ; avakian ; lakshi ; masters in the direction of employing the fractal dimension as a measure for quantifying the “state” of human retinal vessel structures (considered as geometrical objects), with the expectation that such analysis may contribute to automatic detection of pathological cases, and therefore to computerization of the diagnostic process. While this is certainly a valid question with possibly high impact on real world diagnostic issues, there are some issues that should be addressed before such investigations may prove useful for the standard clinical practice. First, the fact that retinal vessels represent “finite size” realizations of a fractal growth process, imposes questions about how exactly should one go about measuring the fractal dimension of a particular instance (e.g. an electronic image of a retinal vessel structure, taken from a given angle, with a given resolution and lightning conditions). A related question is to what extent these calculations may correspond to the limiting fractal (which would have been attained if the growth process could have been extended to infinity), or equivalently, to what degree they may be compared with calculations on other such finite instances. Although various issues related to these questions have already been addressed (for a current review see e.g. masters ), it seems that many of them remain open for further investigation. Second, some of these works avakian ; landini address the point that the retinal vessels may have different properties in different regions, and do indeed find different characteristics depending on the locale of measurement, although the procedures adopted in these works are only remotely related to established concepts of multifractality, and the corresponding commonly accepted procedures for its measurement (see e.g. feder ; vicsek ; vicsek2 ; vicsek3 ; chabra ; chabra2 and references therein).
In this work we concentrate on the latter of the above issues, that is, we show that the human retinal vessel structures are geometrical multifractals, characterized by a hierarchy of exponents rather then a single fractal dimension. We analyze a number of retinal images from the STARE database stare , corresponding to both normal and pathological states of the retina. In all cases we find clearly multifractal behavior. The capacity (or box counting) dimension is always found to be smaller then the information (or Shannon) dimension, which is in turn always smaller then the correlation dimension. In all cases the observed values of the capacity dimension were significantly lower then the DLA (Diffusion Limited Aggregation) fractal dimension, which has been considered in earlier works family ; mainster ; masters as the primary model relevant for the phenomenon at hand. It is also found that images corresponding to pathological cases tend to have lower generalized dimensions, as well as a shifted spectrum range, in comparison with the normal cases.
In contrast to regular fractals (or monofractals), multifractals are characterized by a hierarchy of exponents, rather then a single fractal dimension. A well known example of multifractality is the growth probability distribution during the DLA growth process, which has been shown to exhibit multifractal scaling amitrano ; hayakawa ; nittmann ; ohta . Geometrical (or mass) multifractals represent a special case when the measure of interest is homogeneously distributed over the observed structure, so that only the number of particles (Lebesgue measure) contributes to the measure within a given region of the fractal vicsek ; vicsek2 . Considering a structure with mass (number of pixels) and linear size , covered with a grid of boxes of linear size , the generalized dimension for the mass distribution is defined by
| (1) |
where is the mass (number of pixels) within the -th box, and is a continuous (adjustable) variable that makes it possible to single out fractal properties of the object at different scales (equivalent of inverse temperature in thermodynamics). The generalized dimensions , and correspond to the capacity (or box-counting) dimension, information (or Shannon) dimension, and correlation dimension, respectively. Finally, and represent the limits of the generalized dimension spectrum (for monofractals, all the generalized dimensions coincide, being equal to the unique fractal dimension).
It turns out that the direct application of (1) in practice is hindered by the fact that for the boxes that contain a small number of particles (because they barely overlap with the cluster) give anomalously large contribution to the sum on the left hand side of (1). To alleviate this problem and perform the multifractal analysis of the retinal vessel structures, we adopt the generalized sand box method vicsek2 ; vicsek3 , which has been successfully used do demonstrate geometric multifractality of DLA vicsek2 . This procedure consists in randomly selecting points belonging to the structure, and counting for each such point the number of pixels that belong to the structure, inside boxes of growing linear dimension , centered at the selected pixels. The left hand side of equation (1) can now be interpreted as the average of the quantity according to probability distribution . When the box centers are chosen randomly, the averaging should be made over the chosen set, and the equivalent of (1) becomes
| (2) |
The practical advantage of this method is that the boxes are centered on the structure, so that by construction there are no boxes with too few particles (pixels) inside.
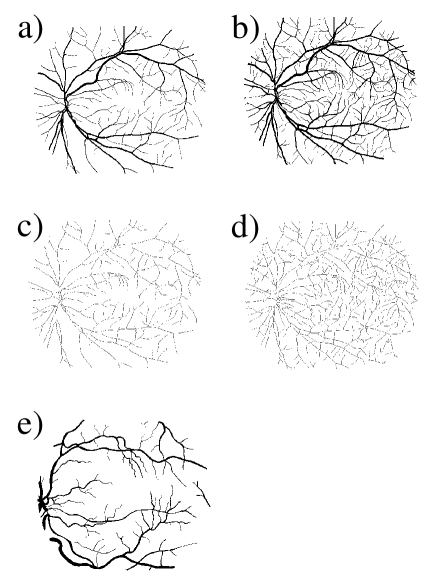
To verify whether human retinal vessel structures demonstrate geometrical multifractal scaling properties, we have used a set of forty retinal images from the STARE database stare , manually segmented by two different observers (herefrom referred to by initials AH and VK as in stare ) from twenty original retinal scans (containing ten normal and ten pathological cases), for the purpose of studies on automatic image segmentation and diagnostics stare2 . The images segmented by observers AH and VK differ in level of detail, and the resulting set, totaling forty segmented images, is available for download from the STARE project stare in ppm file format, with resolution of 700x605 pixels. As recently it has been argued parsons that fractal analysis may be more sensitive to changes in vascular patterns when skeletal images of vascular trees are considered, rather then the original segmented images (which contain the vessel width information), in order to verify whether the vessel width information indeed does exert influence on the multifractal analysis, we have also performed skeletonization of the two downloaded sets using the eight connected Rosenfeld algorithm rosenfeld , to produce two additional sets of twenty images each. A typical normal and a pathological image, segmented by observers AH and VK (where images segmented by observer VK demonstrate a substantially higher level of detail), respectively, together with their skeletonized versions using the Rosenfeld algorithm, are shown in Fig. 1.
For all of the four sets (containing twenty images each), we have performed measurements (calculations) according to (2), selecting 1000 random points on each structure (typical structure size is approximately 30000 pixels, and the typical linear size is 600 pixels), and counting number of pixels inside boxes centered at selected points. These numbers were then used to extract generalized dimension , for different values of q (), as slopes of the lines obtained through regression (minimum squares fitting) of , as a function of . The whole procedure was repeated 100 times (with different random choices of the 1000 random points), for each image, and for each value of . The final values of were calculated as averages over these repetitions.
A word is due on calculations for the special case , corresponding to information dimension . As the above formulas are non-analytic for , we perform calculations at , for , and assuming linearity of the function in this (short) interval, we interpolate (in fact, the difference between the values of calculated on both sides of was found to be only slightly larger then the statistical fluctuations induced by random choice of the set of measurement points on the structure).
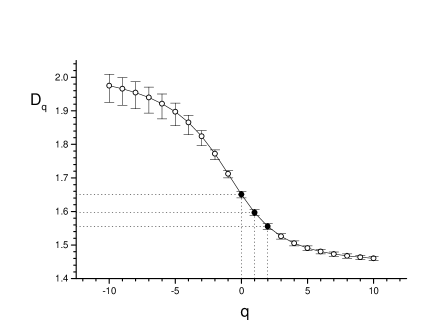
Results of a typical calculation are shown in Fig. 2, where it is seen that the observed retinal vessel structure clearly demonstrates multifractal scaling, rather then being a simple monofractal (there is a significant difference between generalized dimensions). In particular, the capacity dimension , the information dimension and the correlation dimension are all different, satisfying . Also, all the three values remain substantially lower then the DLA fractal dimension estimate, commonly accepted in the literature, of (which is in fact underestimated by commonly used methods) vicsek2 , in contrast with previous findings family ; mainster ; masters .
Numerical corresonding to Fig. 2 (for the set of twenty images from the STARE database segmented by observer AH) are given in Tab. 1. The first column lists the image names, while the second column indicates image classification status as “Pathological” or “Normal” stare3 . The values of generalized dimensions are given for , where as already mentioned , and correspond to the capacity, information and correlation dimension, respectively, while and indicate the range of the general dimension spectrum.
| Image | Status | |||||
|---|---|---|---|---|---|---|
| im0001.ah | P | 1.968 | 1.540 | 1.494 | 1.462 | 1.361 |
| im0002.ah | P | 1.930 | 1.548 | 1.498 | 1.460 | 1.370 |
| im0003.ah | P | 1.877 | 1.509 | 1.469 | 1.443 | 1.380 |
| im0004.ah | P | 1.777 | 1.522 | 1.492 | 1.465 | 1.367 |
| im0005.ah | P | 1.900 | 1.589 | 1.560 | 1.538 | 1.474 |
| im0044.ah | P | 1.886 | 1.541 | 1.493 | 1.459 | 1.363 |
| im0077.ah | N | 1.911 | 1.576 | 1.528 | 1.496 | 1.426 |
| im0081.ah | N | 1.917 | 1.555 | 1.514 | 1.487 | 1.421 |
| im0082.ah | N | 1.981 | 1.578 | 1.518 | 1.476 | 1.404 |
| im0139.ah | P | 1.904 | 1.565 | 1.516 | 1.481 | 1.413 |
| im0162.ah | N | 1.968 | 1.647 | 1.594 | 1.552 | 1.459 |
| im0163.ah | N | 1.998 | 1.642 | 1.587 | 1.550 | 1.476 |
| im0235.ah | N | 1.945 | 1.597 | 1.548 | 1.514 | 1.442 |
| im0236.ah | N | 1.868 | 1.584 | 1.544 | 1.514 | 1.448 |
| im0239.ah | N | 1.945 | 1.587 | 1.549 | 1.520 | 1.437 |
| im0240.ah | N | 1.918 | 1.593 | 1.564 | 1.543 | 1.494 |
| im0255.ah | N | 1.944 | 1.633 | 1.604 | 1.583 | 1.521 |
| im0291.ah | P | 1.819 | 1.516 | 1.482 | 1.454 | 1.348 |
| im0319.ah | P | 1.703 | 1.443 | 1.409 | 1.382 | 1.299 |
| im0324.ah | P | 1.923 | 1.567 | 1.520 | 1.486 | 1.399 |
It is seen from Tab. 1 that all of the values calculated for the capacity dimension (which corresponds to box counting method), and indeed the correlation dimension (corresponding to methods such as radius of gyration or the density-density correlation function), are significantly lower then the DLA fractal dimension vicsek2 . Therefore, our results show that retinal vessel structures are geometrical multifractals, and that the overall fractal dimension is lower then that of the DLA.
Results of the multifractal analysis for the other three sets of images (STARE database images segmented by observer VK, and the skeletonized versions of AH and VK) all yield qualitatively similar results, all of them clearly demonstrating multifractal behavior. In Table 2 we present the results for the capacity (box counting) dimension , for all of the four sets of images. It follows from Table 2 that the process of skeletonization (removal of vessel width information from the image) slightly reduces the fractal dimension, while this effect is much weaker in comparison with the effect of the level of detail present in the segmentation process, as found between the two current observers. However, when the results are compared consistently within each group separately, the mean fractal dimension is found to be lower for the pathological images then for the normal cases, for all of the four groups. Although this finding can hardly be considered conclusive from the statistical viewpoint, it is nevertheless encouraging from the point of view that fractal spectrum analysis could be employed for quantification of the retinal vessel state, in order to contribute to automatic diagnostics. To this end, far more detailed studies of images corresponding to specific deseases and normal cases, are needed. Assuming that each of the observers consistently applied his own criteria in segmentation, it follows that the fractal dimension results may be compared only between images segmented by the same observer, either skeletonized or not, but should be normalized before making comparisons of results from different groups.
| Image | Status | AH | AH-S | VK | VK-S |
|---|---|---|---|---|---|
| im0001 | P | 1.540 | 1.545 | 1.583 | 1.593 |
| im0002 | P | 1.548 | 1.524 | 1.574 | 1.568 |
| im0003 | P | 1.509 | 1.500 | 1.593 | 1.608 |
| im0004 | P | 1.522 | 1.508 | 1.573 | 1.598 |
| im0005 | P | 1.589 | 1.554 | 1.680 | 1.663 |
| im0044 | P | 1.541 | 1.538 | 1.668 | 1.661 |
| im0077 | N | 1.576 | 1.591 | 1.658 | 1.662 |
| im0081 | N | 1.555 | 1.551 | 1.668 | 1.671 |
| im0082 | N | 1.578 | 1.585 | 1.665 | 1.680 |
| im0139 | P | 1.565 | 1.564 | 1.679 | 1.678 |
| im0162 | N | 1.647 | 1.638 | 1.714 | 1.700 |
| im0163 | N | 1.642 | 1.612 | 1.684 | 1.646 |
| im0235 | N | 1.597 | 1.588 | 1.685 | 1.675 |
| im0236 | N | 1.584 | 1.581 | 1.658 | 1.662 |
| im0239 | N | 1.587 | 1.597 | 1.655 | 1.655 |
| im0240 | N | 1.593 | 1.563 | 1.677 | 1.663 |
| im0255 | N | 1.633 | 1.634 | 1.696 | 1.693 |
| im0291 | P | 1.516 | 1.491 | 1.604 | 1.578 |
| im0319 | P | 1.443 | 1.446 | 1.555 | 1.561 |
| im0324 | P | 1.567 | 1.503 | 1.642 | 1.617 |
| Average | P | 1.534 | 1.517 | 1.615 | 1.612 |
| N | 1.599 | 1.594 | 1.676 | 1.671 | |
| All | 1.567 | 1.556 | 1.646 | 1.642 |
When addressing multifractality, numerous works deal with the so-called spectrum (see e.g. halsey ; feder ; vicsek and references therein), where
| (3) |
represents the number of boxes where the probability of finding a particle (pixel) within a given region scales as
| (4) |
and may be understood as the fractal dimension of the union of regions with singularity strenghts between and . The exponent takes values from the interval , and the function is usually a single humped function with a maximum at . The relationship between the spectrum and the spectrum is made via the Legendre transform
| (5) |
where
| (6) |
and
| (7) |
is the mass correlation exponent of the order. To calculate the derivatives in (6), we have performed calculations at pairs of points and with , so that derivatives were calculated as , except at point , where we have used .
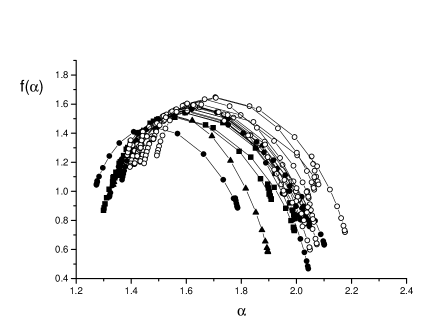
In Fig. 3 we show detailed results of our calculations, performed on the STARE database images segmented by observer AH, with respect to the spectrum. While the current set of images is not particularly adequate for testing the effects of a given type of pathology (there are only ten normal images, and ten pathological images affected by not necessarily the same disease, see stare3 ), it is seen that pathological case images tend to have lower maxima, occasionally more narrow spectrum range, and a shift in the spectrum position, in comparison with the normal cases.
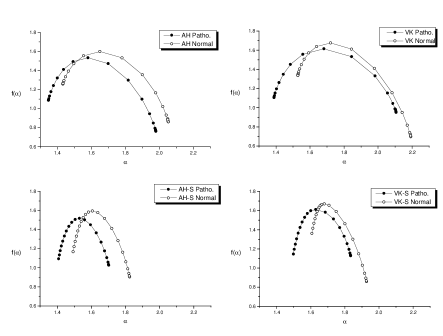
Finally, in Fig. 4 we present results of the spectrum averaged separately for the normal and the pathological images for all of the four sets, where it is seen that the previous observation holds for both observers, independent of skeletonization. The skeletonized images present more narrow spectrum then the original segmented images (which contain the vessel width information) for both observers, which may explain the conclusion of parsons that fractal analysis after skeletonization may be more sensitive to changes in vascular patterns. More precisely, since monofractals have infinitely narrow spectrum (a single fractal dimension), the above results show that skeletonized structures may be more closely approximated as monofractals (when a single dimension is calculated rather then the whole spectrum). As the general properties of the spectrum are preserved through skeletonizatin, another advantage of using such images may be considered the fact that they contain far fewer pixels, and therefore the calculations require less computer time.
The results of calculations of the spectrum presented in Figs. 3-4 again may be considered encouraging from the point of view of the objective of turning the diagnostic process automatic, although further more detailed studies are necessary to determine their statistical significance, and whether the observed differences in multifractal scaling behavior may be exploited for discerning normal images from images with certain types of pathologies. More precisely, the current work is primarily concerned with establishing the fact that retinal vessel images represent geometrical multifractals, nevertheless, our calculations suggest that there may be grounds for automatic differentiating between normal images and certain pathological cases.
In conclusion, we show in this work that vascular structures of the human retina represent geometrical multifractals, characterized by a hierarchy of exponents, rather then a single fractal dimension. We analyze twenty retinal images from the STARE database stare , where half of the images correspond to normal states of the retina, and half to different pathological states stare3 , together with their skeletonized versions. In all studied cases we find clearly multifractal behavior, with capacity dimension considerably lower then the DLA value. We also observe a tendency of normal images of having higher generalized dimensions and a shift of the spectrum range towards higher singularity strength values, in comparison with the pathological cases. While the last observations are hardly conclusive from a statistical standpoint, they may prove relevant in the quest of automatic diagnostic procedures.
References
- (1) F. Family, B.R. Masters and D.E. Platt, Physica D 38 98 (1989).
- (2) M.A. Mainster, Eye 4 235 (1990).
- (3) G. Landini, P.I. Murray and G.P. Misson, Invest. Ophtal. Vis. Sci. 36 2749 (1995).
- (4) A. Avakian, R.E. Kalina, H.E. Sage, A.H. Rambhia, K.E. Elliott, E.L. Chuang, J.I. Clark, J-N. Hwang and P. Parsons-Wingerter, Curr. Eye. Res. 24 274 (2002).
- (5) V. Lakshminanarayanan, A. Raghuram, J. W. Myerson, S. Varadharajan, Jour. Mod. Opt. 50 1701 (2003).
- (6) B.R. Masters, Ann. Rev. Bio. Eng. 6 427 (2004).
- (7) J. Feder, Fractals (Plenum Press, New York, 1988).
- (8) T. Vicsek, Fractal Growth Phenomena, 2nd edn (World Scientific, 1993)
- (9) T. Vicsek, F. Family and P. Meakin, Europhys. Lett. 12 217 (1990).
- (10) T. Tél, Á. Füllöp and T. Vicsek, Physica A 159 155 (1989).
- (11) A. Chhabra and R.V. Jensen, Phys. Rev. Lett. 62 (1989).
- (12) A.B. Chhabra, C. Meneveau, R.V. Jensen and K.R. Sreenivasan, Phys. Rev. A 40 (1989).
- (13) The STructured Analysis of the Retina (STARE) project, www.parl.clemson.edu/stare/probing. Last seen on September 4, 2005.
- (14) C. Amitrano, A. Coniglio and F. di Liberto, Phys. Rev. Lett. 57 1016 (1986).
- (15) Y. Hayakawa, S. Sato and M. Matsushita, Phys. Rev. A 36 1963 (1987).
- (16) J. Nittmann, H.E. Stanley, E. Torboul and G. Daccord, Phys. Rev. Lett. 58 619 (1987).
- (17) S. Ohta and H. Honjo, Phys. Rev. Lett. 60 611 (1988).
- (18) A. Hoover, V. Kouznetsova and M. Goldbaum, IEEE Trans. Med. Imag., 19 203 (2000).
- (19) P. Parsons-Wingerter, K. E. Elliott, J.I. Clark and A.G. Farr, Arteriosler. Thromb. Vasc. Biol., 20 1250 (2000).
- (20) S. Stefanelli and A. Rosenfeld,J.ACM 18 255 (1971);
- (21) See www.parl.clemson.edu/stare/diagnoses for more details on the diagnostic procedure used for classification of images.
- (22) T.C. Halsey, M.H. Jensen, L.P. Kadanoff, I. Procaccia and B.I. Shraiman, Phys.Rev. A 33 1141 (1986).