PRECISION SPECTROSCOPY OF PIONIC ATOMS: FROM PION MASS EVALUATION TO TESTS OF CHIRAL PERTURBATION THEORY
Abstract
Preliminary results of the strong interaction shift and width in pionic hydrogen () using an X-ray spectrometer with spherically bent crystals and CCDs as X-ray detector are presented. In the experiment at the Paul Scherrer Institute three different transitions in were measured. Moreover the pion mass measurement using the transitions in pionic nitrogen and muonic oxygen is presented
1 Introduction
Pionic hydrogen atoms are unique systems to study the strong interaction at low energies[2]. The influence of the strong interaction in pionic hydrogen can be extracted from the transitions. Compared to pure electromagnetic interaction, the 1s level is affected by an energy shift and a line broadening . The shift and the broadening are related to the hadronic scattering lengths and , by the Deser-type formulae [3]:
| (1) |
| (2) |
where is the strong interaction shift of the 1s level reflecting the scattering process. is the width of the ground state caused by the reactions and . is the kinetic center of mass momentum of the in reaction, and [4] is the branching ratio of the charge exchange and radiative capture (Panofsky ratio). are corrections that permit to connect the pure hadronic scattering lengths to the measurable shift and width[7, 8, 9]. The hadronic scattering lengths can be related to the isospin-even and isospin-odd scattering length, and :
| (3) |
The isospin scattering lengths can ben related to and in the framework of the Heavy Barion Chiral Perturbation Theory (PT)[5]. Scattering experiments are restricted to energies above 10 MeV and have to rely on an extrapolation to zero energy to extract the scattering lengths. Pionic hydrogen spectroscopy permits to measure this scattering length at almost zero energy (in the same order as the binding energies, i.e., some keV) and verify with high accuracy the PT calculations. Moreover, the measurement of allows an evaluation of the pion-nucleon coupling constant , which is related to by the Goldberger-Miyazawa-Oehme sum rule (GMO)[6].
Pionic atom spectroscopy permits to measure another important quantity: the charged pion mass. Orbital energies of pionic atoms depend on the reduced mass of the system. These energies can be calculated with high accuracy using Quantum Electrodynamics. Measuring transition energies, not disturbed by strong interaction, allows to determine the reduced mass of the system and hence the mass of the pion. The accurate value of the pion mass is crucial to evaluate the upper bound of the mass of the muonic neutrino from a measurement of the pion decay[11].
2 Description of the setup
The pionic atoms are produced using the pion beam provided by the Paul Scherrer Institut[1]. The beam momentum is 110 MeV/c with an intensity of . The pions are captured and slowed down using a cyclotron trap[12]. The target is made of a cylindrical cell with Kapton walls, positioned in the center of the trap. In the target cell the decelerated pions are captured in bound atomic states. During the de-excitation X-rays are emitted. As the muons from the pion decay in the beam are present as well, it is possible to produce muonic atoms and pionic atoms at the same time. The X-ray transition energies are measured using a bent crystal spectrometer and a position sensitive detector. The reflection angle between the crystal planes and the X-rays is related to the photon wavelength by the Bragg formula:
| (4) |
where n is the order of the reflection and is the spacing of the crystal planes.
The detector is formed by an array of 6 CCDs composed each by pixels[11], the pixel size is .
The 3-4 keV X-rays excite mostly one
or two pixels. Larger clusters are due to charged particle or high-energy gamma radiation and can be eliminated by cluster analysis. Transitions of different energies result in different reflection lines on the detector. By measuring the distance between these lines it is possible to determine the energy difference.
The resolution of the spectrometer is of the order of at 3 keV.
3 Extraction of the hadronic shift and width
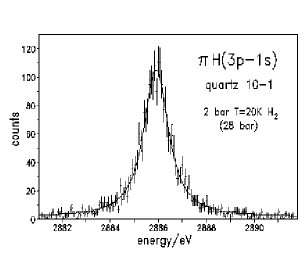
The characteristics of the ground state of pionic hydrogen are evaluated measuring the X-ray transitions (see fig.1).
The line width is the result of the convolution of: the spectrometer resolution, the Doppler broadening effect from the
non-zero atom velocity, the natural width of the ground state, and, of course, the hadronic broadening.
A very accurate measurement of the response function of the crystal was performed using the M1
transitions in He-like argon (with a natural line width less than 1 meV, Doppler broadening about 40 meV).
For this measurement the cyclotron trap was converted into an Electron-Resonance Ion Trap
(ECRIT)[13], with the crucial point that the geometry of the setup was preserved.
The Doppler broadening effect in the pionic transitions can be studied by working at different pressures and with different transitions. With the help of a cascade model we can predict
the kinetic energy distribution of the atoms and the corresponding Doppler
broadening[14].
A first series of measurements were completed in 2002.
The hadronic broadening extracted from the experimental line width is:
| (5) |
By varying the target density, we were able to prove that the formation of complex systems [15], which can add an additional shift to the ground state, is negligible. Energy calibration for the transition is performed using the transition in pionic oxygen. Strong interaction and finite nucleus size effect are negligible for this transition. Orbital energies can be calculated with an accuracy of a few meV[16]. The result for the shift is:
| (6) |
For the calculation of the shift a pure QED value of was used. The above given errors include statistical accuracy and systematic effects [17]. The value of is in agreement with the result of a previous experiment, where the energy calibration was performed with fluorescence X-rays[18], but more precise by a factor of 3.
4 Pion mass measurement
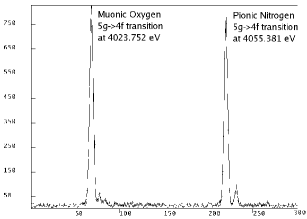
The evaluation of the pion mass is obtained by the measurement of the transition energy of the transition in pionic nitrogen in 2000 (see fig.1). We used the analog transition in muonic oxygen as a reference line. The energy difference between the two lines depends on the ratio between the pion mass and the muon mass, which is known with 0.05 ppm accuracy. The expected accuracy for the pion mass is less than 2 ppm, to be compared with the actual value, which has an accuracy of 2.5 ppm. This value is the average of two measurements, obtained using two different techniques and which differ by 5.4 ppm[19]. To reach this precision, we need a perfect understanding of the crystal spectrometer aberrations and the exact distance between pixels in the detector. For the second task an experiment was set up in September 2003 to measure the pixel distance at the working temperature of C. We used a nanometric grid composed by lines, thick, spaced by 2 mm with an accuracy of about . The mask, at room temperature, was illuminated by a point-like source at a distance of 6426.7 mm, and positioned at 37 mm from the CCD detector (see fig.2).
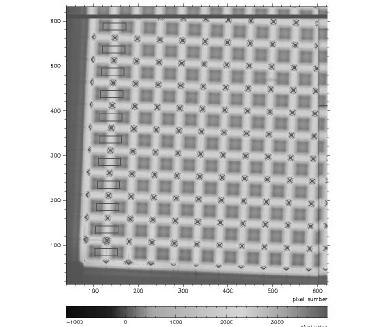
Applying linear fits to the lines of the grid in the CCD image it was possible to provide an accurate measurement of the average pixel distance:
| (7) |
5 Conclusions and outlook
The strong interaction shift in pionic hydrogen has been determined with an accuracy of 0.2%. During spring-summer 2004 the crystals have been characterized with X-rays from the ECRIT. The measurement of the broadening in muonic hydrogen in November-December 2004, together with the cascade model, will allow us to reach an accuracy of 1% for .
6 Acknowledgments
We thank the PSI staff, in particular the nanotechnology group, which provided the nanometric mask for the pixel measurement.
References
- 1 . PSI experiment R-97.02 and R-98.01: http://pihydrogen.web.psi.ch
- 2 . D. Gotta, Prog. Part. Nucl. Phys. 52, 133 (2004)
-
3 .
S. Deser et al., Phys. Rev. 96, 774 (1954),
G. Rasche and W.S. Woolcock, Nucl. Phys. A 381, 405 (1982) - 4 . J. Spuller et al., Phys. Lett. A 67, 479 (1977)
- 5 . V. E. Lyubovitskij and A. Rusetsky, Phys. Lett. B 494, 9 (2000)
- 6 . M.L. Goldberger, H. Miyazawa, R. Oehme, Phys. Rev. 99, 986 (1955)
- 7 . J. Gasser et al., Eur. Phys. J. C 26 , 13 (2002)
- 8 . D. Sigg et al., Nucl. Phys. A 609, 310 (1996)
- 9 . T.E. Ericson et al., arXiv:hep-ph/0310134v1 (2003)
- 10 . K. Assamagan et al., Phys. Rev. D 53, 6065 (1996)
- 11 . N. Nelms et al., Nuc. Instr. Meth. A 59, 419 (2002)
- 12 . L.M. Simons, Hyperfine Iteractions 81, 253 (1993)
- 13 . D.F. Anagnostopoulos et al., Nucl. Instrum. Meth. B 205, 9 (2003)
- 14 . T.S. Jensen and V.E. Markushin, Eur. Phys. J. D 19, 165 (2002)
- 15 . S. Jonsell et al., Phys. Rev. A 59, 3440 (1999)
- 16 . Paul Indelicato, private comunication.
- 17 . M. Hennebach, thesis Universität zu Köln, 2003
- 18 . H.C. Schröder et al., Eur. Phys. J. C 21, 473 (2001)
- 19 . Particle Data Group, Phys. Lett. B 592, 1 (2004)