Drift velocity and gain in argon- and xenon-based mixtures
Abstract
We present measurements of drift velocities and gains in gas mixtures based on Ar and Xe, with CO2, CH4, and N2 as quenchers, and compare them with calculations. In particular, we show the dependence of Ar- and Xe-CO2 drift velocities and gains on the amount of nitrogen contamination in the gas, which in real experiments may build up through leaks. A quantification of the Penning mechanism which contributes to the Townsend coefficients of a given gas mixture is proposed.
keywords:
drift chambers , drift velocity , gas gain , Xe-CO2 mixtures , Nitrogen contamination , Penning transferPACS:
29.40.Cs, , , ,
1 Introduction
Modern detectors such as those being constructed for the Large Hadron Collider (LHC) include large-volume gaseous detectors which are expected to operate continuously for several months every year. The required performance of these detectors usually involves the precise control and monitoring of the drift velocity and the gain. These relevant gas parameters depend on the detector field configuration and on the gas components, composition, density, and purity. The gas mixtures used in these detectors, driven by performance, may contain a high cost component which makes it important to recirculate the gas in a closed loop, with a modest rate of fresh gas injection. This mode of operation results, if no gas envelope is foreseen around the detector, in an increasing amount of air in the gas volume, entering through leaks, however small these are. While oxygen can be readily removed by appropriate filters, the known methods for nitrogen removal are complex and tedious, and lead to further losses of the main gas and to the modification of its composition. The latter circumstance is particularly undesirable during data taking periods. Thus, nitrogen gradually builds up into the mixture. The operation of the detector, namely the charge transport and amplification processes, may therefore change during running periods.
A case in point is the ALICE Transition Radiation Detector (TRD) [1], which is designed to provide electron identification and particle tracking in the high-multiplicity environment of Pb+Pb collisions at the LHC. To achieve these goals, accurate pulse height measurements over the full drift time (order of 2 s) in wire chambers operated with a Xe-CO2 [85-15] gas is necessary. Therefore, knowledge of both the drift velocity and the gas gain is important. The large volume (28 m3) of this barrel detector and the high cost of xenon makes it mandatory to recirculate the gas mixture, and to limit the injection of fresh gas to replenish what is lost through leaks only. In this case, the nitrogen concentration in the mixture would reach 8 % after a running period of 8 months. Most of this nitrogen may be cryogenically distilled and removed from the mixture during the shutdown periods, at a moderate loss of xenon. Since the gas mixture during running periods contains a varying admixture of N2, studies of the influence of N2 on the gas properties become very important.
In the following section we describe the experimental method used to measure both the drift velocity and the gain of various gas mixtures. In section 3 we show the measured drift velocities. Measurements of drift velocities in some binary and ternary Xe-based mixtures (without nitrogen) have been published earlier [2, 3, 4, 5]. We compare our results to existing data where available and to simulations, in order to validate our method. The gain measurements, together with results from simulations, are presented in section 4. We finally draw our conclusions.
2 Experimental setup
The experimental results are obtained using a small drift chamber with a geometry similar to that anticipated for the final ALICE TRD [1], but with a much smaller active area (1010 cm2). The chamber has a drift region of 31.5 mm and an amplification region of 6.4 mm. The anode wires (W-Au, 20 m diameter) have a pitch of 5 mm. For the cathode wires (Cu-Be, 75 m diameter) the pitch is 2.5 mm. The signal is read out on a cathode plane segmented into rectangular pads of area 6 cm2. The drift electrode is made of a 25 m aluminized Kapton foil, which also serves as gas barrier. The electric field thus created is sufficiently uniform over the full active area of the pad plane.
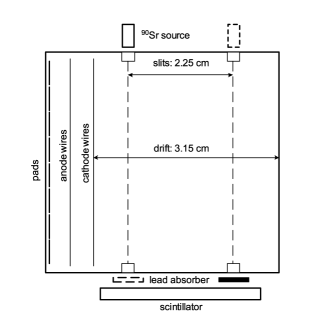
A schematic view of the setup used for the drift velocity measurements is presented in Fig. 1. Two sets of slits, 0.75 mm wide, are machined into the stesalit side walls of the drift region and covered with Kapton foils. Electrons from a collimated 90Sr radioactive source enter the drift volume through either of these slits, and ionise the gas. Some of these particles cross the corresponding slit at the other side of the drift enclosure, behind which a scintillator is placed for triggering purposes. Triggered events will show signals in the 8 pads under the track, with a drift time corresponding, on average, to the distance from the selected set of slits to the anode plane. A 2 mm thick lead absorber is placed behind the opposite outlet slit to prevent triggers from particles going at an angle through the detector. For each set of slits, we record on FADCs the pulse height distributions on the pads as a function of the drift time of the tracks. The corresponding average times are evaluated and then subtracted. In this way, the contribution to the drift time of the amplification region, where the electric field is not uniform, is cancelled. The anode voltage is adjusted for each mixture to achieve a gain near 104, and ranges between 1450 V and 1800 V. Both the pad plane and the cathode wires are kept at ground potential. The amplification field leaks through the cathode wire plane and effectively increases the drift field. In order to correct for this effect, the position of the 0 Volts equipotential line, relative to the position of the cathode wires, is computed with the Garfield simulation package [6] for each set of anode and drift voltages. This shift, which depends on both the drift and anode voltages, ranges in our case from 0.02 mm to 6 mm. The reduced electric field is finally evaluated with the recorded ambient pressure. The oxygen and water vapour in the gas was monitored during the measurements, and varied, depending on the gas flow, between 10 and 50 ppm O2, and 300 to 500 ppm H2O. The resulting drift velocity, measured as a function of the reduced electric field, has an uncertainty estimated to be lower than 10 %.
The gain is measured with an 55Fe source, by counting the number of signals produced by X-rays absorbed in the gas, and measuring the currents drawn by the anode high voltage power supply due to these photons. Typical rates are 60 kHz in a projected area of order 1 cm2. The number of primary electrons per photon produced in the gas is derived for each mixture separately using the work functions given in [7]. The drift voltage during these measurements was set at -2 kV.
We use a prototype of the charge-sensitive preamplifier/shaper (PASA) especially designed and built for TRD prototypes with discrete components. It has a noise on-detector of about 2000 electrons r.m.s. and the FWHM of the output pulse is about 120 ns for an input step function. The nominal gain of the PASA is 3 mV/fC. The FADC has an 8-bit non-linear conversion and adjustable baseline, and runs at 100 MHz sampling frequency.
3 Drift velocity measurements
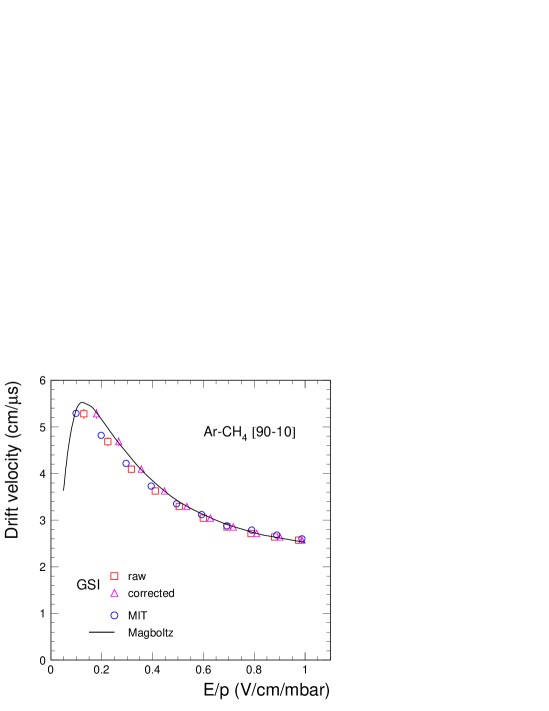
In order to validate our experimental method, we first measured the drift velocity of a well known mixture, Ar-CH4 [90-10], and compared our results with existing data [5] that we refer to as MIT data. We also compare the measurements with Magboltz [8] calculations. We show our results without and with the correction of the reduced field due to the leakage of the anode field into the drift region. This correction is higher at lower drift fields. As can be seen in Fig. 2, the agreement between this work and the calculation is good only after the correction of the drift field values. On the other hand, a clear discrepancy with the MIT data is visible at low fields, and reaches 10 %.
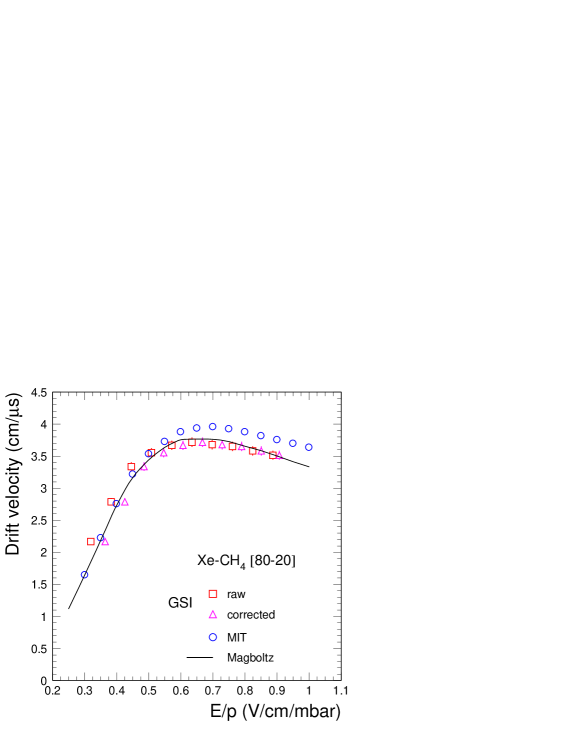
We then measured the drift velocity of Xe-CH4 [80-20], which the MIT group has also measured. The motivation for this second reference measurement is that the multiple scattering of electrons coming for the 90Sr source is significant in xenon. This effect, in combination with the asymmetric gas volume available for tracks emerging from either slit, biases the measurement towards larger drift velocities by, in this case, as much as 15 %. For this reason, we work with drift time distributions measured on the pad closest to the entrance slit only, where multiple scattering is minimal. The argon data showed no difference, within 2 %, in the results obtained from any pad, meaning that the drift field is uniform enough in the regions above the pads at the edges of the active area. The resulting drift velocity and its comparisons are shown in Fig. 3. There is again a significant discrepancy between our measurement and the MIT results at fields above drift velocity saturation. However, the calculations of the drift velocity in this region are compatible with the measurement of this work. At low fields, on the contrary, the MIT data agree well with the calculation, whereas our results underestimate the calculated values by 7 % near 0.45 V/cm/mbar.
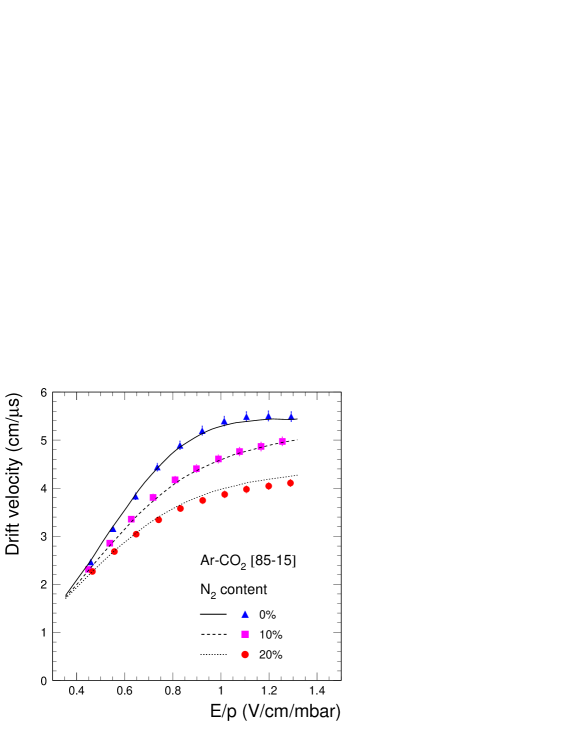
The next set of measurements were undertaken for Ar-CO2 [85-15] and admixtures of 0, 10 and 20 % N2. Adding, for example, 10 % N2 into the mixture results in an Ar-CO2-N2 [76.5-13.5-10] mixture. As can be seen in Fig. 4, the drift velocity decreases with increasing concentration of nitrogen, and there is a reasonable agreement between measurements and simulation. Due to the saturation of the drift velocity at lower values with increasing N2 content, keeping the drift velocity constant would require higher and higher drift voltages as the gas composition changes, and to maintain a fast mixture would eventually become impossible.
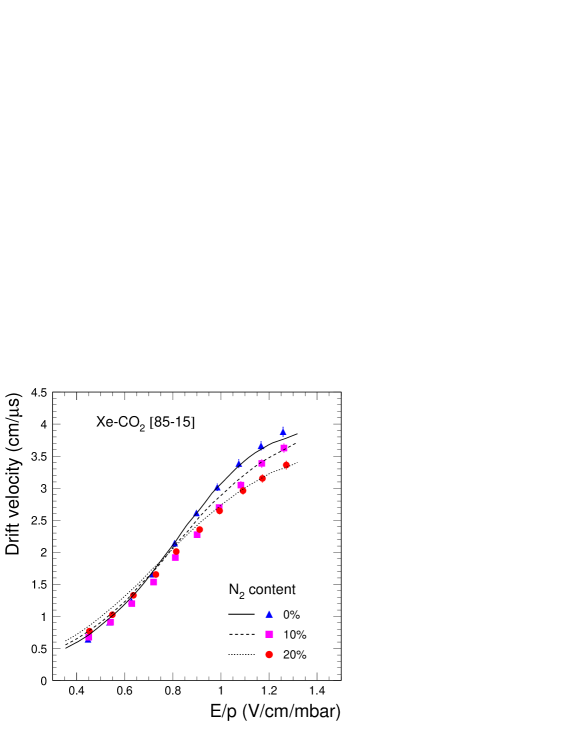
Finally, the results for Xe-CO2 [85-15] mixtures with 0, 10 and 20 % N2 admixtures, shown in Fig. 5, exhibit a weak dependence on the nitrogen concentration. We notice deviations of up to 12 % with respect to the calculations at intermediate fields. The calculated drift velocities exhibit a crossing of the three curves at a field near 800 V/cm. The measurements show very little dependence of the drift velocity on the N2 concentration at fields up to this value. Since, for example, the anticipated electric field of the ALICE TRD is 700 V/cm, this circumstance should be welcome: the change in drift velocity due to substantial accumulations of nitrogen would be negligible in this case.
4 Gain measurements
As explained in the introduction, the absolute gain as a function of the anode voltage is measured with the use of a 55Fe source, which is placed in front of the entrance window of the chamber. We have also carried out calculations of the gain with the use of the package Magboltz 2 [8]. This program computes the Townsend coefficient for a given gas mixture and electric field. By introducing this information, together with the chamber geometry and voltages, into Garfield [6], one can calculate the gain of the detector for each mixture and anode voltage. The multiplication factor obtained this way accounts for the electrons produced in the avalanche by collisions of atoms or molecules with other energetic electrons. In addition, Magboltz 2 provides information about the excited and ionised species produced in the avalanche. This information can be used to scale up the Townsend coefficients, according to the ionisation of gas species due to collisions with other excited metastable gas states (Penning effect) [9, 10, 11]. Since this energy transfer rate is a priori not known, the experimental data are used as a guide to tune one parameter, the so-called Penning fraction, for matching the calculations to the measurements. The Penning fraction refers to the amount of a given excited species which effectively ionise an atom or molecule, normalised to the abundance of such species and provided the energy balance of the process allows for the reaction. It should be noted, though, that this parameter is unique for a given gas mixture, i.e. it does not depend on the electric field nor the high voltage, and that it is expected to vary according to the characteristics of the quencher(s) and noble gas used in the mixture. In other words, the Penning transfer can be regarded as a measure of how well a quencher works: light noble gases tend, through their excited states, to ionise quenchers such as CO2, and therefore the Penning fraction in these mixtures are expected to be relatively large. On the other hand, heavy noble gases will tend to be ionised, probably to a lower extent, by excited molecules of certain quenchers (Penning mixtures).
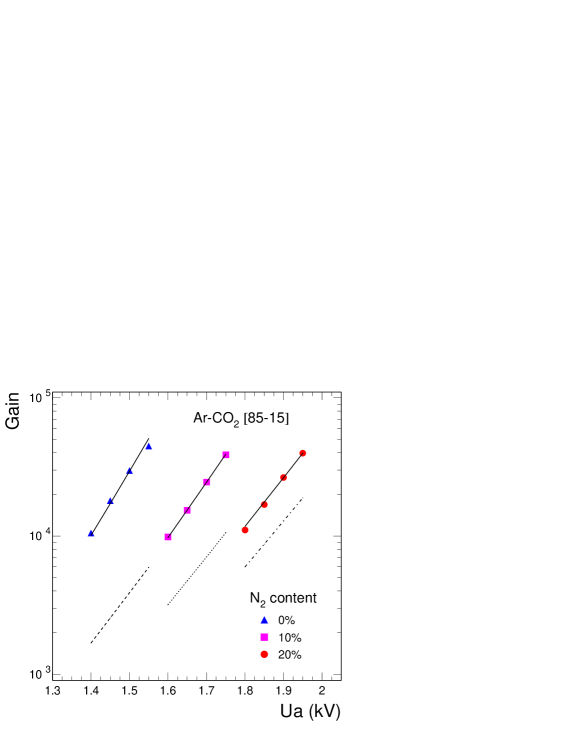
In the case of Ar-CO2-N2 mixtures, the suggested Penning mechanism to provide extra gain is the reaction Ar∗ + CO2 Ar + CO2+ + e-, where the average excitation energy of the Ar D-levels is 14.0 eV and the ionisation potential of CO2 is 13.773 eV. Fig. 6 shows the measured and calculated gain as a function of anode voltage for the three argon-based mixtures. As can be observed, after tuning of the Penning fraction to the second highest point in each curve, the slopes are properly matched by the calculations. The Penning fraction decreases from 37 % in the case of no nitrogen to 8 % when the N2 admixture is 20 %. This means that nitrogen limits the Penning ionisation of CO2. This effect may occur by quenching of the excited argon states by N2 or by the occasional excitation of the nitrogen molecule thus leaving the argon atom unexcited. The highest excitation level in N2 used in the calculations corresponds to 13.0 eV. The difference in voltage for equal gain in this series of mixtures is about 200 V, and apparently this gap increases with the gain.
Shown also in Fig. 6 are the calculated gains with no Penning effects, which fail to reproduce the measurements. In addition, the slopes, at least for the nitrogen free case, are less steep than the experimental ones, and the disagreement of the calculations with the measurements decreases with increasing N2 concentrations. Thus, the effect of nitrogen in this mixture, apart from lowering the gain at a given voltage, is to reduce the Penning effect by providing more effective quenching.
The case of the Xe-CO2-N2 mixtures is, from the Penning transfer point of view, different from argon. In this case, the highest energy level of excited Xe is 11.7 eV, insufficient to ionise CO2. Levels in CO2 between the Xe ionisation energy, 12.13 eV, and the CO2 ionisation at 13.773 eV have sufficient energy to cause xenon ionisation. Unfortunately, due to the lack of data, all CO2 excitations above 10.5 eV have been combined into a single level at 10.5 eV [12, 13] in the simulation program. This does not exclude an analysis similar to the previous mixture since only a fraction of the excitation of the 10.5 eV level representing levels above 12.13 eV are used in the simulation. In conclusion we assume that the Penning transfer occurs from CO(10.5) onto ionisation of xenon. The effect of N2 on the Xe-CO2 mixture is quite complex. There are possible energy transfer channels from CO to N2 as in the Ar-CO2 mixture but also from N to ionisation of Xe. The nitrogen excited states are produced less copiously than the CO2 excited states according to calculations done with Magboltz 2. Therefore as an approximation we assume the dominating transfer is from CO to Xe.
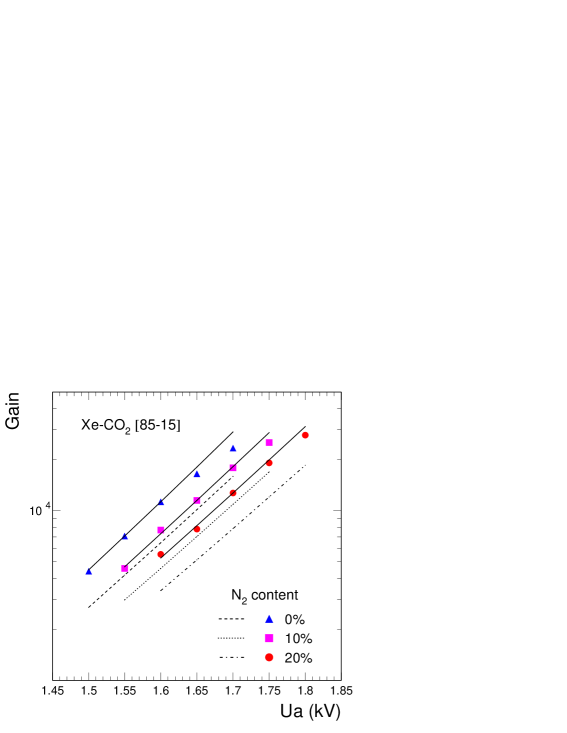
The experimental gain measurements, and the calculations performed under these assumptions, shown in Fig. 7, give an approximately constant Penning fraction (22 %). All slopes are correctly reproduced, with and without Penning transfer. The voltage gaps between the curves is about 50 Volts. The deviation of the data from the calculation -tuned at the middle point of each curve- at high gains is probably an indication of space charge effects within the amplification region due to the high X-ray rates. It is interesting to note that this measured deviation from exponential behaviour seems to decrease with increasing N2 concentration, probably due to the higher anode fields involved. This also implicates space charge as the cause.
5 Conclusions
Drift velocity and gain measurements have been performed for a number of gas mixtures in order to assess the effect of nitrogen admixture in the gas. In particular, the drift velocity measurements presented in this work show a reasonable agreement with calculations performed with Magboltz, although significant discrepancies are clearly visible in some cases. Our measurements have been corrected for the effect of the amplification field leaking between the cathode wires. The effect of the multiple scattering of sub-MeV electrons in xenon has been reduced to a negligible level. In the case of Xe-CO2 mixtures, the variation of the drift velocity as a function of the N2 admixture turns out to practically vanish at fields below 800 V/cm.
Gain measurements have been performed with mixtures with CO2 and admixtures of N2. A phenomenological quantification of the Penning mechanism, namely further ionisation from excited species formed in the avalanche, has been proposed and calculated with the Magboltz 2 simulation program. The measured gain curves are not reproduced by the calculations without this mechanism. Penning transfer is somewhat inhibited by the presence of N2 in the argon-based mixtures. In the case of the heavier xenon mixtures, the role of N2 in this respect seems to be negligible.
Acknowledgments
We would like to acknowledge A. Radu and and J. Hehner for their skills and dedication in building our detectors, and A. Manafov for his help in software issues.
References
- [1] ALICE TRD Technical Design Report, CERN/LHCC 2001-021, October 2001; http://www-alice.gsi.de/trd/trd.
- [2] L.G. Christophorou et al, Nucl. Instr. Meth. 171 (1980) 491.
- [3] B. Dolgoshein et al., Nucl. Instr. Meth. Phys. Res. A 294 (1990) 473.
- [4] T. Kunst, B. Götz and B. Schmidt, Nucl. Instr. Meth. Phys. Res. A 324 (1993) 127; B. Schmidt, private communication.
- [5] U. Becker et al., Nucl. Instr. Meth. Phys. Res. A 421 (1999) 54; http://cyclo.mit.edu/drift/www.
- [6] R. Veenhof, Nucl. Instr. Meth. Phys. Res. A 419 (1998) 726; http://consult.cern.ch/writeup/garfield/.
- [7] F. Sauli, CERN Yellow Report 77-09 (1977).
- [8] S.F. Biagi, Nucl. Instr. Meth. Phys. Res. A 421 (1999) 234. Magboltz 2, version 5.3, is available from the author (sfb@hep.ph.liv.ac.uk).
- [9] W.H. Miller and H. Morgner, J. Chem. Phys. 67, 4923 (1977).
- [10] J.E. Velazco, J.H. Kolts, and D.W. Setser, J. Chem. Phys. 69, 4357 (1978).
- [11] P. Cwetanski, Proc. IEEE Nuclear Science Symposium and Medical Imaging Conference, Lyon, France, Oct. 2000, 5/39-43.
- [12] B.R. Bulos and A.V.Phelps, Phys. Rev. A14, 615 (1976).
- [13] Y.Nakamura, Aust. J. Phys. 48, 357 (1995).