Direct Test of the Time-Independence of Fundamental Nuclear Constants Using the Oklo Natural Reactor 111Lecture given at ATOMKI, 18 November, 1982. This document was re-entered manually; scanned original is available at http://alexonline.info . This document was uploaded to arXiv.org by Ilya Shlyakhter (contact info at http://ilya.cc) after the death of its author.
1 Introduction
The following eight quantities enter the basic laws of physics and are generally regarded as the “fundamental constants” (I follow Dyson’s review [1] in this section).
-
1.
, velocity of light
-
2.
, Planck’s constant
-
3.
, elementary charge
-
4.
, mass of the proton
-
5.
, Fermi’s constant of weak interactions
-
6.
, constant of gravitation
-
7.
, Hubble’s constant ( years gives the “age” of the Universe)
-
8.
, mean density of mass in the Universe
This list is not exhaustive, of course. In particular, the constants of strong interactions could be added to it.
The “cosmological” quantities and , which refer to the Universe as a whole, vary as it expands: they are decreasing at the rate of about . On the other hand, the “laboratory” quantities 1)-6) are generally believed to be exactly constant. Milne [2] and Dirac [3] were the first to notice that this is no more than a hypothesis, requiring experimental confirmation.
I’d like to emphasize that only those variations of fundamental constants which change at least one dimensionless ratio of the dimensional quantities have physical meaning. The reason is that only such ratios do not depend on the choice of units and standards.
From the dimensional quantities 1) - 8) five dimensionless ratios can be formed:
-
1.
-
2.
-
3.
-
4.
-
5.
Note that the inverse of gives which is the age of the Universe measured in “tempons” (atomic units of time).
According to the conventional view the ratios of the “laboratory” quantities , , and did not change their numerical values during the 20 billion years since the “Big Bang”.
The Conventional View: .
Dirac [3] introduced the “Numerological Principle” (or “The Large Numbers Hypothesis” (LNH) which states that “all very large dimensionless numbers which can be constructed from the important natural constants of cosmology and atomic theory are connected by simple mathematical relations involving coefficients of the order of magnitude unity” [3b]. For example, the large value of could prove compatible with the numerological principle if it was proportional to and thus was time-dependent.
The majority of the proposed versions of the possible variation of constants is based on similar arguments. Three of them are listed below (see [1, 3, 4, 5]).
-
•
Dirac (1937):
-
•
Teller (1948):
-
•
Gamow (1967):
These versions predict the rate of variation of constants at the present epoch about .
2 Experimental Limits on the Rate of Variation of “Nuclear” Constants
Direct experimental evidence comes either from astrophysics or from geophysics. Astrophysical data allow judgement on the large-scale uniformity of physical laws in space (at distances up to 15 billion light years). Geophysical ones provide evidence on the absence of variation of constants along the world-line of the Earth since its crust became solid ( 4.5 billion years ago).
The data on the absorption spectra of the distant quasars show that the numerical value of the dimensionless quantity is the same throughout the observable Universe with the accuracy of about [8]. If one assumes the Friedman model, this limit restricts the possible rate of variation of by .
The decay rate of radioactive nuclide depends on nuclear constants. For example, in the case of high and small decay energy the -decay rate is highly sensitive to the value of . The estimate of the “sensitivity” gives [1]
For the transition ( billion years, keV), this estimate gives . Using the data on the abundances of rhenium and osmium isotopes, Dyson [1] obtained the following upper limit on the rates of variation of and :
If one assumes that does not change with time, the limit for is:
.
3 Neutron Resonances as the Sensitive Indicators of the Variation of Nuclear Constants
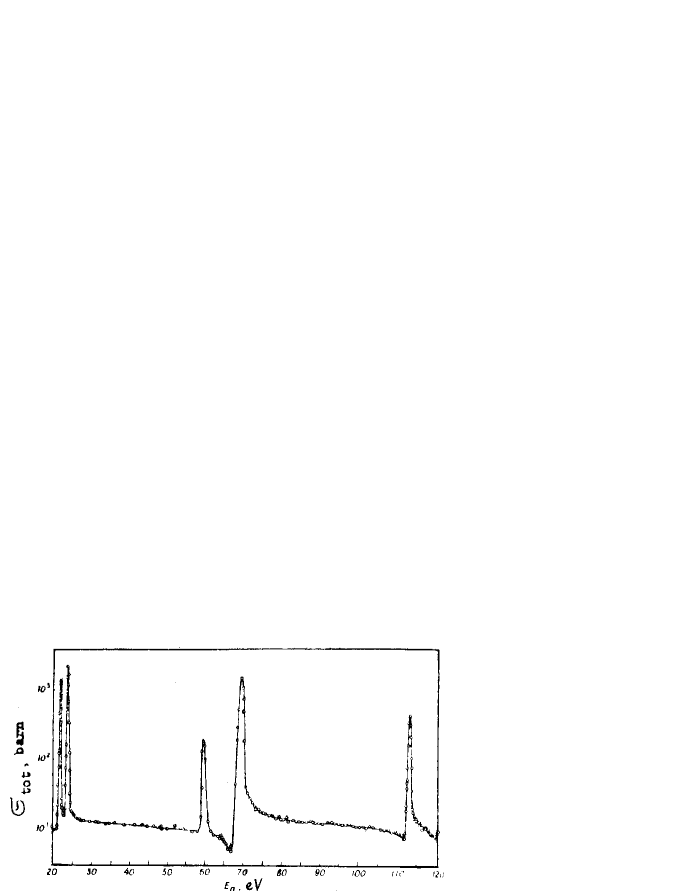
Several years ago I noticed that because of the sharp resonances in its absorption cross-section, the heavy nucleus is a highly tuned detector of neutrons. Resonances will shift along the energy scale if there is a change in the nuclear potential, by analogy with the shift in the reception frequency in an ordinary radio receiver when there is a change in the parameters of the resonance circuit [9].
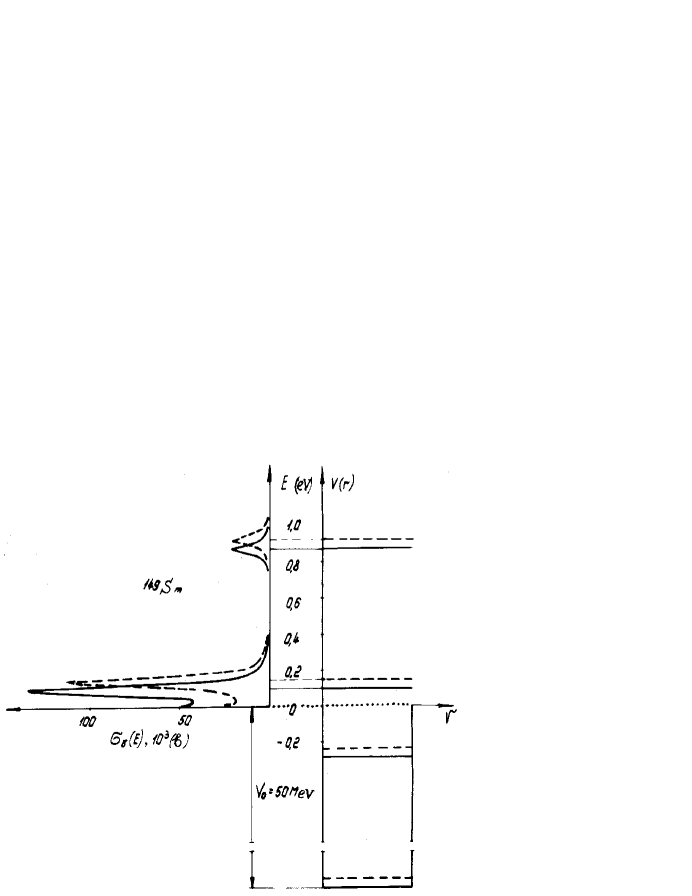
For the incident neutron, the nucleus presents a potential well with the depth of about MeV. At low neutron energy the cross-section exhibits sharp resonances (Fig. 1). Their positions are measured with the accuracy eV. Thus, there are two energy scales: and . Any change of by would cause the shift of all nuclear levels including the levels of compound nucleus, i.e. neutron resonances (Fig. 2).
The dimensionless quantity entering this problem is the ratio of the depth of the potential well to the uncertainty in the resonance energy . This suggests that variations of the basic nuclear parameters are amplified in the shift of resonances by an enormous factor .
Unfortunately, it seems very difficult to calculate consistently the shift of a given neutron resonance caused by the variation of the fundamental nuclear constants. Here I shall use the simplest assumption that neutron resonances are shifted by like single-particle levels in a potential well. Then the experimental evidence showing that the shift of the resonances during the time period has not exceeded imposes the following limits on the possible variation of the interaction constants:
-
•
strong:
-
•
electromagnetic:
-
•
weak:
I follow Gamow [5b] in assuming that the variation of the strong interaction constants is adequately reproduced by the change in the depth of the nuclear potential well. The estimate for is based on the equation of nuclear compressibility [10]. For nuclei with the change in the radius appears to be 40 times less than the change in and the corresponding shift of the levels is 20 times less. The limit for is obtained assuming that the contribution of weak interactions to the nuclear binding energy is of the order of [11, 12].
These estimates demonstrate that if there existed a Precambrian physicist who could measure the energies of the neutron resonances about a billion years ago with an accuracy about eV then the limits of the possible variation of the fundamental nuclear constants could be improved by several orders of magnitude. The striking discovery of the “Oklo natural nuclear reactor” proves that such seemingly improbable experiment has been actually performed nearly 2 billion years ago and the results have been reliably “recorded” in the isotopic composition of the elements in the reactor core.
4 The Oklo Phenomenon
Oklo is the name of a locality in the Gabon Republic (West Africa) where the open-pit uranium mine is situated. About 1.8 billion years ago within a rich vein of uranium ore “the natural reactor” went critical, consumed a portion of its fuel and then shut down. The total amount of energy produced by the reactor is estimated as megawatt years which seems to be enough for a city like Budapest for about a year. You now may have a question: how could it appear that even in the design of nuclear reactors, which is generally considered to be one of the most impressive achievements of science and technology of our century, “the man was not an innovator but an unwitting imitator of nature” [17].
In fact, no natural reactor could operate today with uranium containing only 0.72 percent of the fissile isotope . The ratio of to , however, has not been constant throughout the history of the Earth. The half-life of is about 700 million years, that of about 4.6 billion years. Thus, 2 billion years ago the abundance of was about 3 percent (note that in the contemporary power-producing reactors uranium is enriched up to the same value). In 1956 Kuroda [13] showed that at that epoch under favourable conditions (i.e. concentration of water must be high enough and that of the strong absorbers of neutrons low enough) the spontaneous nuclear chain reaction could take place in rich uranium deposits. However, until 1972 no traces of a natural reactor have been found.
In June 1972 the uranium slightly depleted in was first detected at a French uranium-enrichment plant. The anomaly was traced through the numerous stages of the manufacturing process right back to the ore-enriching plant at Mounana near Franceville in Gabon. The original ore with mean abundance of 0.4-0.5% was mined at Oklo. The French Atomic Energy Comission (CEA) then initiated the investigation of this “Oklo Phenomenon”. The analysis of the numerous samples obtained by drilling revealed the distribution of isotopic anomalies in detail. The results were discussed at the IAEA symposiums [14, 15] and reviewed in [16, 17, 18, 19].
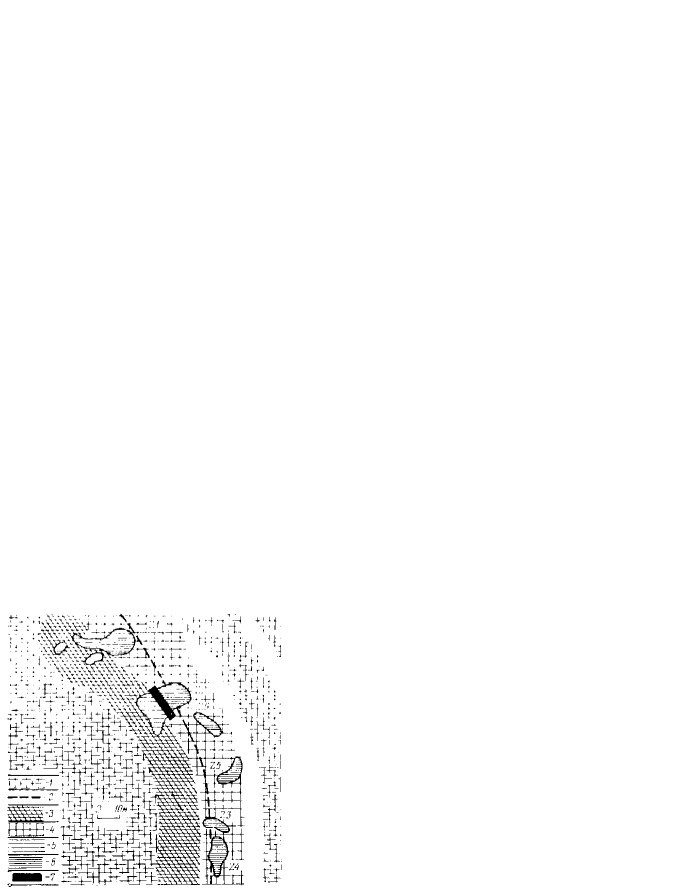
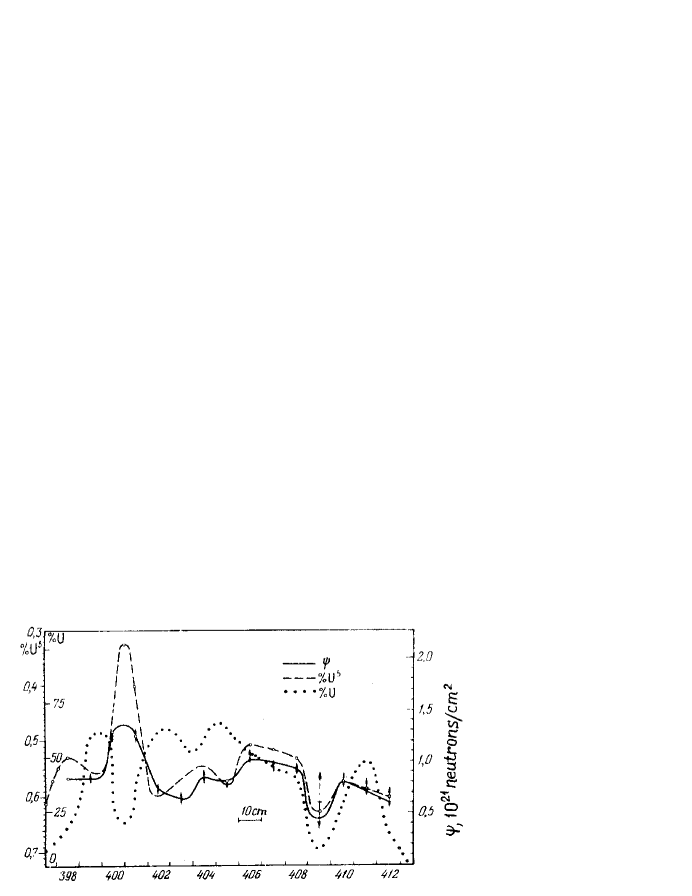
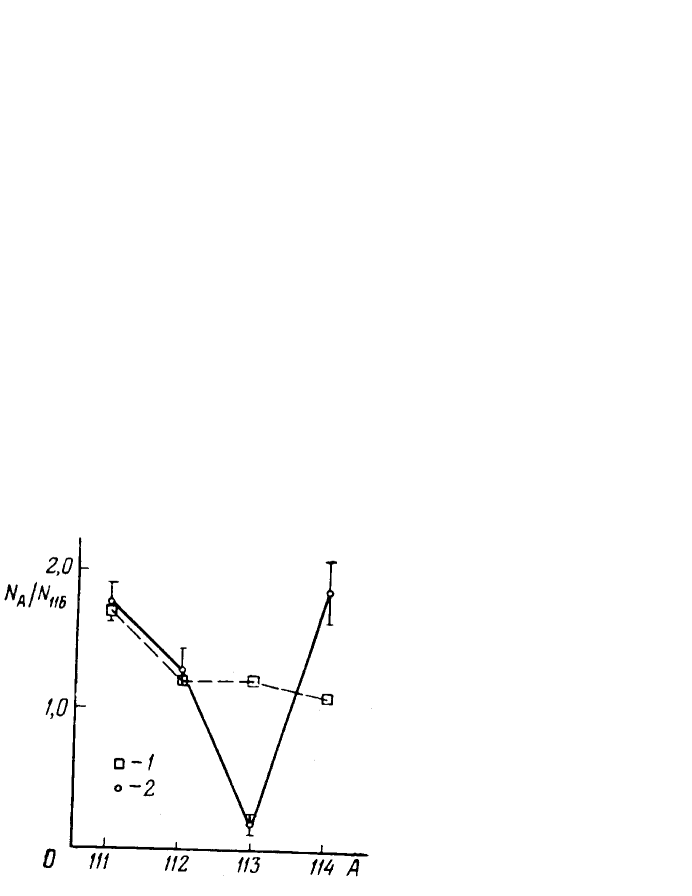
Altogether 6 reaction zones (Fig. 3) were found over a distance of a few dozen meters. The spectrum of fission products (especially of the rare-earths) gives the quantitative evidence that a natural reactor once operated there. Both the absolute amounts of these elements and their isotopic composition can be explained only by their origin in fission (Table 1). The fluence (the flux integrated over time) of thermal neutrons, which can be determined e.g. from the / ratio, reaches the value of (Fig. 4). This means that the strong absorbers of thermal neutrons (having capture cross sections barn) must become heavily depleted. At the same time the concentration of the next (in A) isotope will increase. This phenomenon has been observed experimentally (Fig. 5). This in itself shows immediately that a chain reaction initiated by thermal neutrons has taken place.
5 The “Measurement” of the Energies of Neutron Resonances 2 Billion Years Ago Using the Oklo Data
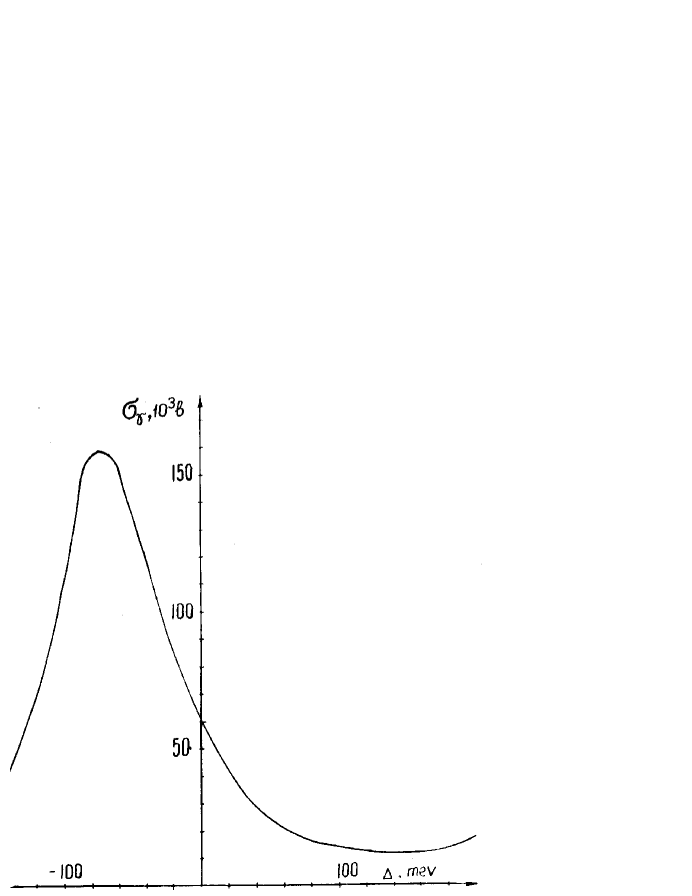
In the strong absorbers of thermal neutrons their large capture cross sections are determined in each case by a single resonance which is occasionally located near zero neutron energy. The cross section is given by the Breit-Wigner formula
Here is the statistical factor, is the neutron energy and is the corresponding wavelength, and are the partial elastic and capture widths, and is the total width of the resonance. The cross section changes sharply when the resonance is shifted along the energy scale. Fig. 6 shows this effect for the maxwellian-averaged (at kT=0.025 eV) capture cross section of . From the relative concentrations of samarium isotopes and the neutron fluence independently determined at the same points of the reactor one can extract the value of the capture cross section at the epoch of chain reaction. For example, R. Naudet et al [14] have measured the isotopic composition of uranium, neodymium and samarium in 50 samples and have managed to determine the fluence from U and Nd data reliably for 36 of them. Then the cross section of is given by the following equation
Here denotes the final concentrations of samarium isotopes, is the ratio of the average concentration during the period of the reaction to its final value, are the yields of from the fission of ( is negligible).
The analysis of samarium data for the same 36 samples where is known gives the value of “measured” 2 billion years ago
the contemporary value being barn (this value depends on the spectrum of thermal neutrons, here I use the maxwellian spectrum at ). Taking into account two standard erros, we obtain [9a]
If one takes into account also the data for europium (which are less precise) with three standard errors the result is [9b]
Note that the effect of such a small shift of resonances upon the capture cross sections of uranium and neodimium is negligible, so the fluence is determined reliably.
Yu.V.Petrov [18] has pointed out that one could avoid determining if the relative concentrations of two strong absorbers were available. In this case the absence of a shift in the resonance of one absorber relative to the other can be verified directly.
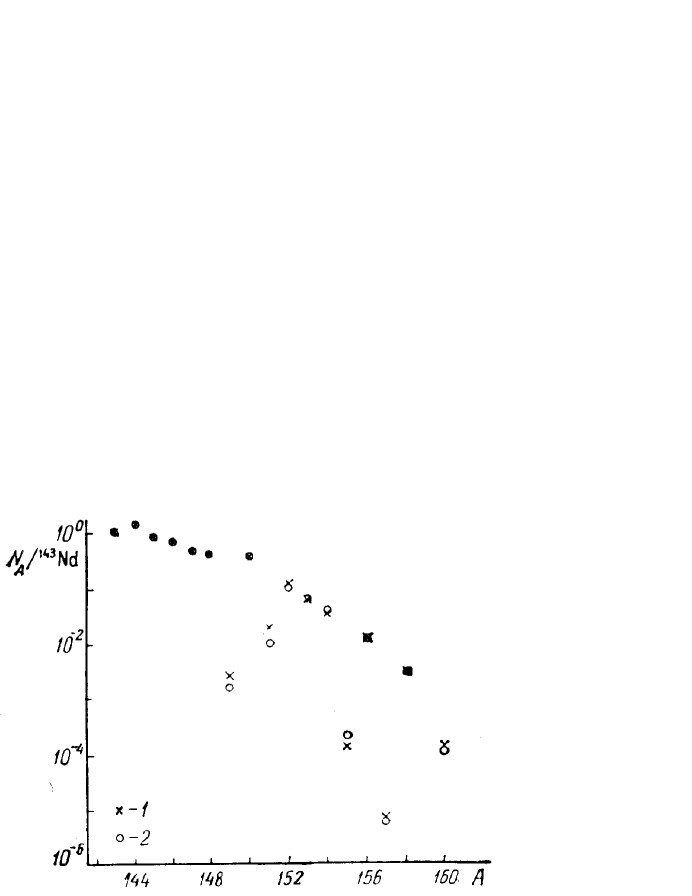
The absence of an appreciable shift of near-threshold resonances also follows qualitatively from the fact that all the contemporary strong absorbers were strongly burnt up in the Oklo reactor, whereas the weak absorbers were weakly burnt up [18]. In addition to the cadmium data (Fig. 5) the results of the measurements of the conentration of rare-earth elements relative to in one of the Oklo samples [20] are reproduced in Fig. 7. The dips in the distribution correspond to strong absorbers: , , and . The burn-up depth, calculated using the contemporary values of absorption cross section is in excellent agreement with experiment, especially if we recall that the neutron spectrum over which the cross section has to be averaged is now known well enough.
We therefore conclude once again that, over the 1.8 billion years since the operation of the Oklo reactor, the resonances or, in other words, the compound-nucleus levels, have shifted by less than eV, i.e. the mean rate of the shift did not exceed eV / year. This is by three orders of magnitude less than the experimental limit on the rate of change in the transition energy in the decay of . Unfortunately, at present there are no consistent calculations that would have connected the position of each neutron resonance with the nuclear potential parameters reliably. However, even the preliminary estimates of Sec. 3 can be used to improve the limits obtained by other authors substantially (Table 2). These estimates evidently rule out a power law or a logarithmic asymptotic dependence of the strong and electromagnetic interaction constants on the lifetime of the Universe.
6 The Probability of an Occasional Coincidence
I have assumed above that the variation of nuclear constants (if any) has been very small so that the shift of resonances would have appeared much less than their average separation. One could imagine, however, a case in which even after a considerable variation of the constants all the strong absorbers would have remained strong. This could occur if some other resonance appeared near the threshold and dominated in the capture cross section. In this section I shall estimate the probability of such a coincidence using the recently developed statistical approach to estimating unknown thermal cross sections [21].
For each nuclide one calculates the “expected” capture cross section using the average values of its resonance parameters. The universal distribution function has been calculated using the generally accepted distribution laws for these parameters. It gives the probability for the ratio of the actual cross section to its expected value not to exceed .
Table 3 which is taken from [23] gives the probability for each strong absorber to remain strong after a large variation of constants. I assumed that its new cross section will be at least half of its old value. Those nuclides for which this probability is small appear to be sensitive “indicators” of the variation of constants (e.g. and ). On the other hand, will remain a strong absorber with the probability of about 0.3, thus being rather useless in this respect. The product of the values for all nuclides gives the probability of a simultaneous coincidence the estimate . Note that this estimate is rather conservative since if the resonances have shifted considerably some weak absorbers could have been strong ones 2 billion years ago, giving rise to some mysterious isotopic anomalies at Oklo none of which have been seen.
7 Conclusions
The analysis of the Oklo data provides very strong evidence in favour of the invariability of nuclear constants. The shift of neutron resonances during the last 2 billion years does not exceed or . This is so far the most precise limit and simple estimates of the rate of variation of the interaction constants shown in Table 2 were cited on several occasions (see e.g. [24, 25, 26, 27]). I must note, however, that these estimates should not be taken too seriously. More accurate theoretical calculations of the influence of the fundamental constants on the parameters of the neutron resonances are required.
On the other hand, Oklo is the only place on Earth where the variability of nuclear constants (if any) could be detected. For this reason it would be very interesting to cary out special measurements in order to improve the limit .
However, at present all the available data support the conventional view, according to which the values of constants have not changed since the “Big Bang”. How could then the “Large Numbers” coincidences be explained? Zel’dovich [28] has noted that within modern quantum field theory, spontaneous topology change can readily give rise to large numbers which are comparable to those considered by Dirac. An alternative answer is suggested by the so-called “anthropic principle” [29, 30, 31] which states that only those universes can ever become observable where the “observers” can survive. The very possibility of life appears remarkably sensitive to the numerical values of physical constants. Following this line of argument all “Large Numbers” can be derived without any appeal to the variation of constants.
It was a great honor for me to win the international competition of young scientists in 1979 and to be invited to ATOMKI. I would like to express here my deep gratitude to V.A.Nazarenko and Yu.V.Petrov for their interest and support.
| Isotopes of Nd | 142 | 143+144 | 145+146 | 148 | 150 |
|---|---|---|---|---|---|
| Natural conentration, % | 27.11 | 36.02 | 25.52 | 5.73 | 5.62 |
| Fission of , % | 0 | 55.18 | 33.53 | 8.16 | 3.13 |
| Oklo samples, % | 0 | 54.95 | 33.46 | 8.25 | 3.34 |
| Interaction | Dyson, Davies [1, 22] | Present work |
|---|---|---|
| strong, | ||
| electromagnetic, | ||
| weak, |
| Nuclide | , b | , b | ||||
|---|---|---|---|---|---|---|
| 5.5 | 0.01 | |||||
| 73 16 | 35 | 0.09 | ||||
| 4.8 0.9 | 2.6 | 0.33 | ||||
| 108 18 | 50 | 0.07 | ||||
| 0.02 |
References
- [1] F.J.Dyson, The fundamental constants and their time variation, in: Aspects of Quantum Theory, Ed. A. Salam and E.P.Wigner, Cambridge Univ. Press, p. 213 (1972).
- [2] E.A.Milne, Relativity, Gravitation and World Structure, Oxford, Clarendon Press, p. 292 (1935).
- [3] P.A.M.Dirac, a) The Cosmological Constants, Nature, v. 139, p. 323 (1937); b) A New Basis for Cosmology, Proc. Roy. Soc., vol. A165, p. 199 (1938).
- [4] E.Teller, On the change of physical constants, Phys.Rev., vol. 13, p. 801 (1948)
- [5] G. Gamow, a) Electricity, Gravity and Cosmology, Phys. Rev. Lett., vol. 19, p. 759 (1967); b) Variability of Elementary Charge and Quasistellar Objects, ibid, p. 913.
- [6] J.D.Barrow, A cosmological limit on the possible variation of G, Mon. Not. R. Astr. Soc., vol. 184, p. 677 (1978).
- [7] T.C.Van Flandern, Is the gravitational constant changing?, Astrophys.J., vol. 248, p. 813 (1981).
- [8] A.D.Tubbs and A.M.Wolfe, Evidence for large-scale uniformity of physical laws, Astrophysical J. (Lett.), vol. 236, p. L105 (1980).
- [9] A.I.Shlyakhter, Direct test of the constancy of the fundamental nuclear constants using the Oklo natural reactor, Preprint of LNPI-260, (September, 1976); b) Nature, vol. 260, p. 340, (November 25, 1976).
- [10] A.Bohr and B.Mottelson, Nuclear Structure, vol. 1, N.Y., 1969 (Russian transl., “Mir”, 1971).
- [11] I.S.Shapiro, Parity-violating nuclear forces, Usp.Fiz.Nauk, vol.95, p.647 (1968).
- [12] R.J.Blin-Stoyle, Fundamental interactions and the nucleus, Amsterdam-New York, 1973 (Russian transl. “Mir”, 1976).
- [13] P.K.Kuroda, On the nuclear physical stability of the uranium minerals, J.Chem.Phys., vol. 25, p. 781, 1295 (1956), see also ref. [14], p. 479.
- [14] The Oklo Phenomenon, Vienna, IAEA, 1975.
- [15] Natural Fission Reactors, Vienna, IAEA, 1978.
- [16] M.Maurette, Fossil Nuclear Reactors, Ann.Rev.Nucl.Sci., vol. 26, p. 319 (1976).
- [17] G.A.Cowan, A natural fission reactor, Sci.American, vol. 235, p. 36 (July 1976).
- [18] Yu.V.Petrov, The Oklo natural nuclear reactor, Usp.Fiz.Nauk, vol. 123, p. 473 (1977); (Engl. transl.: Sov. Phys. Usp., vol. 20, p. 937 (1978)).
- [19] Yu.A.Shukolyukov, Fission - products of the heavy elements of the Earth, M., Energoizdat, 1982.
- [20] J.C.Ruffenach et al., Chemical and isotope studies of uranium, lead and several fission-products in ore sample from Oklo fossil reactor, Earth Planet Sc. Lett., vol. 30, p. 94 (1976).
- [21] Yu.V.Petrov and A.I.Shlyakhter, The distribution of thermal neutron cross sections, a) Preprint LNPI-456 (January, 1979), b) Nucl.Sci.Eng., vol. 77, p. 157 (1981).
- [22] P.C.W.Davies, Time variation of the coupling constants, J.Phys.A., vol.5, p.1296 (1972).
- [23] A.I.Shlyakhter, Calculation of neutron cross sections for isomeric nuclei, Thesis, LNPI, 1979.
- [24] V.P.Chechev and Ya.M.Kramarovsky, Raioactivity and the evolution of the Universe, M., “Nauka”, 1978.
- [25] F.J.Dyson, Variation of constants, in Current trends in the theory of fields, ed. by J.E.Lanutti and P.K.Williams, Amer.Inst. of Physics, N.Y., 1978, p. 163.
- [26] F.J.Dyson, Time without end: physics and biology in an open Universe, Rev.Mod.Phys., vol. 51, p. 447 (1979).
- [27] B.Bertotti, Status of experimental gravitation, in: Recent Developments in Gravitation, ed. by M.Levy and S.Deser (N.Y., 1979). I must note that my results (ref. [9]) are used in this paper without the customary acknowledgement of the source.
- [28] Ya. B. Zel’dovich, The gravitation, charges, cosmology and coherence, Usp. Fiz. Nauk, vol. 123, p. 487 (1977), (Engl. transl. Sov. Phys. Usp., vol. 20, p. 945 (1978)).
- [29] R.H.Dicke, Dirac’s cosmology and Mach’s principle, Nature, vol. 192, p. 440 (November 4, 1961).
- [30] B.Carter, Large number coincidences and the anthropic principle in cosmology, in: Confrontation of Cosmological Theories with the Observational Data, ed. by M.S.Longair, p. 291 (1974).
- [31] B.J.Carr and M.J.Rees, The anthropic principle and the structure of the physical world, Nature, vol. 278, p. 605, (1979).