Observation of diffractive orbits in the spectrum of excited NO in a magnetic field
Abstract
We investigate the experimental spectrum of excited NO molecules in the diamagnetic regime and develop a quantitative semiclassical framework to account for the results. We show the dynamics can be interpreted in terms of classical orbits provided that in addition to the geometric orbits, diffractive effects are appropriately taken into account. We also show how individual orbits can be extracted from the experimental signal and use this procedure to reveal the first experimental manifestation of inelastic diffractive orbits.
pacs:
32.60.+i 03.65.Sq 32.55.Be 05.45.MtPeriodic orbit (PO) theory gutzwiller90 has been a very successful quantitative and qualitative tool in the analysis of systems displaying strong quantum fluctuations. In particular, the complex photoabsorption spectrum of excited hydrogen atoms in a static magnetic field was interpreted within closed orbit theory (COT) in terms of periodic orbits closed at the nucleus du delos88 . However standard PO theory was shown to be insufficient for systems containing a scatterer smaller or comparable to one de Broglie wavelength, because the PO’s may hit the scatterer, thereby producing diffractive orbits vattay . In certain mesoscopic devices diffractive orbits crucially influence the spectrum heller99 , whereas in non-hydrogenic Rydberg atoms in static fields the atomic core acts as a scatterer producing combination orbits dando etal95 . This was experimentally observed in the photoabsorption spectrum of helium, which departs slightly from the hydrogenic case karremans etal 1998 . In the case of Rydberg molecules, core effects are expected to be more important: the reason is that the diffractive scatterer has an internal structure (the quantum states of the molecular core). Indeed, model calculations recently predicted that Rydberg molecules in external fields would display a novel type of diffractive orbit produced by inelastic scattering of the PO’s on the core matzkin etal2002 .
In this work, we address this problem by investigating the experimental spectrum of excited NO molecules in a magnetic field. We show the apparently complex spectrum can be well understood in terms of closed orbits provided molecular core effects are appropriately taken into account; in particular, we shall see COT calculations correctly reproduce the Fourier transform of the experimental spectrum, in a regime in which quantum calculations have yet to be undertaken. We will also demonstrate how individual orbits may be extracted from the experimental results by using a modified Fourier tranform, and use this technique to show the first experimental manifestation of an inelastic diffractive orbit in a physical system.
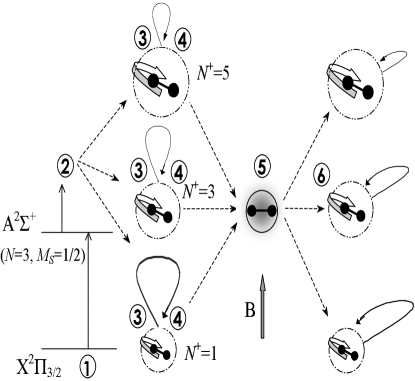
Most previous studies of atoms in a magnetic field have relied on scaled-energy spectroscopy, in which the field is varied with the Rydberg electron energy so as to keep the scaled energy constant, with T. Then the classical motion is unchanged at each point of the spectrum and each orbit contributes as a peak in the Fourier transformed (FT) spectrum. However, such a scaling law does not hold, albeit approximately, for molecules. We have therefore observed the Rydberg states of NO at a constant magnetic field of 0.93 T, varying the excitation energy of the probe laser. The experiment, carried out in a ”magnetic bottle” time of flight spectrometer, was described elsewhere gauyacq , but in short: a 2-photon highly selective transition with a pump laser brings the molecule from the ground state (in the vibrational level ) into the single rotational Zeeman sublevel of the first electronic excited state ; is the total angular momentum exclusive of spin and the constant spin number will henceforth be disregarded. The sublevels to (where is the projection of on the field axis) were not resolved but their relative population is known. In a second step, the probe laser, linearly polarized parallel to the field axis, excites the molecules to high-lying Rydberg states having also (so we can neglect vibrational couplings).
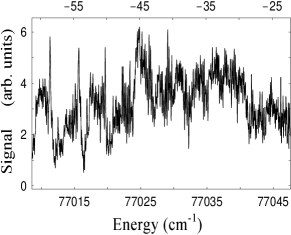
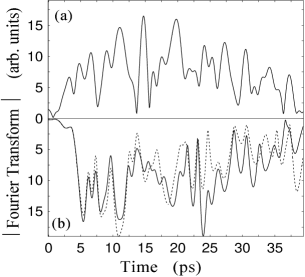
These excited states are further ionized via vibrational autoionization into the ground state of the NO+ core. The resulting spectrum, which lies higher in energy than those previously published in gauyacq (in which nonperturbative diamagnetic effects could be neglected), is shown in Fig. 1. The FT of the experimental spectrum is shown in Fig 2(a), whereas Fig. 2(b) displays the semiclassical calculations which will be detailed below. Unlike a spectrum taken at constant we do not expect in the present case to correlate each peak with a single orbit, because the period of an orbit changes with the energy. Before turning to the extraction of individual orbits, we detail the mechanism giving rise to the peaks in the FT spectrum.
| 1 | 3 | 5 | |
|---|---|---|---|
Since in the state the orbital momentum of the Rydberg electron is a mixture of both and , the probe laser excites to final states having and . Photo-excitation takes place in the molecular frame (in which the Rydberg electron is coupled to the molecular core), but following excitation the electron uncouples from the core and is no longer conserved, although its projection is monteiro taylor90 . The molecule is then described as an electron orbiting around the molecular core NO+ in well-defined rotational states or For each core configuration, the electron’s wavefunction is propagated semiclassically along classical trajectories (see Fig. 3). The energy of the Rydberg electron is obtained from the energy partition
| (1) |
where is the rotational constant of NO+. Disregarding the linear Zeeman shift, we have three main dynamical regimes for the Rydberg electron, each associated with a different rotational core state. Table I gives, for each value of the scaled energy ranges corresponding to the experimental spectrum.
At each energy some of the trajectories are turned back by the field and return to the core; those trajectories are the geometric closed orbits. Their contribution to the oscillator strength is given by raoult etal2003
| (2) |
and are 3-dimensional quantities respectively linked to the 2-dimensional classical amplitude and action of the th closed orbit GD92 ( includes the Maslov index ); those quantities depend on the energy of the Rydberg electron, i.e. on the core state and on the excitation energy. is a quantity depending on the dipole transition factor from the to the excited states, and on the transformation elements from the coupled to the uncoupled frame; some values are given in Table I.
When the semiclassical wavefunction carried by the geometric closed orbits returns to the core, it diffracts on the scatterer (Fig. 3). This diffraction process, produces newly outgoing trajectories which eventually return to the core; the resulting diffractive contribution to is given by
| (3) |
acts as a global diffraction coefficient; unlike diffraction in quantum billiards vattay ; heller99 , does not depend here on the local geometry of the scatterer but solely on the quantum properties of the core (i.e. on the core-induced phase-shifts, known as molecular quantum defects; the value of the 6 independent quantum defects for NO is given in gauyacq ). The matching between the semiclassical waves and the core wavefunction takes place in the stationary phase approximation. The oscillator strength contains both elastic ( and inelastic ( diffractive terms. In the one core-scatter approximation, the total contribution to the fluctuations in the oscillator strength is obtained by summing the imaginary parts of Eqs. (2) and (3).
The experimental or semiclassically calculated FT spectra are respectively obtained by Fourier transforming the photoelectron signal or the oscillator strength for which we shall use the same notation , hence
| (4) |
where and we set the energy variable relative to the ionization threshold as . The semiclassical calculations were undertaken by applying Eqs. (2) and (3). Since at each point of the spectrum the orbits and therefore their amplitude and action change, we have determined the classical quantities , on an energy grid for the primitive closed orbits and their repetitions, keeping track of bifurcations as the energy increases. We then interpolated those functions so as to obtain classical quantities varying with the energy. This procedure, which is tractable for short orbits provided the scaled energy is not too high, yields a good agreement with the experimental FT spectrum, as seen on Fig. 2(b). The semiclassical calculations allow to single out contributions from the ensemble of geometric or diffractive orbits associated with given core states. Full details will be given elsewhere raoult etal2003 .
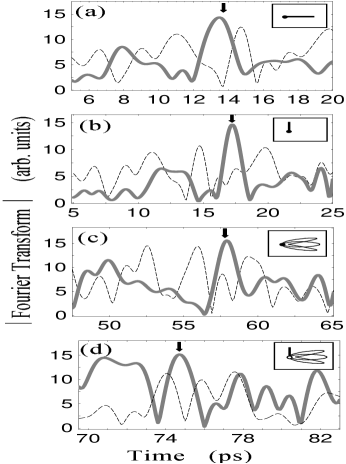
Eq. (4) is also at the basis of the extraction of individual orbits from the experimental spectrum provided is appropriately modified so as to counterbalance the varying values of the classical quantites. Indeed in the neighborhood of some energy a classical orbit contributes locally as a sinusoidal oscillation of period . But as the energy is varied, the classical motion changes, turning the sinusoidal oscillation into a chirped modulation. It has been shown very recently delos cft2002 that a chirped Fourier Transform (CFT) converts a chirp modulation into a sine oscillation, thus giving a sharp peak in the FT spectrum. A CFT is defined by setting in Eq. (4). and are numerical coefficients and is a function, which depend on the orbit to be extracted: to extract an orbit at some energy we Taylor expand the action . To first order, we have i.e. the period of the orbit. Therefore by setting and in the CFT exponent we can expect to effectively linearize the signal around so that the CFT yields a peak at . The peak can be enhanced by using a function to compensate for the signal amplitude variation; we have used the inverse of our interpolated functions . As discussed in great details in delos cft2002 , spurious peaks inevitably appear in the CFT spectrum. We proceed in the following manner: using purely classical calculations, we compute on the one hand the CFT of the experimental signal with the relevant parameters and and on the other hand we determine the period ; the consistency of the procedure is ensured by the appearance of a peak at the computed value when the orbit is succesfully extracted from the signal. An illustration of the extraction procedure is given in Fig. 4. For a fixed energy we extract one CO associated with each core state (panels (a)-(c)). Panel (d) shows the extraction of the diffractive CO formed by the combination of the orbits extracted in (b) and (c).
In summary, we have investigated the experimental spectrum of NO in the diamagnetic regime and interpreted the results in terms of geometric and diffractive classical orbits, and we have shown how individual orbits can be extracted from the experimental signal.
References
- (1) M. C. Gutzwiller, Chaos in classical and quantum mechanics (Springer, New-York, 1990).
- (2) M. L. Du and J. B. Delos, Phys. Rev. A 38, 1913 (1988).
- (3) G. Vattay, A. Wirzba and P.E Rosenqvist, Phys. Rev. Lett. 73, 2304 (1994).
- (4) J. S. Hersch, M. R. Haggerty, and E. J. Heller, Phys. Rev. Lett. 83, 5342 (1999).
- (5) P. A. Dando, T. S. Monteiro, D. Delande and K. T. Taylor, Phys. Rev. Lett. 74, 1099 (1995).
- (6) K. Karremans, W. Vassen, and W. Hogervorst, Phys. Rev. Lett. 81, 4843 (1998).
- (7) A. Matzkin, P. A. Dando, and T. S. Monteiro, Phys. Rev. A 66, 013410 (2002).
- (8) D. Gauyacq, M. Raoult and N. Shafizadeh, in C. Sandorfy (Ed.), The Role of Rydberg States in Spectroscopy and Photochemistry (Kluwer, Dordrecht, 2002); M. Raoult, S. Guizard and D. Gauyacq, J. Chem. Phys. 94, 7046 (1991).
- (9) M. Raoult, D. Gauyacq, S. Guizard and A. Matzkin, in preparation.
- (10) T. S. Monteiro and K. T. Taylor, J. Phys. B 23, 427 (1990).
- (11) J. Gao, J.B. Delos, and M. Baruch, Phys. Rev. A 46, 1449 (1992).
- (12) H. Friedrich and D. Wintgen, Phys. Rep. 183, 37 (1989).
- (13) S. Freund, R. Ubert, E. Flöthmann, K. Welge, D. M. Wang and J. B. Delos Phys. Rev. A 65, 053408 (2002).
- (14) J. Main, Phys. Rep. 316, 233 (1999).
- (15) J. M. Mao and J. B. Delos Phys. Rev. A 45, 1746 (1992).