Evidence for growth of microbial genomes by short segmental duplications
Li-Ching Hsieh∗, Liaofu Luo∥ and H.C. Lee∗222Correspondence and requests for material should be addressed to HCL at Physics, NCU; hclee@phy.ncu.edu.tw.§
∗Department of Physics and †Department of Life Science, National Central University, Chungli, Taiwan 320; ∥Department of Physics, Inner Mongolia University, Hohot, China; §Centre de Recherches Mathématiques, Université de Montréal, Montréal, QC, Canada
We show that textual analysis of microbial genomes reveal telling footprints of the early evolution of the genomes. The frequencies of word occurrence of random DNA sequences considered as texts in their four nucleotides are expected to obey Poisson distributions. It is noticed that for words less than nine letters the average width of the distributions for complete microbial genomes is many times that of a Poisson distribution. We interpret this phenomenon as follows: the genome is a large system that possesses the statistical characteristics of a much smaller “random” system, and certain textual statistical properties of genomes we now see are remnants of those of their ancestral genomes, which were much shorter than the genomes are now. This interpretation suggests a simple biologically plausible model for the growth of genomes: the genome first grows randomly to an initial length of approximately one thousand nucleotides (1k nt), or about one thousandth of its final length, thereafter mainly grows by random segmental duplication. We show that using duplicated segments averaging around 25 nt, the model sequences generated possess statistical properties characteristic of present day genomes. Both the initial length and the duplicated segment length support an RNA world at the time duplication began. Random segmental duplication would greatly enhance the ability of a genome to use its hard-to-acquire codes repeatedly, and a genome that practiced it would have evolved enormously faster than those that did not.
The genome is a highly complex network of embedded codes generated in a very long process of evolution co-driven by chance mutations and misreplications on the one hand and natural selection on the other. The fact that both processes are stochastic makes it that much harder to uncover what the the earliest genome looked like when life first arose. Adding the extreme diversity of organisms to the complexity of each genome would seemingly render the task of unmasking the early genome even more daunting. It is therefore significant when a large set of diverse and complex genomes share an unexpected common or universal property. Here we report one kind of universality in the textual property of the genomes that allows us to deduce a mode of growth which could be common to all early genomes.
Frequency of occurrence of oligonucleotides in microbial genomes
It is a general rule of statistics that very large systems have sharply defined average properties. When apples are randomly dropped into barrels, the distribution of apples in the barrels is governed by the Poisson distribution. If 1,024 apples were dropped into sixty-four barrels, in 95 of 100 cases, each barrel will have between eight and twenty-four apples. In comparison, if 1 million apples were dropped into sixty-four barrels, in 95 of 100 cases, each barrel will have between 15,875 and 15,375 apples. There is a less than one in (, respectively) chance that one barrel would get as many (few) as twenty-four (eight) thousand apples.
Microbial genomes are seemingly random systems when viewed as texts of the four nucleotides represented by A, C, G and T. To count the number of times each of the sixty-four trinucleotides, or 3-mers, occur in a genome-as-text is similar to counting apples in barrels. The genome of the bacterium Treponema pallidum, the causative agent of syphilis is about 1M base pairs long and has almost even base composition [1]. In an astonishing departure from what is expected of a system of its size, the genome has six 3-mers (CGC, GCG, AAA, TTT, GCA, TGC) occurring more than 24,000 times per 1M nt and two (CTA, TAG) less than 8,000 times. Scrambling the genome sequence thoroughly restores it to a random sequence obeying Poisson distribution and the large-system rule.
T. pallidum is not exceptional in disobeying the large-system rule. For the fourteen complete microbial genome sequences with approximately even base composition (see Methods), the observed standard deviation (s.d.) of the distribution of the frequency of occurrence (hereafter, simply distribution) of 3-mers per 1M nt is 4,080630 around the mean of 15,625. This is about 32 times the s.d. of a Poisson distribution typifying a random sequence with the same mean.
Nor is the 3-mer exceptional in the -mer-statistics of genomic sequences. In Table 1, column 3 gives the average s.d. of the distribution of -mers per 1M nt, = 2 to 10, for the fourteen genomic sequences and the s.d. of the average (number given after the sign) and column 4 gives the s.d. for a Poisson distribution (that describes a random sequence) with mean value 106/4k. The s.d.’s of the genomic and random sequence have about the same magnitude when is equal to or greater than 10 (not shown in the Table). But with decreasing values of the Poisson s.d. increases as whereas the genomic s.d. increases at a much higher rate, such that for the Poisson s.d. is many times less than the genomic s.d. Moreover, the uncertainty in the genomic s.d. is typically much smaller than the difference between the genomic and Poisson s.d.’s. For example, at =2 (=6) the genomic s.d. is 408 (9.01.3) times greater than the Poisson s.d. Thus the genomic distribution differs from the Poisson distribution in a universal fashion, and in this sense we shall speak of a universal genome.
| T. pal | Genomic | Poisson | Present | ||
|---|---|---|---|---|---|
| average | model | (in k nt) | |||
| 2 | 8227 | 10580 | 250 | 8207 | .65 |
| 3 | 3977 | 4080 | 125 | 3415 | 1.0 |
| 4 | 1384 | 1490 | 62.5 | 1202 | 1.9 |
| 5 | 434 | 469 | 31.2 | 402 | 4.7 |
| 6 | 129 | 141 | 15.6 | 134 | 13 |
| 7 | 37.5 | 41.9 | 7.8 | 45.3 | 37 |
| 8 | 11.0 | 12.4 | 3.9 | 15.9 | 110 |
| 9 | 3.4 | 3.840.84 | 1.9 | 5.9 | 300 |
| 10 | 1.3 | 1.330.34 | 1.0 | 2.3 | 640 |
Microbial genomes are large systems with small-system statistics
The universal genome has the statistical property of a random sequence much smaller than itself. To see this, we define the effective random-sequence length of the universal genome as the length of a random sequence that has a -mer distribution with a mean to s.d. ratio equal to that of the corresponding genomic ratio . Then =, and its values for the various ’s are given in the last column of Table 1. One notices that the of the universal genome is very short for the smaller ’s - of the order of 1k nt for 3 - and grows with . When =10, it is essentially the same length as the real genome.
A signature of the universal genome is that compared to a random sequence, the former has very large numbers of both overrepresented and underrepresented oligonucleotides. As a typical representative of the universal genome, the genome of E. coli [2] has 500 and 510 6-mers whose frequency of occurrences are greater than 400 and 100 per 1M nt, respectively, while a random sequence has none in either category. There are many known examples of individual oligonucleotide that exhibit extreme relative abundance. For dinucleotides this was noted to be common and has genome-wide consistency [3]; tetra- and hexapalindromes are almost always underrepresented in bacteriophages and are underrepresented systematically in bacteria where 4-cutting and/or 6-cutting restriction enzymes are common [4]; an 8-mer that appears as Chi sites, hotspots of homologous recombination, is highly overrepresented in E. coli [5]; in the human pathogens Haemophilus influenzae [6, 7] and Neisseria [8] there are 9- and 10-mers functioning as uptake signal sequences that are vastly overrepresented. The causes for these extreme cases are generally not known and, with the exception of the dinucleotides, these individual cases do not much affect the statistical properties of the genome.
What caused a genome to have statistical characteristics so starkly distinct from those of a random sequence? Natural selection suggests itself as a prime explanatory candidate. For instance, the 64 frequencies of codons, 3-mers used by the genome to code proteins in genes, exhibit very wide distributions. But natural selection by itself does not directly cause any change in a genome. Such changes are caused by mutation and other mechanisms, all believed to occur at random. Natural selection may account for what changes come to pass; if, however, such changes always tend to promote or retain a randomness that exhibits Poisson distribution, then the ability of natural selection to push the genome very far in a non-Poisson direction would seem to have its limits.
Model for early genome growth
Here we propose a biologically plausible model for the growth and evolution of a universal genome that can generate the observed statistical characteristics of genomic sequences. The model is very simple and consists of two phases. In the first phase the genome initially grows to a random sequence whose size is much smaller than the final size of the genome. In the second phase the genome grows by random duplications modulated by random single mutations. In this work a snapshot is taken of the model genome shortly after it reaches a length of 1M nt. The key in the model is growth by duplication; it is most straightforward way for the universal genome to become what it appears to be: a large system that exhibits small-system statistical characteristics.
We found it comparatively easy to generate a sequence that could faithfully reproduce the genomic -mer distribution of a particular but not those of other ’s. Typically such a sequence had an excessively rigid effective random-sequence length and, consequently, a distribution too narrow (broad) for smaller (greater) ’s. Several such examples are given in the Methods. Generating a sequence that would emulate a real genome was a much more exacting task.
Result
After extensive experimentation, it was found that sequences having the statistical characteristics sought after could be generated from an initial random sequence approximately 1k nt long () which was then grown to 1M nt by random duplication of segments of length () averaging 25 nt with a spread () of approximately 11 nt (see Methods for detail).
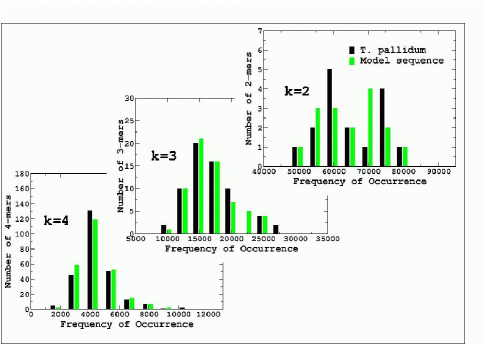
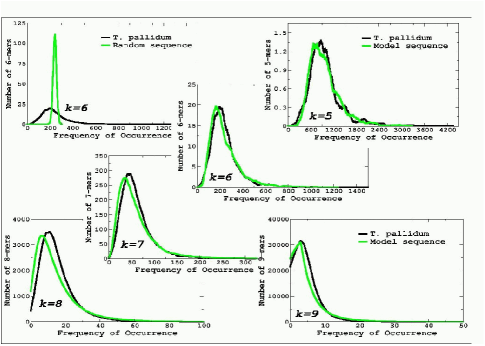
The s.d. of the -mer distribution of a good model sequence are given in column five of Table 1. They agree quite well with the observed genomic values in columns two and three although their -dependence is slightly too strong. Histograms in Fig. 1 show comparisons between the -mer distributions for =2, 3 and 4 of the genome of T. pallidum (black) and those of the model sequence (green/gray). In all three cases, the histogram for a random sequence would be represented by a single tower located at the mean frequency. For =2 and to a lesser extent =3, the histograms for both genomic and model sequences display large fluctuations. The model sequence is not expected to exactly reproduce the counts of the genomic sequence. Indeed, generated stochastically, another (good) model sequence would give distributions indistinguishable from those shown in Fig. 2 but something rather different than those shown in the =2 and 3 panels of Fig. 1. In any case, all model sequences would show patterns of fluctuation similar to those exhibited by the genomic sequence and have s.d.’s similar to those given in column 5 of Table 1. Fig. 2 shows comparisons for =5 to 9. The panel at the top-left corner compares the 6-mer distribution from T. pallidum with that of a random sequence obtained by scrambling the T. pallidum genome. The strong agreement between the microbial genome and the model sequence contrasts sharply with the glaring differences between the genome and the random sequence.
The model sequence is parameter-sensitive: If was much longer than 1k nt no good model sequence could be found (this is expected because cannot be much longer than the shortest in Table 1); if either or was was changed by more than 10% from their optimal values of 25 nt and 11 nt respectively the agreement between the genomic and model sequences would worsen noticeably (see Methods). No mutations were imposed on the model sequence whose properties are shown here; twenty thousand mutation fixations reduces the s.d. of the -mer distributions of the model sequence by 4% (for =2) to 10% (=10) but under casual inspection the model sequence - with or without mutation - has the appearance of a random sequence. Results showing the model reproducing the -mer distributions of microbial genomes with highly biased compositions will be presented elsewhere.
In bacterial genomes, typically about 12% of genes represent recent duplication events - 12% in T. pallidum [1], 11.2% in H. influenzae [9] and 12.8% in V. cholerae [10]. Our model sequence as presented here does not yet fully explain the pattern of all such duplications, many of which would involve segments up to several k nt long. Work is under way to extend the model to account for the genomic pattern of repeat sequences of all lengths.
Discussion
We mention some biological and evolutionary implications assuming our model does capture the essence of the early growth mechanism of microbial genomes and, by extension, perhaps of all genomes. Setting the initial length of our model universal genome before it began the growth by duplication process to about 1k nt but not much longer (as required by observed data) necessarily implies that the universal genome began its life in an RNA world [11, 12] in which there were no proteins and RNAs had the dual roles of genotype and phenotype (see [13] for a review). This view of the origin of life [14, 15, 16] gained much credence when RNA was discovered to exhibit self-splicing and enzymatic activities [17, 18]. Some RNA enzymes, or ribozymes, are very small; the hammerhead ribozyme is only 31 to 42 nt long [19] and the hairpin ribozyme is only 50 nt long [20]. Thus the 1k nt initial universal genome was certainly of sufficient size to possess a machinery for sustained evolution and duplication. Our model does not address the origin of this initial genome. The likelihood of its being the evolutionary product of something that arose spontaneously is enhanced by the succcessful isolation of artificial ribozymes from pools of random RNA sequences [21]. The average duplicated segment length of 25 nt is very short compared to a present-day gene that codes for a protein, but likely represents a good portion of the length of a typical ribozyme encoded in the early universal genome.
Shifting the burden away from natural selection onto segmental duplication as the main force driving the universal genomes so far in a non-Poisson direction implies a much higher evolution rate than it might have been if natural selection were the only driving force. The model suggests that uneven codon usage was not the primary cause of the very broad distribution of the 3-mer counts seen in the universal genomes. Rather, the rise of codon was the consequence of an opportunistic evolutionary adaptation to the already-wide 3-mer distribution that had resulted from growth by duplication. Similarly, many - but not all - of the highly under- or overrepresented oligonucleotides we see now must have been recruited for their respective biological functions after they already had (the suitable beginnings of) biased frequencies of occurrence.
That some statistical characteristics of a present day genome are determined by the charateristics of the genome when it first began to grow by duplication means that we should be able to learn something about such early genomes, and each such ancestral genome should be common to a group of present day genomes that are phylogentically close. Detailed analyses made along this line of reasoning may bring us a step nearer in understanding the univeral ancestor [22].
Being a natural way to repeatedly utilize hard-to-come-by codes, growth by duplication is in itself a brilliant strategy and must have increased the rates of evolution and species diversion enormously. The continuity of this strategy after the rise of codons and proteins is bundantly in evidence. In higher organisms a large number of repeat sequences with lengths ranging from 1 base to many kilobases are believed to have resulted from at least five modes of duplication [23, 24]. This strategy should provide part of the answer to the questions [25]: how have genes been duplicated at the high rate of about 1% per gene per million years [26]? and why are there so many duplicate genes in all life forms [27, 28]? The fact that duplicate genes (after they have diverged) contribute to genetic robustness by protecting the genome against harmful mutations [29] is likely not what caused the proliferation of duplicate genes, but is rather another example of an adaptation to an existing situation by natural selection for a beneficial function.
Methods
The fourteen microbial genome sequences (length () in M nt and G+C probability () in brackets) E. coli K12 (4.64, .50), E. coli 0157 (5.52, .50), M. thermoautotrophicum (1.75, .50), A. fulgidus (2.18, .49), T. pallidum (1.14, .53), X. fastidiosa (2.67, 0.53), V. cholerae chromosomes I (2.96, .48) and II (1.07, .47), Synechococcus sp. (3.57, .48), N. meningitidis serogroup B strain MC58 (1.57, .52), Y. pestis (4.65, .48), S. typhimurium (4.86, .52), S. enterica (4.81, .52) and P. aerophilum (2.22, .51) are obtained from the GenBank [30]. Counting of -mers is done by reading through a -base wide window that is slid around the (circular) genome once. Counts are normalized to per 1M nt and bias in base composition is corrected for by dividing the actual counts by the factor , where is the total number of G’s and C’s in each -mer.
Generation of model sequence. A random sequence of length is first generated. Thereafter the sequence is altered by single mutations (replacements only) and duplications, with a fixed average mutation to duplication event ratio. In duplication events, a segment of length , chosen according to the Erlang probability density function , is copied from one site and pasted onto another site, both randomly selected. In the above is an integer and is a length scale in bases. The function gives a mean duplicated segment length with s.d. . The values to 8 and selected values for from 3 to 15,000 were used. The model sequence compared with genomic sequences in the Figures 1 and 2 and in Table 1 was generated with , , and without mutation events. Fine-tuning to find the best parameters was not attempted. The following are some examples that gave very good distributions for specific -mers but not generally; all were generated with and : for 6-mer, and on average 0.04 mutations per duplication (these parameters also work for genomes with biased base compositions) [31]; for 2-mer, , no mutation; for 5-mer, , no mutation; for 9-mer, , no mutation.
Presentation of data. In Fig. 2 the curves shown are the result of a small amount of forward and backward averaging - to remove excessive fluctuations. In Fig. 1 data bunching was used to produce the towers shown.
HCL thanks the National Science Council (ROC) for the grant NSC 91-2119-M-008-012 and members of the Redfield Lab and the Otto Lab, Department of Zoology, University of British Columbia, for discussion and the Institute for Theoretical Physics, Chinese Academy of Science, Beijing, and the Center for Theoretical Biology, Beijing University, for hosting visits.
- 1. C.M. Fraser et al., Complete genome sequence of Treponema pallidum, the syphilis spirochete. Science 281 (1998) 375-388.
- 2. F. R. Blattner, et al., Science 277 (1997) 1453.
- 3. S. Karlin and C. Burge, Dinucleotide relative abundance extremes: a genomic signature. Trends in Genetics 11 (1995) 283-290.
- 4. S. Karlin et al., Statistical analyses of counts and distributions of restriction sites in DNA sequences. Nucl. Acids Res. 20 (1992) 1363-1370.
- 5. T. Colbert, A.F. Taylor and G.R. Smith, Genomics, Chi sites and codons: ’islands of preferred DNA pairing’ are oceans of ORFs. Trends in Genetics 14 (1998) 485-488.
- 6. H.O. Smith et al., Frequency and distribution of DNA uptake signal sequences in the Haemophilus influenzae Rd genome. Science 269 (1995) 538-540.
- 7. S. Karlin, J. Mrazek and M. Campbell, Frequent oligonucleotides and peptides of the Haemophilus influenzae genome. Nucl. Acid Res. 24 (1996) 42634272.
- 8. H.O. Smith et al., DNA uptake signal sequence in naturally transformable bacteria. Res. Microbiol. 150 (1999) 603-616.
- 9. Arabidopsis Genome Initiative, Analysis of the genome sequence of the flowering plant Arabidopsis thaliana. Nature 408 (2000) 796-815.
- 10. J.F. Heidelberg, et al., DNA sequence of both chromosomes of the cholera pathogen Vibrio cholerae. Nature 406 (2000) 477-483.
- 11. W. Gilbert, The RNA world, Nature 319 (1986) 618.
- 12. J. E. Darnell and W. F. Doolittle, Speculations on the early course of evolution, Proc. Natl. Acad. Sci. USA 83 (1986) 1271-1275.
- 13. G. F. Joyce, The antiquity of RNA-based evolution, Nature 418 (2002) 214-221.
- 14. C. Woese, The Genetic Code, (Harper & Row, New York, 1967) 179-195.
- 15. F. H. C. Crick, The origin of the genetic code. J. Mol. Bio. 38 (1968) 367-379.
- 16. L. E. Orgel, Evolution of the genetic apparatus, J. Mol. Bio. 38 (1968) 381-393.
- 17. T. R. Cech, A. J. Zaug, and P. J. Grabowski, In vitro splicing of the ribosomal RNA precursor of Tetrahymena: Involvement of a guanosine nucleotide in the excision of the intervening sequence, Cell 27 (1981) 487-496.
- 18. The RNA moiety of RNAase P is the catalytic subunit of the enzyme, C. Guerrier-Takada, et al., Cell 35 (1983) 849-857.
- 19. Forster AC, Symons RH. Self-cleavage of plus and minus RNAs of a virusoid and a structural model for the active sites, Cell 49 (1987) 211-220.
- 20. A. Hampel and R. R. Tritz, RNA catalytic properties of the minimum (-)sTRSV sequences, Biochemistry 28 (1989) 4929-4933.
- 21. E.H. Ekland, J.W. Szostak and D.P. Bartel, Structurally complex and highly active RNA ligases derived from random RNA sequences, Science 269 (1995) 364-370.
- 22. C. Woese, The universal ancestor, Proc. Natl. Acad. Sci. USA 95 (1998) 6854-6859.
- 23. E. S. Lander, et al., Initial sequencing and analysis of the human genome, Nature 409 (2001) 860.
- 24. J. C. Venter, et al., The sequence of the human genome, Science 291 (2001) 1304.
- 25. A. Meyer Duplication, duplication, Nature 421 (2003) 31-32.
- 26. M. Lynch and L. C. Conery, The evolutionary fate and consequences of duplicate genes, Science 290 (2000) 1151-1155.
- 27. J.Maynard-Smith, Evolution Genetics, (Oxford University Press, 1998).
- 28. S. Otto and P. Yong, The evolution of gene duplicates. Adn. Genetics 46 (2001) 451-483.
- 29. Role of duplicate genes in genetic robustness against null mutations, Z. Gu, et al., Nature 421, 63-66 (2003).
- 30. GenBank: www.ncbi.nlm.nih.gov/PMGifs/Genomes/micr.html.
- 31. L.C. Hsieh, Liaofu Luo, Fengmin Ji and H.C. Lee, Minimal model for genome evolution and growth, Phys. Rev. Lett. 90 (2003) 018101.