Spectral Statistics of RR Intervals in ECG
Mladen MARTINIS, Vesna MIKUTA-MARTINIS, Andrea KNEŽEVIĆ, and Josip ČRNUGELJ
Division of Theoretical Physics
Rudjer Bošković
Institute, Zagreb, Croatia
The statistical properties (fluctuations) of heartbeat intervals (RR intervals) in ECG are studied and compared with the predictions of Random Matrix Theory (RMT). It is found that heartbeat intervals only locally exhibit the fluctuation patterns (universality) predicted by the RMT. This finding shows that heartbeat dynamics is of the mixed type where regular and irregular (chaotic) regimes coexist and the Berry-Robnik theory can be applied. It is also observed that the distribution of heartbeat intervals is well described by the one-parameter Brody distribution. The parameter of the Brody distribution is seen to be connected with the dynamical state of the heart.
1 Introduction
The time series of heartbeat intervals (RR intervals), used in various analyses, are usually Holter type data or data from steady state ambulatory measurements. The great wealth of data about the dynamics of the heart that is contained in such ECG records is usually reduced to characterize only the mean heart rate and the presence and frequency of some abnormal electrocardiographic complexes. The analysis of short-range and long-range fluctuations and its universality are largely ignored.1) The normal human heartbeats display considerable variability and nonstationarity over time. The result is that fluctuations of heartbeat intervals around the mean value are irregular and complex, even under resting conditions, Fig. 1. A number of new methods have been proposed to quantify these complex fluctuations, mainly based on the nonlinear and fractal analysis. 2),3),4),5)
In this paper we examine the possibility that the distribution of heartbeat intervals exhibits universality of the type predicted by the RMT. 6)
2 Statistical analysis of heartbeat intervals
The heartbeat time series of an human represents an ordered sequence of R-waves (QRS-complexes) occuring at times . In this form the heartbeat dynamics can be regarded as a fractal stochastic point process on a time-line. The point process is completely described by the set , or equivalently by the set of RR-intervals defined as .
To see the universality in beat-to-beat RR interval fluctuations we need to magnify the heartbeat spectrum so that mean spacing is unity. Let us first determine the number of heartbeats up to time . It is given by the staircase function :
| (1) |
where is the step function.
In order to be able to compare statistical properties of heartbeat spectra, in particular the fluctuations around the mean value, with the predictions of the RMT it is necesary to normalize (unfolde) the time spectrum to in such a way that the mean spacing between neighbouring is unity. This is achieved by the mapping
| (2) |
where denotes the smoothed staircase which account for the mean trend in and is the normalized heartbeat spacing. The ”local” mean spacing is defined as so that becomes
| (3) |
During the real time measurements, we always deal with the finite number of heartbeats, say . In that case, we define the ”global” mean spacing as
| (4) |
so that .
There are two important statistical measures that we shall use to characterize the heartbeat spectra . One is the nearest-neighbor heartbeat spacing distribution which gives the probability to find in the interval (). is a short range statistics, it measures the short range correlations between heartbeats. Its behaviour for small spacing, ,
| (5) |
determines the type of short range correlations between heartbeat intervals. Two cases can be distinguished: a) when meaning that the short range fluctuations of are just those of uncorrelated random numbers, i.e. Poissonian with a well-known phenomenom of attraction (clustering), and b) when meaning that the long range fractal fluctuations are present in the sequence of that is characterized by the phenomenom of repulsion. The universal statistics (no free parameters) predicted by the RMT 6) are given by
| (6) | |||||
The GOE (Gaussian orthogonal ensemble) distribution, known as a Wigner distribution, should be valid for irregular (chaotic) systems with an antiunitary symmetry, whereas GUE (Gaussian Unitarian Ensemble) should apply if the system has no such symmetry.
To avoid the smoothing procedure on a measured data, it is easier and less ambiguous to study the inegrated or the cumulative RR intervals
| (7) |
which yields a useful statistics even for small sample of RR intervals. This gives
| (8) |
and a nonanalytical expression for .
Another important statistics, not considered here, is the spectral rigidity of Dyson and Metha 7) which characterizes the long-range correlations of heartbeats. It can be related to the Hurst exponent 8),9) associated with the heartbeat time series.
3 Results and discussion
Time series of RR intervals were measured at the Institute for Cardiovascular Disease and Rehabilitation in Zagreb. Each masurement of ECG was over a time duration of about 15 min. ( 2000 heartbeats), in a controlled ergometric regime. These type of measurements are used as routine in everyday clinical diagnostic practice, because some heart deseases, such as stable angine pectoris (SAP), usually become transparent under physical activities.
The ECG data were digitized by the WaveBook 512 (Iotech. Cal. USA), and transferred to a computer. The RR interval series was passed through a filter that eliminates noise and artefacts. All R-wave peaks were first edited automatically, after which a careful manual editing was performed by visual inspection of the each RR interval. After this, all questionable portions were excluded manually, and only segments with sinus beats were included in the final analysis.
Each measurement consisted of stationary state part (pretrigger Pt), a few stages of running (P1-P4) and a period of relaxation (Re), Fig. 1.

Here we report on the universality analysis of RR interval fluctuations in the pretrigger and P1 period only. 10) Our patients were divided in two groups: one with the evidence of ishemic ST-segment depression (SAP subjects), and the control group of healthy subjects. Selection of subjects was performed by a cardiologist according to the generally accepted medical knowledge.
The integrated RR interval distributions are shown in Fig.2 together with .

Clearly the universal, parameter free, distributions and of RMT are excluded. A possible reason for this is that heart is a very complex system of nonlinearly coupled biological oscillators whose motion is partly regular and partly irregular (chaotic) or mixed . Another possibility is that universality is only local.10)
The first theoretical step towards the understanding of the regular-irregular coexistence in a dynamical system was the work by Berry and Robnik 11) in which they offered a semiclassical model for known as the Berry-Robnik formulae. It is to be applied at large intervals . At small and intermediate intervals the Brody distribution 12)
| (9) |
gives better fitting results. The Brody distribution becomes Poisson at and Wigner for .
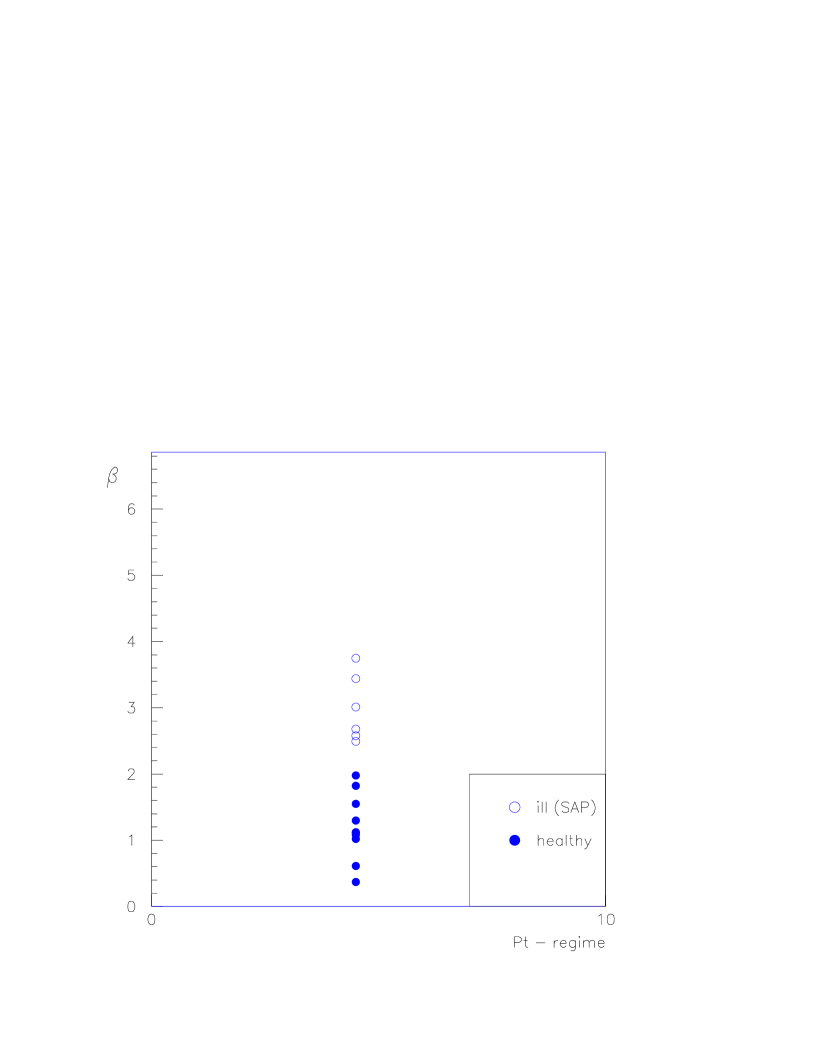
Figure 3 shows that the Brody distribution fits very well the ECG measured distribution of RR intervals. Each subject has its own value of which might be an indicator of a dynamical state of the heart. Indeed, Fig. 4 clearly shows that could be a useful parameter for separating SAP subjects from healthy ones.


4 Conclusion
In this paper we have investigated the possibility that fluctuations of RR intervals exhibit universal statistical laws. It is found, Fig. 2, that this is not so. Heart is a complex nonlinear system with many coexisting regular and irregular motions which manifest themselves through the nonuniversal fluctuations of RR intervals. It is also found, Fig. 3 and 4, that the one-parameter Brody distribution could be used successfuly to describe the fluctuation pattern of RR intervals. The parameter of the Brody distribution is seen, Fig. 4,to be connected with the dynamical state of the heart.
Further studies in larger populations are needed to confirm these interesting results.
Acknowledgements
This work was supported by the Ministry of Science and Technology of the Republic of Croatia.
References
- [1] R. J. Gibbons et al., J. Am. Coll. Cardiol. 33 (1999), 2092.
- [2] L. Glass, J. Cardiovasc, Electrophysiol. 10 (1999), 1358.
- [3] A. L. Goldberger, Lancet 347 (1996), 1312.
- [4] C. K. Peng, S. Havlin, H. E. Stanley, and A. L. Goldberger, Chaos 5 (1995), 82.
- [5] P. Ch. Ivanov, L. A. N. Amaral, A. L. Goldberger, S. Havlin, M. G. Rosenblum, Z. R. Struzik, and H. E. Stanley, Nature 399 (1999), 461.
- [6] M. L. Metha, Random Matrices (Academic Press, San Diego 1991).
- [7] F. J. Dayson and M. L. Metha, J. Math. Phys. 4 (1963) 701.
- [8] J. Feder, Fractals (Plenum Press, NY, 1988).
- [9] M. Martinis, A. Knežević, G. Krstačić, and E. Vargović, submitted to Phys. Rev. Lett.
- [10] Programs include controled physical activity on the moving belt. Interesting transitory phenomenae between Poisson and Wigner type distributions are observed. Detailed analysis will be reported elsewhere.
- [11] M. V. Berry and M. Robnik, J. Phys. A: Math. Gen. 17 (1984), 2413.
- [12] T. A. Brody, Lett. Nuovo Cimento, 7 (1973), 482.