Investigation of the performance of an optimised MicroCAT, a GEM and their combination by simulations and current measurements
Abstract
A MicroCAT (Micro Compteur à Trous) structure which is used for
avalanche charge multiplication in gas filled radiation detectors
has been optimised with respect
to maximum electron transparency and minimum ion feedback.
We report on the charge transfer behaviour and the achievable gas gain
of this device.
A three-dimensional electron and ion transfer simulation
is compared to results derived from
electric current measurements.
Similarly, we present studies of
the charge transfer behaviour of a GEM (Gas Electron
Multiplier) by current measurements and simulations.
Finally, we investigate the combination of the MicroCAT and the GEM by
measurements with respect to the performance at
different voltage settings, gas mixtures and gas pressures.
PACS: 02.60.Cb; 51.10.+y; 51.50.+v; 29.40.Cs
keywords:
Micro pattern gaseous detectors; Gas gain devices; GEM; Gas electron multiplier; MicroCAT; Gas gain; Charge transfer; Electron transparency; Ion feedback, , , , ,
1 Introduction
With the rise of micropattern gas gain devices like
GEM [1], MICROMEGAS [2],
CAT [3]
or MicroCAT [4] the field of application of gas
filled detectors has been widened up.
These structures accept high rates and
due to their parallel plate geometry they produce short signals and
good time-resolution.
Several attempts have been made in the past
to enhance the gain and the reliability
by combining micropattern structures.
The performance of the combination of MSGCs with GEM structures is
reported in Refs.
[5, 6, 7]. The combinations of MSGCs and MGCs
with GEM, MICROMEGAS and Plate Avalanche Chambers
are discussed in Ref. [8] with a special emphasis on
rate and gain limitations.
A GEM, used as a preamplification stage, has also been
successfully combined with a Groove Chamber [9].
First results of a device combining a
MICROMEGAS and a GEM have been presented in Ref. [10].
GEM structures have been combined to
double GEM [11], triple GEM and even to quad GEM
configurations [12, 13], which reach an
enormous gas gain in the order of .
Adding a GEM to the MicroCAT structure
a stable operation with respect to sparks
is obtained at moderate potentials; nevertheless
quite high gas gains are achievable at higher potentials.
For this reason the detector can be operated
in applications where higher gas pressures ()
and high- gases (like e.g. Xenon) are required, i.e. in X-ray
detection, as will be shown in this paper.
The intention of this investigation is to optimise MicroCAT- and
GEM-based detector systems for X-ray imaging (typical photon energy range:
), where the drift
gaps are usually several large and the drift fields are
in the range of or even less.
2 Study of the optimised MCAT215
In the past several MicroCAT structures have been investigated [4]. Recently, an optimised MicroCAT mesh has been produced by Stork Screens111Stork Screens, Boxmeer, Netherlands. In this section we compare the charge transfer derived from current measurements to simulations, and we demonstrate that the new device is superior to previously investigated MicroCAT structures with respect to maximum electron transparency (to maximise the effective gain) and minimum ion feedback (to avoid field perturbations in the drift region).
2.1 Characteristics
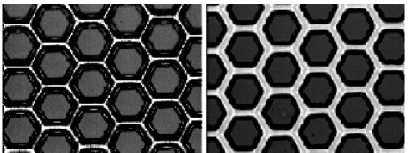
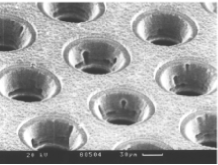
The MicroCAT structure (see Fig. 1) has been optimised with respect to maximum electron transparency and minimum ion feedback while retaining a good mechanical stability [14].
The parameters of the newly built device are given together with those of previously used MicroCATs in Table 1.
| type | holes/inch | pitch | hole diameter | open area | thickness |
|---|---|---|---|---|---|
| MCAT155 | 155 | ||||
| MCAT215 | 215 | ||||
| MCAT305 | 305 | ||||
| Opt. MCAT215 | 215 |
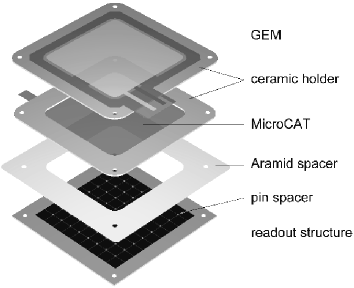
The holes which have a hexagonal shape with edges rounded by the production process form a hexagonal lattice. The cathode distance between the MicroCAT and the subjacent anode amounts to (see Fig. 2),
which is in fact very close to the optimum distance of about
with respect to maximum
time-resolution.
The anode is realised by an interpolating
resistive readout structure [15, 16].
The drift region has a height of
(since the GEM structure is not mounted). For all
measurements in this section the
detector volume is filled with a gas mixture of
(90/10).
The charge transfer behaviour of the MicroCAT depends only on the ratio
of the fields above and below the
mesh. This has been confirmed by simulations [14].
2.2 Charge transfer behaviour
For the determination of the charge transfer the measurement of at least two of the following three currents is neccessary:
| (1) | ||||
| (2) | ||||
| (3) |
with as the incoming current:
| (4) |
Here,
denotes the electron transparency, the
ion feedback, which describes the fraction of ions drifting back to the drift
cathode, the gas gain, the photon rate, the
mean energy deposited by the photons in the detector,
the mean ionisation potential of the gas atoms/molecules and
the elementary charge.
Since Eqs. 1-3 fulfill current
conservation, equivalent to
, only two of the three relations are
independent and thus not sufficient to determine all three unknown
variables , and .
Therefore, one additional condition is required, which we determine
by the simulation presented in the following paragraph.
2.2.1 Simulations
The electric fields for the MicroCAT structures
have been calculated in three dimensions using the
Maxwell package [17]. The charge drift was calculated
using the Garfield program
[18]. The gas properties used for the Garfield simulation
like electron diffusion or drift velocity are calculated by the
Magboltz program [19, 20].
The distance between the lower side of the MCAT
and the anode has been set
to , the MCAT voltage to while
the anode structure has zero potential, leading to an average electric
field in the amplification gap of .
All potentials are assumed to be constant during the simulation since
the change of the potential during one multiplication process due to
charge motion in the real detector is calculated to be in the order of
.
Diffusion has been included for the drifting electrons but neglected for
the ions since this contribution is expected to be small.
Charge multiplication has not been considered.
The ion feedback simulation is based on an effective size of the ion
cloud of about . A more detailed
description of the charge transfer simulation can be found in
Ref. [14].
The results of the simulation for the electron transparency
and ion feedback
are shown in
Fig. 3
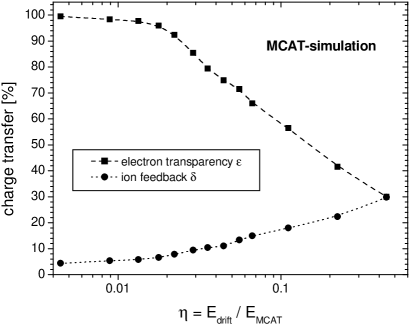
as a function of the ratio for fixed . As expected, the ion feedback increases with but the electron transparency decreases.
2.2.2 Measurements and comparison with simulations
We have measured the electric currents at all electrodes as a function
of the ratio with the settings
and .
Due to technical
reasons the measurements of and
are restricted
to small values of below about . In Section
4 the range of is extended to larger values of
about .
From the measured currents we compute the effective gain
using the
relations
1–3:
| (5) |
The gain variation due to the increasing drift field in the investigated range of has been calculated with Garfield for electrons starting above the MCAT along the symmetry axis of a hole to be less than . Therefore, the measured product is expected to follow the simulation of . In Fig. 4
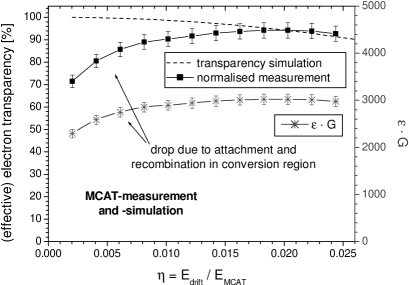
where we compare the measurement with the simulation, we observe that
contrary to the simulation the measured product drops at small values of
. We attribute this effect to attachment of the primary
electrons and to recombination with back drifting positive ions.
These effects which have not been considered in the simulation seem to be
negligible at higher drift fields corresponding to . We
derive an effective electron transparency (see
Fig. 4) by normalising the measured
to the simulation of at
. The systematic uncertainty of this procedure is indicated
in the figure by the enlarged error bars.
We also compare the ion feedback with the measurement using the
reasonable approximation :
| (6) |
The measurement deviates considerably from the simulation at small illustrated in Fig. 5.
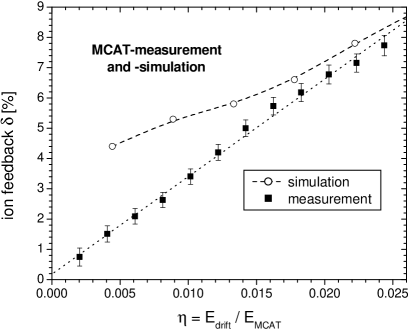
Obviously, our model is too coarse in this region of .
2.2.3 Comparison with other MicroCAT types
Fig. 6
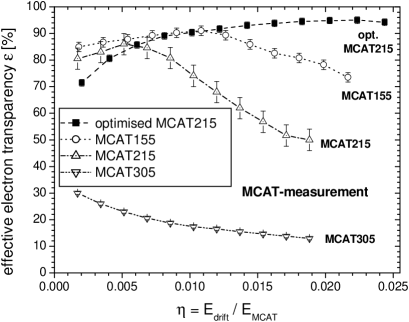
shows a comparison of the measured effective
electron transparency of four MicroCAT
structures with dimensions summarised in Table 1.
The optimised mesh offers the largest electron transparency.
The drop of the effective
electron transparency at low is different for
the different MicroCATs because the amount of gas impurities slightly varies
from measurement to measurement.
The comparison of the ion feedback
of the MicroCAT structures
(see Fig. 7)
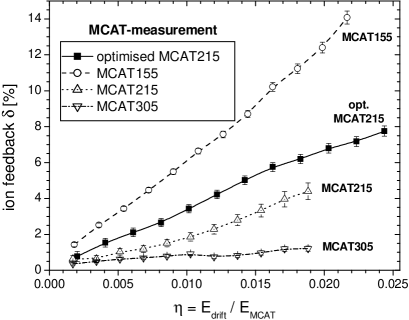
shows, that the fraction of back drifting ions of the optimised MCAT215 structure is nearly as small as for the old MCAT215 structure and lower than that of the MCAT155 device, although the electron transparency of the optimised mesh is much larger than that of the competing devices (compare to Fig. 6).
2.3 Charge multiplication behaviour

shows the gain as a function of the MCAT voltage. It has been obtained from the observed pulse heights of an -source where the gain had been calibrated at one voltage to the current measurement. The maximum gain, which we define as the gas amplification, that can be reached within a discharge limit of less than , is in the order of .
2.4 Conclusion
The comparison of the optimised and the three previously investigated MicroCAT structures shows that the new mesh is superior with respect to electron transparency. The ion feedback of the optimised structure is in a reasonable range ( up to ). In order to reach maximum effective gain the optimised device should be operated with ratios of the fields above and below the MCAT. A maximum gain of about can be obtained at atmospheric pressure for Argon gas mixtures.
3 Study of the GEM
The charge transfer and gas gain behaviour of the GEM is investigated by simulations and current measurements to obtain the optimum operation parameters in view of a combination of the GEM with the MicroCAT. The influence of different voltage settings and gas mixtures and pressures has been studied.
3.1 Characteristics
The GEM structure is fixed above the MicroCAT at a
distance of (see Fig. 2).
The MicroCAT serves as anode with a slightly positive voltage
(). In this geometry
the drift region above the
GEM amounts to about , the
region below the gas electron multiplier corresponds to the distance
to the MicroCAT structure, consequently .
We denote the electric field above and below the GEM
with drift field and transfer field, respectively.
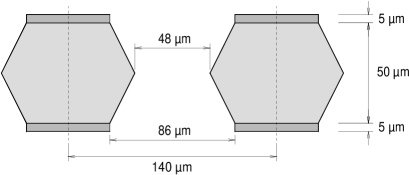
The GEM [21] (see Fig. 9),
itself, has a hexagonal hole arrangement with a pitch of , an optical transparency of about and a total thickness of (see Fig. 10).
The current measurements have been carried out with a -source, collimated to , emitting photons with a rate of about .
3.2 Charge transfer behaviour
The charge transfer behaviour of the GEM can be described by four current equations. Two electron transparencies are introduced: is the probability, that the electrons, coming from the drift/conversion region, reach the centre of a GEM hole; is the probability, that these electrons reach the anode. This approach has already been introduced by other groups (see for example in Ref. [22]). The ion feedback is again denoted by .
| (8) | ||||
| (9) | ||||
| (10) | ||||
| (11) |
Current conservation reduces these equations to three independent relations. In the following we make use of the effective gain which is defined by .
3.2.1 Simulations
Like in the previous section the three-dimensional
electric field in the GEM geometry
and the charge transfer behaviour have been investigated with Maxwell
and Garfield, respectively. For the transparency simulation
the charge multiplication process has
not been considered; ion feedback simulations have not been carried
out.
If not stated differently, we have assumed in the simulations a drift
field of , a transfer field of
, a GEM voltage of
and a gas mixture of
and
(90/10).
Influence of the drift field:
The dependency of the electron transparencies and on the applied drift field () is shown in Fig. 11.
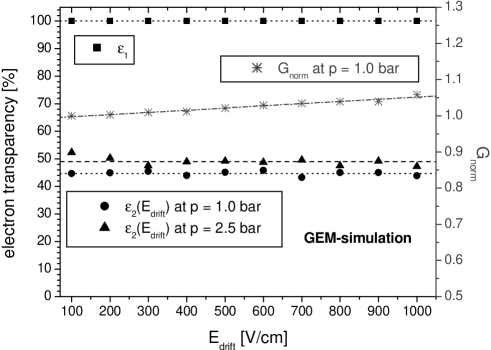
All electrons
reach the centre of the hole in the GEM
structure (), independent of the chosen gas pressure.
The parameter
is not influenced noticeably by the drift field.
The deviation of between the two gas pressures can be
explained by the smaller electron diffusion at higher pressure.
The situation is very different from that in particle physics
applications where usually due to rather high drift fields
is smaller than . In our case the overall
electron transparency is obviously limited by diffusion effects which
cause a large fraction of electrons to be caught by the lower
electrode.
We have also studied the effect of drift field variations on the gain .
The gain was calculated with Garfield for one electron
starting above the GEM along the symmetry axis
of a hole.
The smallest gain , which is obtained
at a drift field of , is normalised to
. The gain
increases by about in the investigated drift field
range.
Influence of the transfer field:
The electron transparencies and as a function of the applied transfer field () are shown in Fig. 12.
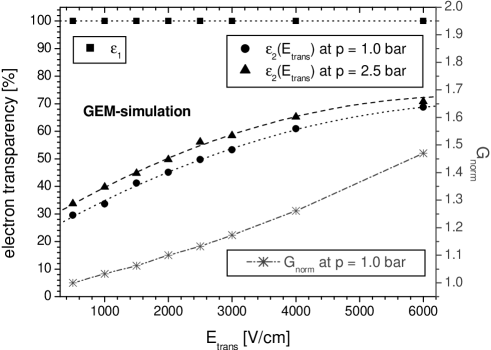
The transparency is constant for all applied transfer fields, whereas shows a strong increase with rising transfer fields. Smaller electron diffusion at higher pressure leads to a larger . Fig. 12 also shows the normalised gain as a function of the transfer field. The change at low transfer fields is about ; identical as observed with a variation of the drift field (see Fig. 11). At transfer fields the parallel plate amplification starts in the gap between the GEM and the anode plane, resulting in an additional contribution to the gain .
Influence of the GEM voltage:
The dependence of the electron transparencies on the applied GEM voltage () has been studied (see Fig. 13).
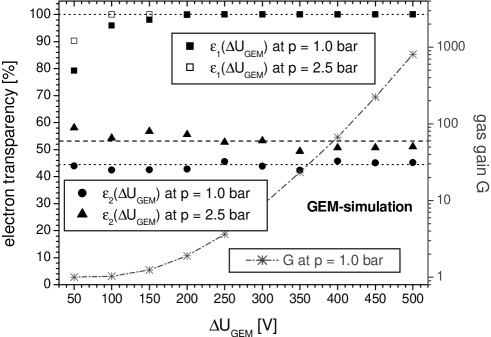
The transparencies and depend only weakly on the GEM voltage. For very low GEM voltages decreases because the drift channel through the GEM holes becomes wider. Smaller diffusion at a gas pressure of results in a larger electron transparency than for atmospheric pressure. The calculated GEM gain has the typical exponential shape with increasing operation voltage.
3.2.2 Measurements and comparison with simulations
A gas mixture of (90/10) at a pressure of
was chosen for most of the measurements
if not stated differently. In addition, the charge
transfer and multiplication behaviour was investigated for several
Argon, Krypton, Xenon and -quench gas mixtures at various
pressures up to .
From Eqs. 8–11
the product , the transparency
and the ion feedback (using the reasonable
approximation ) can be calculated:
| (12) |
| (13) |
| (14) |
Influence of the drift field:
Fig. 14
shows the influence of the drift field on the product
for various gas pressures of
(90/10). The decrease at small drift fields is again attributed to
recombination and attachment effects which are expected to increase
with gas pressure. The simulation (see Fig. 11)
indicates that the gain slightly depends on the drift field, whereas the
transparency is constant. Therefore the measured
electron transparency can be assumed to
be very close to .
The measurements show that the transparency does not
change noticeably with the varying drift field
(see Fig. 15).
This is in line with expectation and simulation. However, the transparency is apparently overestimated in the simulation, which means that in reality more electrons move to the GEM-bottom electrode. Possible explanations of this effect could be:
-
1.
neglection of the avalanche development in the simulation: repulsive forces and UV-photons widen the electron cloud.
-
2.
underestimation of the electron diffusion at high electric fields in Magboltz.
The measured ion feedback of the GEM is presented in Fig. 16
for several gas pressures of (90/10). It increases nearly linearly with rising drift field.
Influence of the transfer field:
The measured increase of with rising (see Fig. 17)
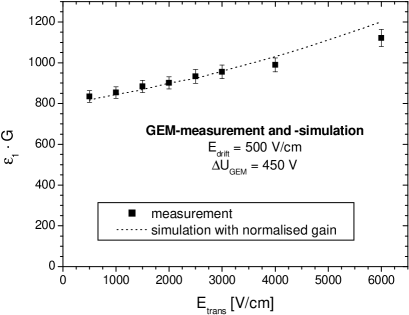
is in a good agreement with the increase of the gain which was
predicted by the simulation (compare to
Fig. 12).
Thereby the simulated
gain had to be renormalised because of the inaccurate knowledge of the
corresponding Townsend coefficients.
We conclude that
is not sizeably influenced by the transfer field.
However, the transparency increases strongly with
rising transfer fields (see Fig. 18).
The deviation of the absolute values of between simulation and
measurement has already been discussed in section 3.2.2.
For transfer fields
the parallel plate amplification
underneath the GEM
leads to an apparent rise of which is more pronounced
in the measurement due to the longer multiplication path of
compared to in the simulation.
The measured ion feedback (see Fig. 19)
is approximately constant at lower transfer fields. When the parallel plate amplification produces a noticeable amount of gain (at large transfer fields) the ion feedback rises. We conclude that the ion feedback is larger for ions which are produced below the GEM rather than in the GEM holes.
Influence of the GEM voltage:
The expected exponential dependence of on the GEM voltage is shown in Fig. 20
for (70/30) at various gas pressures.
With increasing the transparency
decreases (see Fig. 21).
For high GEM fields the electron drift channel becomes very narrow. As
a consequence the probability that electrons diffuse to one of the
dense drift lines that end on the GEM bottom electrode is increased.
The ion feedback as a function of the GEM voltage is shown
in Fig. 22.
Due to very small currents at the drift cathode at low gains the error bars are very large. The deviations from a constant behaviour are not significant.
3.3 Charge multiplication behaviour
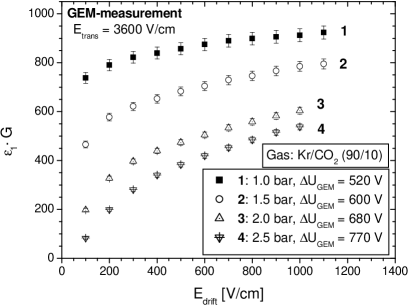
We have investigated the gain behaviour of the GEM for different gas mixtures and pressures. The maximum gas amplification, which can be reached within a discharge limit of less than , decreases drastically with gas pressure (shown as an example for a (90/10) gas mixture in Fig. 23).
This effect is studied in more detail in Ref. [23].
3.4 Conclusion
The approach of the introduction of the two electron transparencies
and has been sensibly confirmed by our
measurements.
The systematic studies of the currents at the electrodes in a wide
range of voltages and electric fields show the following results:
-
•
The transparencies and do not depend significantly on the drift field for . The ion feedback rises nearly linearly with increasing drift field. In order to avoid electron losses due to recombination and attachment in the conversion region the drift field should not be chosen too small, especially for higher gas pressures. The gain rises slightly with increasing drift field.
-
•
The transfer field has no influence on the electron transparency in the investigated field range . The transparency strongly rises with increasing transfer fields. The ion feedback does not change noticeably for small transfer fields and increases slightly for higher transfer fields. Also the gain rises with increasing transfer field.
-
•
Very small GEM voltages lead to a decrease of . The transparency decreases slightly for large potential differences, whereas the ion feedback is nearly constant.
4 The combination of the optimised MicroCAT with the GEM
The combination of the optimised MCAT215 and the GEM has been investigated by current measurements to determine the optimum voltage settings with respect to maximum effective gain and minimum ion feedback. The maximum gas gain in different gas environments has beed studied. No simulations have been carried out. However, the results of the individual simulations from Sections 2 and 3 can be combined.
4.1 Characteristics
Fig. 2 shows the schematic setup of the combination of MicroCAT and GEM. We call the electric field between the drift cathode and the GEM by , the field between the GEM and the MCAT by and between the MCAT and the anode by , where denotes the voltage applied to the MCAT and the distance between MCAT and anode. The ratio of the fields above and below the MicroCAT structure is denoted by . The electron transparency, ion feedback and gain of the MicroCAT are denoted by , and , respectively. All GEM transparencies are denoted as in the previous section, the GEM gain is denoted by . The total effective gain is defined as follows:
| (15) |
4.2 Charge transfer behaviour
Fig. 24
shows the relative signal pulse heights as
a function of the transfer field for a drift
field of , a GEM
voltage of , an MCAT
voltage of at a gas pressure of
(90/10).
Up to transfer fields of
the signal pulse height rises. The subsequent plateau reaches up to
, before the signals
get smaller again. At very high transfer fields of
parallel plate
amplification between GEM and MicroCAT
starts, which again leads to an increase of the signals’
pulse heights.
The shape of this curve is affected by two opposite
effects: on the one hand the transparency
of the GEM rises for increasing transfer fields
(compare to Fig. 18), and on the other hand
the electron transparency of
the MicroCAT drops for larger values of (compare to
Fig. 3). With the knowledge of
, determined in section 3,
the electron transparency of the MCAT can be
calculated up to values of .
The result is shown in Fig. 25.
It agrees perfectly with the transparency measured directly with the
MicroCAT alone (see Fig. 4).
Measurements at different GEM voltages
show the same results. However, a large deviation from the simulation
is obvious for . The measured transparency
is significantly
smaller than what the simulation predicts. We have no explanation for
this effect.
By means of current relations and the reasonable assumptions, that
, and
the ion feedback of the MicroCAT can be determined:
The result (see Fig. 26)
shows a good agreement to the direct measurement (compare to
Fig. 5). Despite the
coarse model for the ion feedback simulation the
simulation and the measurement match very well for larger ratios .
Additional measurements have shown that
the field in the conversion region
above the GEM
has no influence on the ion feedback .
Fig. 27
shows, that the total ion feedback is getting more favourable for higher transfer fields. The GEM voltage has no strong effect on the total ion feedback (see Fig. 28).
The increase of the total ion feedback with decreasing MCAT voltage (see Fig. 29)
can be explained by the rising contribution of the ion feedback , which gets larger for higher ratios (compare to Fig. 26).
4.3 Charge multiplication behaviour
The effective gain (see Eq. 15) of the GEM/MicroCAT-combination can be calculated from the measured currents (see Eq. 4) and as follows:
The effective gain as a function of the transfer field rises to maximum at in (90/10) (see Fig. 30).
In order to study the maximum gas gain
a systematic investigation of the effective gain as a
function of the gas pressure has been carried out for
different noble gas/quench gas
mixtures.
The GEM voltages are chosen such, that this fragile pre-amplification
device always works in a safe range, whereas the MCAT produces the
main amplification. This method has the advantage that all discharges
appear below the MicroCAT structure, which is
not easily damaged by sparks.
All sparks appear at a defined avalanche size depending on the
gas mixture and pressure used, but independent on the voltage settings on
GEM or on MCAT.
The measurements of the maximum gas gain are carried out for
gas pressures up to . Fig.
31
shows the measured maximum gain for several pressures of (90/10) and (90/10). In a first approximation the drop of the gain for higher pressures is approximately exponential. The results of the exponentially fitted data are shown in Fig. 32.
The largest gas gain of about can be achieved with the gas mixture of (90/10). At atmospheric pressure the gain decreases with the atomic number of the nobel gas. We estimate that for gas pressures up to gains of at least can be reached, even for Xe-mixtures.
4.4 Conclusion
The investigation of the optimum voltage settings for a GEM/MicroCAT-combination leads to the following results:
- •
-
•
A transfer field in the range of ensures a maximum effective gain and a small total ion feedback.
-
•
Since the combined gain of the GEM and the MicroCAT is limited and because the GEM is easily destroyed by discharges the MicroCAT should be operated at much higher gain than the GEM.
The maximum gas gain decreases with pressure and atomic number of the noble gas. A stable operation with gains in the order of can be obtained even for Xenon gas mixtures up to .
5 Conclusion
The new optimised MicroCAT structure
is superior to all other MicroCAT devices with respect to
electron transparency. The ion feedback
of the new mesh is smaller than for the MCAT155 and
nearly as good as for the old MCAT215 structure.
Gas gains of larger than
can be achieved in Argon gas mixtures at standard pressure.
In our special detector setup a GEM has
been investigated with respect to its charge transfer and
gas gain behaviour with different
voltage settings and different gas environments. The charge
transfer simulations
are well confirmed by the measurements.
A sub-division of the overall electron transparency into the two
transparencies and is reasonable.
The achieved gains of the
GEM are comparable to published results.
The combination of both gas gain devices
leads to a very high gas gain at atmospheric pressure and a reliable
detector operation with gains in the order of in Xenon
gas mixtures at higher pressures of about . The GEM
can be operated in a very safe gas gain mode, whereas the
the MicroCAT produces the largest amount of gain;
due to the robustness of the nickel mesh and its insensitivity against
sparking no destruction of this device needs to be feared. The fraction
of back drifting ions is in the order of a few percent when
MicroCAT and GEM are combined. Therefore, spatial reconstruction
distortions due to space charge effects in the conversion region are
expected to be small.
References
- [1] F. Sauli. GEM: A new concept for electron amplification in gas detectors, Nucl. Instr. and Meth. A 386 (1997) 531
- [2] Y. Giomataris, Ph. Rebourgeard, J.P. Robert, G. Charpak. MICROMEGAS: A high-granularity position-sensitive gaseous detector for high particle-flux environments, Nucl. Instr. and Meth. A 376 (1996) 29
- [3] F. Bartol, M. Bordessoule, G. Chaplier, M. Lemonnier, S. Megtert. The C.A.T. Pixel Proportional Gas Counter Detector, J. Phys. III France 6 (1996) 337
- [4] A. Sarvestani, H.J. Besch, M. Junk, W. Meissner, N. Sauer, R. Stiehler, A.H. Walenta, R.H. Menk. Study and application of hole structures as gas gain devices for two dimensional high rate X-ray detectors, Nucl. Instr. and Meth. A 410 (1998) 238
- [5] Y. Benhammou, J.M. Brom, J.C. Fontaine, D. Huss, F. Jeanneau, A. Lounis, I. Ripp-Baudot, A. Zghiche. Comparative studies of MSGC and MSGC-GEM detectors, Nucl. Instr. and Meth. A 419 (1998) 400
- [6] O. Baruth, S. Keller, U. Werthenbach, G. Zech, T. Zeuner. Sparks in MSGC and GEM detectors and a robust alternative, Nucl. Instr. and Meth. A 454 (2000) 272
- [7] Y. Bagaturia, O. Baruth, H.B. Dreis, F. Eisele, I. Gorbunov, S. Gradl, W. Gradl, S. Hausmann, M. Hildebrandt, T. Hott, S. Keller, C. Krauss, B. Lomonosov, M. Negodaev, C. Richter, P. Robmann, B. Schmidt, U. Straumann, P. Truöl, S. Visbeck, T. Walter, C. Werner, U. Werthenbach, G. Zech, T. Zeuner, M. Ziegler. Studies of aging and HV break down problems during development and operation of MSGC and GEM detectors for the Inner Tracking System of HERA-B, accepted for publication in Nucl. Instr. and Meth.
- [8] P. Fonte, V. Peskov, B.D. Ramsey. Rate and gain limitations of MSGCs and MGCs combined with GEM and other preamplification structures, Nucl. Instr. and Meth. A 419 (1998) 405
- [9] I. Reichwein, U. Werthenbach, G. Zech. Properties of Groove Chambers, accepted for publication in Nucl. Instr. and Meth.
- [10] S. Kane, J. May, J. Miyamoto, I. Shipsey. A study of micromegas with preamplification with a single GEM, Proceeding for the International conference on advanced technology and particle physics, Villa Olmo, Como, Italy, Oct 15-19 (2001), submitted to World Scientific (2002)
- [11] S. Bachmann, A. Bressan, L. Ropelewski, F. Sauli, A. Sharma, D. Mörmann. Charge amplification and transfer processes in the gas electron multiplier, Nucl. Instr. and Meth. A 438 (1999) 376
- [12] A. Buzulutskov, A. Breskin, R. Chechik, G. Garty, F. Sauli, L Shekhtman. The GEM photomuliplier operated with noble gas mixtures, Nucl. Instr. and Meth. A 443 (2000) 164
- [13] A. Buzulutskov, A. Breskin, R. Chechik, G. Garty, F. Sauli, L Shekhtman. Further studies of the GEM photomultiplier, Nucl. Instr. and Meth. A 442 (2000) 68
- [14] A. Orthen, H. Wagner, H.J. Besch, R.H. Menk, A.H. Walenta. Charge transfer considerations of MicroCAT-based detector systems, Nucl. Instr. and Meth. A 492 (2002) 160
- [15] H.J. Besch, M. Junk, W. Meissner, A. Sarvestani, R. Stiehler, A.H. Walenta. An interpolating 2D pixel readout structure for synchrotron X-ray diffraction in protein crystallography, Nucl. Instr. and Meth. A 392 (1997) 244
- [16] H. Wagner, H.J. Besch, R.H. Menk, A. Orthen, A. Sarvestani, A.H. Walenta, H. Walliser. On the dynamic two-dimensional charge diffusion of the interpolating readout structure employed in the MicroCAT detector, Nucl. Instr. and Meth. A 482 (2002) 334
- [17] Maxwell 3D Field Simulator Version 5.0.04, Ansoft Corporation, Pittsburgh, PA USA
- [18] Garfield, CERN Wire Chamber Field and Transport Computation Program written by R. Veenhof, Version 7.05 (2001)
- [19] S.F. Biagi. Monte Carlo simulation of electron drift and diffusion in counting gases under the influence of electric and magnetic fields, Nucl. Instr. and Meth. A 421 (1999) 234
- [20] Magboltz, CERN Transport of Electrons in Gas Mixtures Computation Program written by S.F. Biagi, Version 2
- [21] J. Benlloch, A. Bressan, C. Buttner, M. Capeans, M. Gruwe, M. Hoch, J.-C. Labbé, A. Placci, L. Ropelewski, F. Sauli, A. Sharma, R. Veenhof. Development of the gas electron multiplier (GEM), IEEE Trans. Nucl. Sci. 45 (1998) 234-243
- [22] C. Richter, A. Breskin, R. Chechik, D. Mörmann, G. Garty, A. Sharma. On the efficient electron transfer through GEM, Nucl. Instr. and Meth. A 478 (2002) 528
- [23] A. Bondar, A. Buzulutskov, F. Sauli, L. Shekhtman. High- and low-pressure operation of the gas electron multiplier, Nucl. Instr. and Meth. A 419 (1998) 418