The type of seeder cells determines
the efficiency of germinal center reactions
Michael Meyer-Hermann and Tilo Beyer
Institut für Theoretische Physik, TU Dresden, D-01062 Dresden, Germany
E-Mail: meyer-hermann@physik.tu-dresden.de
Correspondence should be addressed to MMH.
Abstract: We discuss the origin of two classes of germinal centers that have been observed during humoral immune responses: Some germinal centers develop very well and give rise to a large number of high affinity antibody producing plasma cells. Other germinal center reaction are very weak and the output production is practically absent. We propose an explanation for this nearly all-or-none behavior of germinal center reactions: The affinity of the seeder B-cells to the antigen is the critical parameter that determines the fate of the germinal center reaction. This hypothesis is verified in the framework of a space-time simulation of germinal center reactions.
1 Introduction
Germinal centers (GC) are an important part of the humoral immune response [1, 2, 3, 4]. They generate new plasma cells that produce antibodies of high affinity to a specific antigen. This affinity maturation process allows the organism to adapt its antibody repertoire to new antigens, to form the memory B cell compartment, and to react to antigens more efficiently compared to an immune response using B-cells from the repertoire only.
Typically, GCs are found in lymph nodes or in the spleen. In reaction to primary immunization some B-cells from the repertoire are activated and become sensible to proliferation progression factors. These B blasts (centroblasts) migrate towards the primary follicle system. In the environment of follicular dendritic cells and T cells they start a process of monoclonal expansion [5, 6, 7]. After about three days the centroblast population reaches about 12000 cells due to an extremely short cell cycle time of - hours [8, 9, 10]. During this early phase of the GC reaction a reduction of diversity has been observed where those B cells of higher affinity to the antigen have been preserved [6]. This has been interpreted as an early antigen-dependent preselection process of un-mutated B cells. The phase of monoclonal expansion is believed to be followed by a phase of frequent somatic hypermutation [4, 11], giving rise to a great variety of different antibodies that are encoded in the blasts. These cells start to differentiate to centrocytes that are no longer in cell cycle but express large numbers of antibodies [10, 12]. Centrocytes have initiated a process of apoptosis [13]. They are rescued from apoptosis in dependence on an interaction with antigens that are presented on the FDCs [14, 15, 16]. All centrocytes that are not selected by such an interaction process die – and this is the large majority. Only positively selected centrocytes get the chance to interact with T cells and, if again selected, to further differentiate into antibody producing plasma cells or memory cells [17, 18, 19, 20]. As this selection process is believed to depend on the affinity of antibodies and antigen, the GC reaction provides an antibody optimization procedure.
GCs show some very interesting properties. Among those are the separation of centroblasts and centrocytes into two zones, the dark and the light zone [4, 10, 21]. The origin of those zones has been discussed before in the framework of a stochastic space-time model for the GC reaction [22]. Another property is the nearly all-or-none behavior of GCs [16, 23]. GC reactions of moderate intensity have rarely been observed. The reaction is either successful (concerning affinity maturation and number of produced output cells) or strongly suppressed. The reason for this behavior has not been resolved until now. Especially, the all-or-none behavior could not be reproduced in a previous modeling work [24].
One suggestion goes back to the starting point of the GC reaction, the originally activated B cells [23]. The authors speculate that the mouse colony in their (pathogen-free) experiment may undergo a qualitatively and quantitatively diverse background immune response, i.e. leading to a diversification of the B cell repertoire between individuals. The consequence would be that the seeder cells of the GC reaction would have different affinities to the antigen, implying different GC reactions. This leads us to the hypothesis that the quality of GC seeder cells determines the fate of the GC reaction [25, 26, 27] and, in addition, may imply the all-or-none behavior of GCs. In the present article this hypothesis is discussed in the framework of a previously introduced stochastic space-time model for the GC reaction [22].
2 Methods
The model providing the basis of the analysis has been introduced in all details before [22]. Therefore, only those model elements are pointed out in details that are of direct relevance in the present context. The basic concepts are only shortly summarized in the following.
Cells are represented on a fixed, equidistant, cubic, and two dimensional lattice. Each cell occupies exactly one node of the lattice. All cells can move on the lattice with some velocity, which is anti-proportional to the cell radius. The movement is undirectioned and restricted by the space available on the lattice. Each cell is of specific type (centroblast or centrocyte) which determines their possible actions: Centroblasts can divide. Each division allows a somatic hypermutation to occur with probability . They also can differentiate to centrocytes provided that the differentiation process has been activated before. This happens if the centroblast binds a certain amount of signal molecules, which is secerned by the FDCs and diffuses over the lattice. Such a non-local interaction process turned out to be crucial for the establishment of the dark zone [22]. Centrocytes die by apoptosis and are then eliminated from the lattice. They may be rescued by an interaction with antigens on FDCs, which becomes possible when centrocytes and FDCs are in direct contact on the lattice and provided that the affinity of the presented antibodies to the antigen is strong enough. Rescued centrocytes can further differentiate to plasma- or memory-cells (output cells) or restart to proliferate (i.e. become centroblasts again). Output cells leave the GC by diffusion. The parameters that have been used here and that have been determined before [22] are summarized in Tab. 1.
Most important is the description of affinity between antigen and antibodies. The model uses the traditional shape space concept [28]. The dimension of the shape space is thought to represent phenotype properties of the antibodies. The affinity to the antigen reaches a maximum at the shape space position corresponding to optimal complementarity. A mutation (only those of phenotypical relevance are counted) is represented by a jump to a neighbor point in the shape space. The principle of affinity neighborhood [27] ensures that the affinity may be increased by a sequence of somatic hypermutations. One may think of climbing up an affinity hill. However, key mutations, that has been frequently discussed (especially for immunization with (4-hydroxy-3-nitrophenyl)acetyl (NP) [16]) are not easily covered by this concept. Therefore, the outcome of the analysis will have to be interpreted in this context.
The quality of a B cell is defined by its distance to the antigen (i.e. to the optimal B cell clone). The distance is calculated by the number of (phenotypically relevant) somatic hypermutations that are necessary to reach the antigen position in the shape space. The number of mutations is denoted by mutation-distance in the following. This corresponds to the definition of a 1-norm on the shape space which is assumed to have four dimensions. Using this norm the affinity of antibody and antigen is quantitatively described by a Gaussian function which is centered at the antigen position in the shape space [27]. In the following this concept is used to describe the efficiency of the GC reaction in a qualitative and quantitative way. At first, the quality of a GC reaction is measured by the success of the affinity maturation process. To this end the fraction of high affinity output cells (the sum of plasma and memory cells) resulting from the GC reaction is analyzed. High affinity means that the antibody binds the antigen with a probability of more than . Secondly, the number of resulting output cells (summed over the whole GC reaction) is a good measure for the quantitative efficiency of the GC reaction.
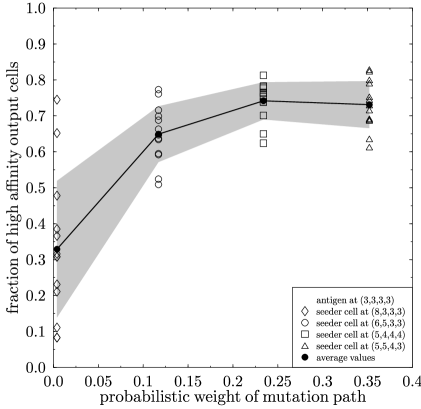
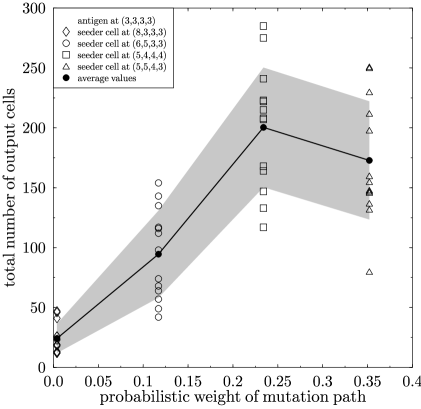
However, the above notion of B cell quality hides an intrinsic ambiguity. Let the antigen be at position and let the seeder cells have a mutation-distance of . The outcome of the GC reaction depends on the exact position of the seeder cell, which may have the initial position or . Assuming the mutations to occur randomly [16, 29], the probabilistic weights of both seeder cells to find the antigen position considerably differs: and . The difference is due to the number of possible permutations in the sequence of mutations. In other words, there exist more combinatorial possibilities for the mutations that all lead to the same target . This ambiguity is mirrored in the GC efficiency (quality and quantity of output cells, see Fig. 1). Less probable mutation paths induce GC reactions of smaller efficiency. However, at least the fraction of high affinity output cells saturates for more probable mutation paths. In order to ensure a well-defined mutation distance, only seeder cells that reach the antigen on a mutation path of maximum probability will be taken into account. The results have been cross-checked using mutation paths of moderate probability.
Using the thus defined model concepts we initiate GC reactions with various types of seeder cells. The seeder cells are placed at random positions in the FDC network. The mutation-distance is varied between and . Mutation-distances to the antigen of more than seem to be unphysiological [30, 31]. Only a cutout of the shape space in the neighborhood of the antigen (which is fixed at in the shape space) is considered: The range of each shape space dimension is . B cells that leave this shape space area are considered to have vanishing affinity to the antigen. The positions of the seeder cells are listed in Tab. 2. As we use a stochastic model, the GC reactions are repeated with different initializations of the random number generator. Each result is presented by showing GC reactions, the average value, and one standard deviation.
3 Results
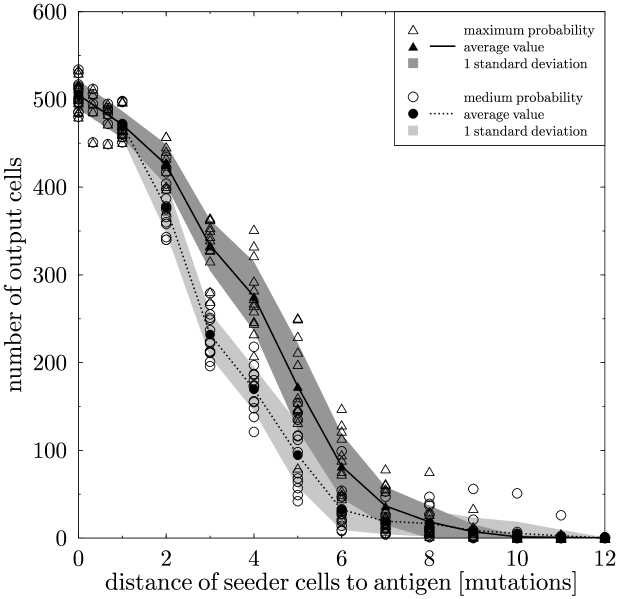
We find a clear correlation of the total number of output cells produced during the GC reactions and the mutation-distance of the seeder cells that initiate the GC reaction (see Fig. 2). If the seeder cells are already high affinity B cells, the GC reaction is rather stable and produces a large amount of high affinity output cells. With increasing mutation-distance the number of output cells is reduced in a sigmoidal-like functional dependence. For mutation-distances of more than the outcome of the GC reaction becomes critical and for more than the GC reaction is not able to generate a relevant amount of output cells.
The GC reaction breaks down in a relatively narrow range of the seeder cell mutation-distance to the antigen. This points towards an all-or-none development of GC reactions which depends on the seeder cell quality (at least concerning the output quantity). This interpretation is verified by counting the numbers of GC reactions that lead to the production of different numbers of output cells (see Fig. 3). This analysis is based on the same number of GC reactions for each type of seeder cells. Indeed, GCs preferentially produce large or nearly vanishing amounts of output cells. Small or moderate amounts are rare events.
Note, that these results remain basically unaltered considering seeder cells with mutation paths to the antigen of moderate (instead of maximum) probabilistic weight (see Tab. 2, Fig. 2 and 3). However, the break-down of the GC reaction is slightly shifted to seeder cells of higher quality.
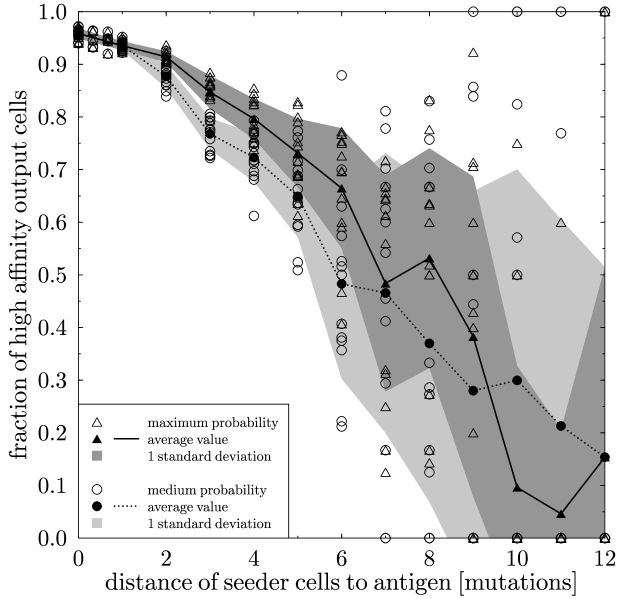
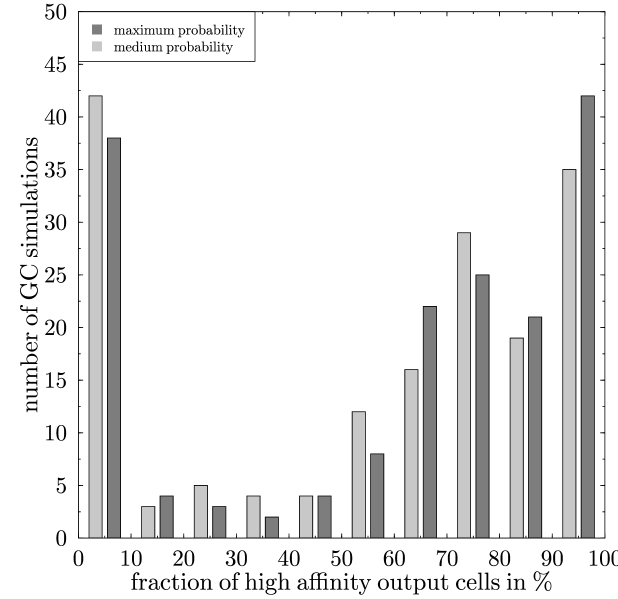
The output quality is correlated to the seeder cell quality in a very analogous way (see Fig. 4). The GC reaction produces a stable and large fraction of high affinity output cells for high affinity seeder cells. For seeder cells with larger mutation-distances the fraction of high affinity output decreases. The correlation becomes instable for very large mutation-distances. This is due to the small number of produced output cells in this regime. Large statistical fluctuations obscure the correlation of output and seeder cell quality. However, plotting the number of GC reaction leading to some fraction of high affinity output cells (see Fig. 5) shows that the all-or-none behavior of GCs is clearly found for the output quality as well. Note, that this result is again not affected by switching to seeder cells with mutation paths to the antigen of moderate (instead of maximum) probabilistic weight.
An interesting observation of the GC reactions for various types of seeder cells is that the dark zone is established in all GC reaction in a very similar way – independently of the seeder cell quality. The dark zone is always depleted around day of the reaction (data not shown). This implies that the initial phase of the GC reaction is not influenced by the seeder cell affinity to the antigen. This initial phase includes the phase of monoclonal expansion and even the first days of the phase of somatic hypermutation and selection (what we have called the primary optimization phase [27]). It is only afterwards when the selection of centrocytes becomes the dominant process of the GC reaction, that the seeder cell affinity to the antigen is a critical parameter. We observe a huge sensitivity of the total GC life time on the seeder cell quality, which varies from to days. This implies that if the B cell quality is not substantially enhanced during the first phase of the reaction, the GC B cell population rapidly dies out within to days – a behavior that has been observed in experiment as well [32, 26].
It is important to verify that the affinity maturation process was, indeed, unsuccessful in rapidly dying GCs. This is best shown by considering the number of recycled centroblasts (i.e. re-proliferating centroblasts that have been positively selected at least once) after days (a representative time point) of the reaction. If a centrocyte is positively selected it will restart to proliferate with a high probability [27] and therefore the number of recycled cells is a good measure for the success of the affinity maturation process. For seeder cells with a mutation-distance of more than this value remains below and reaches for seeder cells with mutation-distance of .
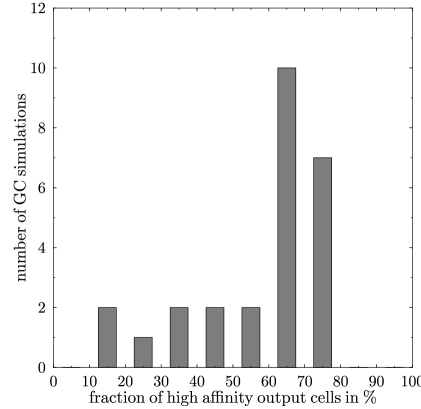
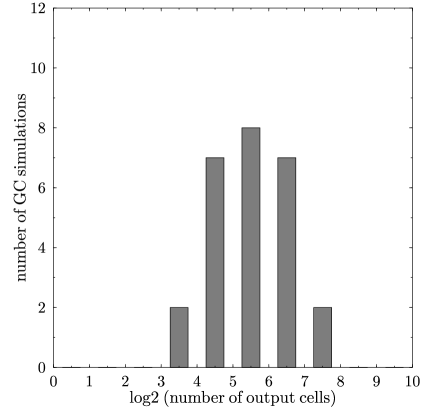
Let us have a deeper look at the regime where the GC reaction becomes critical. This is the case for seeder cells with mutation-distances from and . The same analysis as performed in Figs. 3 and 5 is repeated taking into account the corresponding GC simulations only. The result is shown in Fig. 6. The all-or-none behavior seen before has disappeared. The distribution of GCs with respect to the fraction of high affinity output cells is peaked at and flat for smaller fractions. In the case of the number of output cells the distribution of GC reactions is clearly peaked at about 50 cells in a Gaussian-like shape. This is the result expected if the all-or-none behavior of GCs is indeed correlated to the seeder cell quality. If, considering a small window of mutation-distances for the seeder cells, the all-or-none behavior still appeared as it did in Figs. 3 and 5, the reason for the all-or-none behavior would have to be looked for somewhere else in the GC dynamics.
4 Discussion
The present analysis has revealed that the seeder cell quality (measured as the mutation-distance to the optimal clone) determines the fate of the GC reaction and is responsible for the all-or-none development of GC reactions as observed in experiments. The efficiency of the GC reaction has been measured quantitatively and qualitatively considering number and affinity of the produced output cells. This result implies that the repertoire of B cells in an organism determines whether the immune system may respond with GC reactions in an efficient way or not. If the repertoire is reduced under some threshold, the probability of a successful GC reaction may become critically small for some specific antigens.
However, there are some model assumptions that should be revisited. At first, the model is two-dimensional. In three dimensions the number of B cells in a fully developed GC is substantially larger. Therefore, we expect a shift of the curves in Fig. 2 and 4 to higher mutation-distances of the seeder cells. This shift is nontrivial and difficult to be estimated quantitatively because the translation from two to three dimension may also change the interaction frequency of centrocytes and FDCs.
In view of the shape space concept a possible role of key mutations may affect the results even when the key mutations are in a cold spot as in the case of NP [16]. However, one may expect that the existence of key mutations would even intensify the all-or-none behavior of GCs because the B cells are confronted with an additional critical process, namely to find the key mutation or not. Therefore, one may suspect that the sigmoidal function in Fig. 2 may even become steeper. From this perspective the present results show that the existence of key mutations is not necessary to understand the all-or-none development of GC reactions [16]. The latter follows already within a quasi-continuous affinity maturation concept.
The analysis is based on the assumption that the seeder cells are homogeneously distributed with respect to the mutation-distances to the antigen. This assumption is not essential for the outcome provided that not all activated B cells that give rise to a GC reaction always have the same mutation-distance to the antigen (see Fig. 6). It is reasonable to expect that the mutation-distance of activated B cells is basically a random parameter. Indeed, it has recently been found for T cell-dependent primary immune responses to NP, that high and low affinity B lymphocytes are equally suitable to induce GC reactions [33]. The affinity of B cells to the antigen differed by a factor of 40 in those measurements. Therefore, we expect that deviations from our assumption of homogeneity will remain sufficiently small not to affect our interpretation of the results.
An important outcome of the analysis is that the seeder cell quality does not affect the initial phase of the GC reaction (compare also [33]). One may have suspected that the GC reaction simply doesn’t start if the seeder cells have subthreshold affinity to the antigen [25] (it is assumed that the affinity is sufficient to activate some naive B cells). This possibility is not excluded by the present analysis, as there may be some process, which is not included in the model, but which is crucial for the initiation of the GC reaction. However, our computer experiment shows that the all-or-none behavior can be understood on the level of the efficiency of GC reactions without postulating an additional process during the initiation of the GC reaction.
This result is in accordance with observations of T cell independent GC reactions [23, 26]. Here, it has been found that GCs develop normally in absence of T cell help. Even the dark and light zones are established [26]. As T cells are believed to be of great importance for the selection process (especially to inhibit apoptosis of centrocytes [34, 35, 36]) the author claimed that the initial phase is basically independent of T cell help. In the present context, this implies that provided that B cells have been activated by the antigen, they may induce a GC reaction independently of their affinity to the antigen (note that assuming a preselection process of un-mutated B cells [6], this statement applies to positively pre-selected B cells). In a later phase of the GC reaction the T cell help is crucial for centrocytes to survive and, consequently, the already well established GCs are rapidly depleted without T cells [23, 26]. The same happens in the present simulations but for a different reason: While in T cell independent GC reactions the selection process cannot start at all, bad quality seeder cells may still allow for a weak selection process, which is, however, insufficient to achieve a successful affinity maturation process. In both scenarios – in T cell independent GCs and for GCs initiated by low quality seeder cells – the GCs die out because of a failing selection procedure.
The differences of GC responses to two similar (but non-identical) peptides (PS1CT3 and G32CT3) have been examined [25]. The authors found that the intensity of a GC reaction is dependent on the used peptide and, consequently, dependent on the quality of the initially activated B cells. The results found here support these findings, and, in addition, specify the character of this dependence: The seeder cell quality induces an all-or-none behavior of the GC reaction intensity.
References
- [1] MacLennan, I. / Gray, D., Antigen-driven selection of virgin and memory B cells. Immunol. Rev. 91 (1986), 61.
- [2] Berek, C. / Berger, A. / Apel, M., Maturation of the immune response in the germinal center. Cell 67 (1991), 1121-1129.
- [3] Jacob, J. / Kelsoe, G. / Rajewski, K. / Weiss, U., Intraclonal generation of antibody mutants in germinal centres. Nature 354 (1991), 389.
- [4] Nossal, G., The molecular and cellular basis of affinity maturation in the antibody response. Cell 68 (1991), 1-2.
- [5] Jacob, J. / Przylepa, J. / Miller, C. / Kelsoe, G., In situ studies of the primary response to (4-hydroxy-3-nitrophenyl)acetyl. III. The kinetics of V region mutation and selection in germinal center B cells. J. Exp. Med. 178 (1993), 1293-1307.
- [6] McHeyzer-Williams, M.G. / McLean, M.J. / Labor, P.A. / Nossal, G.V.J., Antigen-driven B cell differentiation in vivo. J. Exp. Med. 178 (1993), 295-307.
- [7] Pascual, V. / Liu, Y.-J. / Magalski, A. / De Bouteiller, O. / Banchereau, J. / Capra, J.D., Analysis of somatic mutation in five B cell subsets of human tonsil. J. Exp. Med. 180 1994, 329-339.
- [8] Hanna, M.G., An autoradiographic study of the germinal center in spleen white pulp during early intervals of the immune response. Lab. Invest. 13 (1964), 95-104.
- [9] Zhang, J. / MacLennan, I.C.M. / Liu, Y.J. / Land, P.J.L., Is rapid proliferation in B centroblasts linked to somatic mutation in memory B cell clones. Immunol. Lett. 18 (1988), 297-299.
- [10] Liu, Y.J. / Zhang, J. / Lane, P.J. / Chan, E.Y. / MacLennan, I.C.M., Sites of specific B cell activation in primary and secondary responses to T cell-dependent and T cell-independent antigens. Eur. J. Immunol. 21 (1991), 2951-2962.
- [11] Berek, C. / Milstein, C., Mutation drift and repertoire shift in the maturation of the immune response. Immunol. Rev. 96 (1987), 23-41.
- [12] Choe, J. / Li, L. / Zhang, X. / Gregory, C.D. / Choi, Y.S., Distinct Role of Follicular Dendritic Cells and T Cells in the Proliferation, Differentiation, and Apoptosis of a Centroblast Cell Line, L3055. J. Immunol. 164 (2000), 56-63.
- [13] Liu, Y.J. / Barthelemy, C. / De Bouteiller, O. / Banchereau, J., The differences in survival and phenotype between centroblasts and centrocytes. Adv. Exp. Med. Biol. 355 (1994), 213-218.
- [14] Liu, Y.J. / Joshua, D.E. / Williams, G.T. / Smith, C.A. / Gordon, J. / MacLennan, I.C., Mechanism of antigen-driven selection in germinal centres. Nature 342 (1989), 929-931.
- [15] Koopman, G. / Keehnen, R.M. / Lindhout, E. / Zhou, D.F. / de Groot, C. / Pals, S.T., Eur. J. Immunol. 27 (1997), 1-7.
- [16] Radmacher, M.D. / Kelsoe, G. / Kepler, T.B., Predicted and Inferred Waiting-Times for Key Mutations in the Germinal Center Reaction – Evidence for Stochasticity in Selection. Immunol. Cell Biol. 76 (1998), 373-381.
- [17] Pascual, V. / Cha, S. / Gershwin, M.E. / Capra, J.D. / Leung, P.S.C., Nucleotide Sequence Analysis of Natural and Combinatorial Anti-PDC-E2 Antibodies in Patients with Primary Biliary Cirrhosis. J. Immunol. 152 1994, 2577-2585.
- [18] Smith, K. / Light, A. / Nossal, G. / Tarlington, D., The extent of affinity maturation differs between the memory and antibody-forming cell compartments in the primary immune response. EMBO J. 16 (1997), 2996-3006.
- [19] Choe, J. / Choi, Y.S., IL-10 Interrupts Memory B-Cell Expansion in the Germinal Center by Inducing Differentiation into Plasma-Cells. Eur. J. Immunol. 28 (1998), 508-515.
- [20] Siepmann, K. / Skok, J. / van Essen, D. / Harnett, M. / Gray, D., Rewiring of CD40 is necessary for delivery of rescue signals to B cells in germinal centres and subsequent entry into the memory pool. Immunol. 102 (2001), 263-272.
- [21] Camacho, S.A. / Kosco-Vilbois, M.H. / Berek, C., The Dynamic Structure of the Germinal Center. Immunol. Today 19 (1998), 511-514.
- [22] Meyer-Hermann, M., A Mathematical Model for the Germinal Center Morphology and Affinity Maturation. J. Theor. Biol. 216 (2002), 273-300.
- [23] Lentz, V.M. / Manser, T., Germinal centers can be induced in the absence of T cells. J. Immunol. 167 (2001), 15-20.
- [24] Kleinstein, S.H. / Singh, J.P., Toward quantitative simulation of germinal center dynamics: Biological and modeling insights from experimental validation. J. Theor. Biol. 211 (2001), 253-275.
- [25] Agarwal, A. / Nayak, B.P. / Rao, K.V.S., B-Cell Responses to a Peptide Epitope. VII. Antigen-Dependent Modulation of the Germinal Center Reaction. J. Immunol. 161 (1998), 5832-5841.
- [26] de Vinuesa, C.G. / Cook, M.C. / Ball, J. / Drew, M. / Sunners, Y. / Cascalho, M. / Wabl, M. / Klaus, G.G.B. / MacLennan, C.M., Germinal centers without T cells. J. Exp. Med. 191 (2000), 485-493.
- [27] Meyer-Hermann, M., Recycling Probability and Dynamical Properties of Germinal Center Reactions. J. Theor. Biol. 210 (2001), 265-285.
- [28] Perelson, A.S. / Oster, G.F., Theoretical Studies of Clonal Selection: Minimal Antibody Repertoire Size and Reliability of Self-Non-self Discrimination. J. Theor. Biol. 81 (1979), 645-670.
- [29] Weigert, M. / Cesari, I. / Yonkovitch, S. / Cohn, M., Variability in the light chain sequences of mouse antibody. Nature 228 (1970), 1045-1047.
- [30] Küppers, R. / Zhao, M. / Hansmann, M.L. / Rajewsky, K., Tracing B Cell Development in Human Germinal Centers by Molecular Analysis of Single Cells Picked from Histological Sections. EMBO J. 12 (1993), 4955-4967.
- [31] Wedemayer, G.J. / Patten, P.A. / Wang, L.H. / Schultz, P.G. / Stevens, R.C., Structural insights into the evolution of an antibody combining site. Science 276 (1997), 1665-1669.
- [32] Han, S.H. / Hathcock, K. / Zheng, B. / Kepler, T.B. / Hodes, R. / Kelsoe, G., Cellular Interaction in Germinal Centers: Roles of CD40-Ligand and B7-1 and B7-2 in Established Germinal Centers. J. Immunol. 155 1995, 556-567.
- [33] Shih, T.-A. Y. / Meffre, E. / Roederer, M. / Nussenzweig, C., Role of BCR affinity in T cell-dependent antibody responses in vivo. Nature Immunol. 3 2002, 570-575.
- [34] Choe, J. / Kim, H.S. / Zhang, X. / Armitage, R.J. / Choi, Y.S., Cellular and molecular factors that regulate the differentiation and apoptosis of germinal center B cells. Anti-Ig down-regulates Fas expression of CD40 ligand-stimulated germinal center B cells and inhibits Fas-mediated apoptosis. J. Immunol. 157 (1996), 1006-1016.
- [35] Hollmann, C. / Gerdes, J., Follicular Dendritic Cells and T-Cells – Nurses and Executioners in the Germinal Center Reaction. Journal Of Pathology 189 (1999), 147-149.
- [36] van Eijk, M. / Medema, J.P. / de Groot, C., Cellular Fas-Associated Death Domain-Like IL-1-Converting Enzyme-Inhibitory Protein Protects Germinal Center B Cells from Apoptosis Durin Germinal Center Reactions. J. Immunol. 166 (2001), 6473-6476.
| Parameter | symbol | value |
|---|---|---|
| Shape space dimension | ||
| Width of Gaussian affinity weight function | ||
| Lattice constant | ||
| Radius of GC | ||
| Number of seeder cells | ||
| Diffusion constant for centroblasts | ||
| Ratio of centroblast to centrocyte radius | ||
| Diffusion constant of signal molecules | ||
| Number of FDCs | ||
| Length of FDC arms | ||
| Duration of phase of monoclonal expansion | ||
| Duration of optimization phase | ||
| Rate of proliferation (2D) | ||
| Maximal distance for CB proliferation | ||
| Mutation probability | ||
| Rate of differentiation signal production by FDCs | ||
| Rate of centroblast differentiation | ||
| Rate of FDC-centrocyte dissociation | ||
| Rate of differentiation of selected centrocytes | ||
| Probability of recycling of selected centrocytes | ||
| Rate of centrocyte apoptosis |
| mutation-distance | position | mutation path weight | ||
| 0 | 3333 | 3333 | 3333 | maximum |
| 1 | 3334 | 3343 | 3433 | maximum |
| 2 | 3335 | 3353 | 3533 | moderate |
| 2 | 3344 | 3443 | 4433 | maximum |
| 3 | 3336 | 3363 | 3633 | moderate |
| 3 | 3345 | 3453 | 4533 | maximum |
| 4 | 3346 | 3463 | 4633 | moderate |
| 4 | 3445 | 4453 | 4534 | maximum |
| 5 | 3338 | 3383 | 3833 | low |
| 5 | 3356 | 3563 | 5633 | moderate |
| 5 | 4445 | 4454 | 4544 | high |
| 5 | 3455 | 4553 | 5534 | maximum |
| 6 | 3366 | 3663 | 6633 | moderate |
| 6 | 6543 | 5436 | 4365 | maximum |
| 7 | 3466 | 4663 | 6634 | moderate |
| 7 | 4456 | 4564 | 5644 | maximum |
| 8 | 3566 | 5663 | 6635 | moderate |
| 8 | 6554 | 5546 | 5465 | maximum |
| 9 | 3666 | 6663 | 6636 | moderate |
| 9 | 6654 | 6546 | 5466 | maximum |
| 10 | 4666 | 6664 | 6646 | moderate |
| 10 | 7654 | 6547 | 5476 | maximum |
| 11 | 5666 | 6665 | 6656 | moderate |
| 11 | 7655 | 6557 | 5576 | maximum |
| 12 | 5667 | 6675 | 6756 | maximum |