A quantitative model for presynaptic free dynamics during different stimulation protocols
Abstract
The presynaptic free dynamics of neurons due to various stimulation protocols is investigated in a mathematical model. The model includes influx through voltage-dependent channels, buffering by endogenous and exogenous buffers as well as efflux through ATP-driven plasma membrane pumps and / exchangers. We want to support a specific way of modeling which starts on the level of single proteins. Each protein is represented by characteristics that are determined by single protein experiments and that are considered to be widely independent of neuron types. This allows the applications of the model to different classes of neurons and experiments. The procedure is demonstrated for single boutons of pyramidal neurons of the rat neocortex. The corresponding fluorescence measurements of Koester & Sakmann (2000, J. Physiol., 529, 625) are quantitatively reproduced. The model enables us to reconstruct the free dynamics in neurons as it would have been without fluorescence indicators starting from the fluorescence data. We discuss the different responses and find that during high-frequency stimulation an accumulation of free occurs above some threshold stimulation frequency. The threshold frequency depends on the amount of fluorescence indicator used in the experiment.
keywords:
calcium , numerical model , presynaptic terminal , fluorescence indicator , synaptic plasticity, ,
1 Introduction
is an important cellular messenger. In particular, plays a key role in synaptic transmission. For example, it triggers the secretion of neurotransmitter [1, 2] and is involved in synaptic plasticity [3] being most likely related to the neural bases of memory [4]. Important phenomena in this context are presynaptic facilitation, short-term potentiation (STP), long-term potentiation (LTP) and long-term depression (LTD). It has been shown that the induction of long-term effects (LTE) are related to a prior influx into the neuron [5].
There exist several theoretical and numerical approaches to describe intracellular calcium dynamics. Some models investigate presynaptic dynamics in response to single action potentials [6, 7, 8]. The role of free calcium in transmitter release and in synaptic facilitation has been discussed in detail [6, 9, 10, 11]. These models focus on the geometry of the presynaptic compartment and the distribution of calcium transporting proteins in the membrane. The role of intracellular organelles with the capability to store and release free calcium (e.g. endoplasmatic and sarcoplasmatic reticula) has been analyzed [12, 13, 14]. Also the role of slow and fast intracellular buffers has been investigated [15, 16]. Indeed, most of the incoming calcium ions are bound to some intracellular buffers [17], such that this issue is very important.
The philosophy of the above models is to focus on the spatial distribution of calcium ions in different compartments of the cell. The connection of calcium and transmitter release has been investigated mostly in two giant synapses: the calyx of Held [18] and the squid giant synapse [19]. For example it has been discussed for the squid giant synapse that the calcium enhancement in the direct neighborhood of the channels is related to transmitter release and facilitation [20]. To this end the channels enter this model as discrete entities. We would like to reconsider this approach on the basis of new data that are available today.
Single channel properties have become more and more available [21]. In the time of the work of Fogelson and Zucker the exact single protein currents and open dynamics were not available. Therefore, these data were modeled with some free parameters. The question we would like to address is whether we have sufficient information on single protein properties at hand in order to explicitly and quantitatively describe the activation and activity of each protein involved in the transmembrane calcium flux.
To this end we will proceed as follows:
-
•
Instead of describing large squid giant synapse we restrict ourselves in a first step to rather small synapses. We focus on the average calcium transient in the synapse and neglect the effect of calcium diffusion. This prevents us from considering LTE or synaptic facilitation in detail due to the lack of detailed spatial information on inhomogeneous calcium distributions. The average calcium transient is nevertheless an important indicator since the exact amplitude and time course of calcium, i.e. the exact shape of the calcium transient, is believed to be important for transmitter release [22]. The average calcium transient is also suitable for the analysis of the quality of a model based on single protein properties.
-
•
The calcium dynamics is described by well known ordinary differential equations. Within these equations the single protein properties are isolated and treated separately.
-
•
The model parameters concerning the behaviour of single proteins are determined on the basis of independent single protein experiments. This set of parameters will be called universal because it will be assumed that the properties of the proteins do not primarily depend on the neuron under consideration. This is surely an approximation which has to be further validated.
-
•
The model parameters concerning the specific setup of an experiment, i.e. extension of the synaptic compartment, calcium concentrations, stimulation protocol, use of fluorescence indicator, etc. are adjusted to a specific experiment measuring calcium transients in response to various stimulation protocols in single boutons of pyramidal neurons of the rat neocortex [23]. These specific parameters have to be adjusted for each experiment separately.
-
•
The remaining parameters (in our case this will be the protein densities in the membrane of the neuron) are used in order to fit the data. It is important that the number of fit parameters is minimized in order to get a suitable test of the model.
Note, that the separation of universal and specific parameters in the model opens the possibility to use the universal parameters, which have been determined once in independent experiments, for different experimental setups. On one hand, this considerably reduces the number of fit parameters and strongly restricts possible outcomes of the model. On the other hand, this allows to compare the results of different experiments using different protocols or calcium indicators. Indeed, it has been mentioned before, that the amount and type of calcium indicator changes the calcium transients in a non-negligible way [15, 16]. Therefore, we consider this model approach as a first step towards a link between different experiments opening the possibility of a comparative approach to calcium data.
Our main interest is a quantitative description of presynaptic free dynamics in response to single action potentials and to different stimulation protocols. We apply the model to single boutons of the pyramidal neurons in the rat neocortex and compare the results to the corresponding experiment [23]. This experiment provides most of the necessary informations in order to determine the specific parameters of the model. We will look for characteristics in time courses which are specific for the used stimulation protocols. Furthermore, we will analyze the influence of the calcium indicator on the results of the experiment and discuss the possibility to reconstruct the calcium transient as it would have been without indicator.
2 Methods
The intracellular free dynamics due to a predefined, time dependent membrane potential of a presynaptic neural domain is described by using a set of ordinary differential equations. This neural domain is represented by a cell membrane which separates the extracellular space from the intracellular space. Specific membrane proteins are embedded into this membrane. Some of these membrane proteins and in addition some intracellular proteins determine the dynamics of the free ions concentration [24, 25, 26].
The model geometry consists of a homogenous reaction volume (one-compartment) which is situated in a homogeneous extracellular space. We are using a spherical symmetry of the reaction volume. However, the results remain valid for other shapes provided that the surface to volume ratio is conserved. In general presynaptic boutons are relatively small, i.e. having a diameter of the order of microns [23]. In this study we assume that the process of diffusion of ions is fast enough to reach an equilibrium distribution on a time scale of one . This assumption has to be reviewed considering larger reaction volumes as found in postsynapses. Consequently, also the surface densities of membrane proteins have to be interpreted as average values over the whole reaction surface.
Starting from a cell in equilibrium the application of a depolarizing membrane potential induces a free ion current between the reaction volume and the extracellular space through diverse membrane proteins. This leads to a change of the intracellular free concentration which is represented by an ordinary differential equation
| (1) |
in analogy to other studies (see for example [27] eq.(1) or [13] eq.(9)). Every source and every sink of the free ions is determined by its own term. is the influx current density per membrane surface unit through voltage-dependent channels (VDCC) [28, 29, 30]. It directly depends on the applied membrane potential (the time dependence in Eq. (1) is noted explicitly to emphasize that is treated as input signal), and the effective reversal potential and is described in detail in section 2.1. is the efflux current density per membrane surface unit caused by ATP-driven plasma membrane pumps (PMCA) [31, 32, 33] and / exchangers (NCX) [34, 35, 36]. It depends on the free intracellular concentration and is described in detail in section 2.3. The leakage surface current density is determined by the steady state conditions and represents all currents which are not described in our model in an explicit manner and that determine the equilibrium state (section 2.6). The terms and stand for the action of endogenous and the exogenous buffers [37, 38, 39], respectively, which bind to and disengage from the free ions (see section 2.2). The geometry factor is the surface to volume ratio. It translates the current densities (, , ) into changes of free intracellular concentration. and are the valence charge of ions and the Faraday constant, respectively.
Note, that the separation of universal and specific parameters is not reflected in Eq. (1). However, in the following sections the explicit form of the currents entering the equation will be developed on the level of single membrane proteins. It is at this point that the parameter classification will be mirrored in the mathematical prescription.
2.1 influx through VDCC
The VDCC is characterized by a current-voltage relation based on both a voltage dependent current through the open pore as well as a voltage dependent opening probability [28]. We use the following description of the influx current density through VDCC [40]
| (2) |
is weighted with the surface density of the channels being the most important cell-type specific parameter. Practically all other parameters defining the single channel properties belong to the class of universal parameters. The current through the open pore is driven by the electrochemical gradient over the membrane [41, 42]. A current caused by changes of the membrane potential is followed by changes of the intracellular concentration and these retroact on the current. The current due to the membrane potential gradient is approximated by a linear voltage-current relation with open pore conductivity . This is justified for physiologically relevant membrane potentials for which the VDCC current-voltage relation has been found to be indeed nearly linear [43, 44, 45]. The important potential difference entering Eq. (2) is the one relative to the reversal potential which dynamically incorporates the concentration gradient over the membrane into the model using Nernst equation [46]
| (3) |
is the molar gas constant and is the absolute temperature. stands for the external concentration. corrects the exact reversal potential for the linear approximation. As it has been found that efflux currents through VDCC at voltages above the reversal potential are negligible [47, 48] we set for . Independently from the definition of the reversal potential by the Nernst equation it should be mentioned that its dependency has only minor effects on the dynamics. Note that the exact value of may depend on the ion concentrations in each cell.
The time dependence of the single channel open probability is modeled by a single exponential approximation
| (4) |
which may be related to experiment using data for the average number of open channels in an ensemble of channels [43, 45, 49]. The open probability approaches its asymptotic value with a time constant . is different for each membrane potential and is described by a sigmoidal function
| (5) |
2.2 buffering via endogenous and exogenous buffers
The main part of the intracellular is bound to an endogenous buffer [17, 50, 51]. In addition, also a fluorescence indicator used in experiments acts as an exogenous buffer [52]. In the rest state of the neuron the amount of free buffers is still large enough such that during stimulation the dominant part of incoming free ions bind to these buffers [17]. The steadily ongoing binding and dissociation process of and buffers strongly influence the resulting free dynamics. This applies not only to the phase of growing concentration during stimulation but also to the return of the concentration to the base level. Therefore, we include both types of buffers explicitly in the model using the following kinetic equations
| (6) |
for the endogenous and exogenous buffer [8, 13, 53]. Here, and are the concentrations of bound buffers, and are the total concentrations of the intracellular buffer proteins. and are the rate constants in units of and , respectively. As we do not take diffusion into account, we neglect all spatial effects of mobile buffers. Also all effects related to different types of buffers are neglected. Note, that the source and the sink terms for the buffers (Eq. (6)) are the sink and the source terms, respectively, for the dynamics (Eq. (1))
| (7) |
The rate constants are in general not available from experiment. We use the realistic assumption that the buffer dynamics takes places on short time scales compared to the dynamics, i.e. that the buffer dynamics is always in a quasi steady state (rapid buffer approximation [15, 17, 54]). Note, that we neglect low affinity endogenous buffers in the present model. The rapid buffer approximation has two important consequences. First, on the short time scale the bound endogenous and exogenous buffer concentrations become constant and can be written as
| (8) |
This implies that the bound buffer concentration is adapted instantaneously to the free concentration at each time point Therefore, we have
| (9) |
| (10) |
and are dimensionless variables:
| (11) |
and is a correction factor in Eq. (10) which depends only on the free concentration. The great technical advantage of this approximation [53] is that Eq. (10) only involves the dissociation constants of the buffers instead of both rate constants and . In general the dissociation constants are available from experiment.
2.3 efflux through PMCA and NCX
The PMCA and the NCX are proteins which actively transport ions through the membrane [55, 34] and therefore have to be described differently from pores. The PMCA pumps ions against the electrochemical gradient using the energy of ATP molecules. The NCX transports ions out of the neuron by exchanging them with ions. The dependence of the PMCA-kinetics observed in experiments is well described by the Hill equation [56, 57, 58]. The activity of the PMCA and the NCX is limited to a maximum rate [59, 34, 35] which follows from the molecular structure of the proteins. Correspondingly, the free efflux in Eq. (1) gets the form
| (12) |
This is again formulated on the single protein level, where represent the specific surface densities of the membrane proteins and the universal maximum activity rates of the PMCA and the NCX, respectively. For the universal activity characteristics we assume Hill equations
| (13) |
which directly depend on the free concentration [60]. are the half activation concentrations and the Hill coefficients. This is justified in the case of PMCA [56] while no explicit measurements exist in the case of NCX. Nevertheless, it is a reasonable assumption that the principal behavior is also well described by a Hill equation.
2.4 Universal properties of the model
The classification of the model parameters represents an important element of our model because it enables us to separate those properties which are basically independent of the cell-type from those which are sensitive for differences between cell-types, compartments, and experimental setups. The universal properties of the proteins are postulated to remain invariant for all kinds of neurons and we extracted these values from various single-protein experimental results. The values of universal parameters for VDCC, PMCA and NCX as used in the model are summarized in Tab. 1.
| value | references |
|---|---|
| VDCC | |
| [44] | |
| [44] | |
| [44] | |
| [43] | |
| [44] | |
| PMCA | |
| [56],[61] | |
| [56] | |
| [56] | |
| NCX | |
| [62] | |
| see text | |
| [34] | |
VDCC. These channel-proteins are multi-subunit complexes which form a voltage sensitive transmembrane pore. Six types of VDCC are known, corresponding to the pharmacological properties (i.e. L-, N-, P/Q-, R-type as high-voltage-activated (HVA) channels and T-type as low-voltage-activated (LVA) channels. These types are primarily characterized by genes encoding a different subunit (e.g. the subunit) but an overall matching percentage of nearly (for HVA channels only) [63]. The influx into the presynaptic terminal is dominated by the P/Q- and N-type channels [23]. Each type of VDCC should have the same biophysical properties in all kinds of tissues and animals. Unfortunately the actual precision of the experiments, especially taking into account the variety of experimental setups, does not allow to quantitatively identify the biophysical properties corresponding to each channel type [64, 65, 43]. The resulting uncertainties dominate the differences between the channel types. Therefore, we chose the values from one single channel measurement of N-type channels considering it as a representative member for the VDCC. However, if more conclusive values for different VDCC-types are found in future we may disentangle the influence of different sub-types on transients. Concerning the measurements of the P/Q- and N-type channels two additional problems exist. Most measurements were performed with as carrier ion and the obtained conductivity differs from the conductivity [64]. Additionally all measurements were made at room temperature () and the biophysical properties are temperature dependent [66, 67]. Thus, the obtained influx through the VDCC differs between measurements made at room temperature from those which were made at blood temperature. We neglect both deviations because we could neither find convincing extrapolations of the temperature behaviour nor a sufficient relation of different charge carrier ions. Anyhow, those deviations stay within the current experimental accuracy.
PMCA. There exist four different genes which encode the PMCA (PMCA1-4) and all of them occur in different splicing variants (labeled by small letters). These iso-forms have different kinetic properties but again we assume that one iso-form should have the same properties in each type of tissues and animal. The dominant iso-forms of PMCA in the rat brain are the 1a-, 2a-, 2b-, 3a-, 3b-, and 4b-type [32, 68, 69]. Similarly to the VDCC the measured kinetic properties vary considerably due to the different experimental conditions for one type of PMCA [70, 56, 71] and we chose as representative member the PMCA2a protein. The Hill coefficient and the concentration of half activation are taken from a measurement for rat PMCA [56] and the maximum pump current is calculated from [56, 61]. We neglect other regulation mechanisms of the PMCA-activity e.g. the roles of calmodulin or of ATP (which is considered to be available to a sufficient degree).
NCX. In the case of the NCX three different genes (NCX1-3) with different splicing variants are known. Here, we do not specify the type of NCX. We chose average values for the maximum current [62] and for the concentration of half activation [34], and set the Hill coefficient of the NCX to one. It is worth emphasizing that our results are not significantly altered for other Hill coefficient. Other regulation mechanisms (e.g. the dependence on ) are not considered in the model.
2.5 Specific properties of the model
Per definition the specific parameters have to be adjusted to the specific neuron type and compartment geometry in the experiment under consideration. Especially, this concerns the rest state properties (i.e. geometry factor , rest state membrane potential , rest state intracellular and extracellular concentration) which in general are indicated in the experiments. This applies not necessarily to the dissociation constant and the total concentration of the endogenous buffer. Here we chose Calmodulin as representative member of buffer molecules and we assume that the four buffer binding sites are independent. Our aim is to quantitatively compare the results of our model with experiments. Because all visualizations of dynamics in neural compartments are performed with fluorescence indicators we have to include the parameters specific for the used type of indicator. The corresponding dissociation constant can be extracted from corresponding data sheets and the indicator concentration is usually indicated in the experimental protocol.
The most critical specific parameters are the membrane protein surface densities (e.g. VDCC , PMCA ). They are rarely known for specific cell types. Even more seldom they are indicated in specific experiments. In addition measurements of protein densities are usually valid for very specific areas on the cell membrane. It is difficult to extrapolate those densities to an average density on a whole presynapse as it is used in the model. As our main interest points towards the analysis of transients in response to various stimulation protocols we proceed as follows. We use single action potential transients measured as fluorescence signal to fit the unknown protein densities. Then the values found are retained and used for the analysis of transients after other stimulation protocols. This procedure is explained in more details in section 3.1.
2.6 Equilibrium, stability and stimulation
To obtain a realistic simulation of dynamics the model has to recover a stable equilibrium state after some stimulation. That is achieved by the requirement that in the rest state of the neuron (defined by the rest membrane potential and the free rest concentration ) the leak conductivity of the membrane exactly compensates the netto current densities coming from VDCC (), PMCA and NCX ().
After application of any type of stimulation the free concentration indeed returns to the rest concentration. We did not find any instabilities of the dynamics within physiologically relevant stimulation protocols. The model results are robust against variation of any parameters on the qualitative level. Quantitatively the results are most sensitive to variations of the membrane protein surface densities and of the dissociation constant of the endogenous buffer.
For the stimulation protocols (single action potential and trains of action potentials) we use membrane potentials which are simulated with a system of coupled differential equations (Hodgkin-Huxley like, not shown here). The parameters of those equations have to be adjusted such that the stimulation shapes as found in the experiment under consideration are appropriately reproduced.
3 Results
To check if our model correctly describes the presynaptic dynamics in response to single action potentials, we tuned the model with respect to an experiment measuring the dynamics in presynaptic boutons of pyramidal neurons in the neocortex of rats [23]. The corresponding transients can be reproduced for reasonable membrane protein surface densities. Using those parameters we can calculate the dynamics due to a tetanus and compare the result to corresponding measurements [23] (see section 3.1). A qualitative discussion of transients in response to various stimulation protocols is provided in section 3.2. Finally we will quantitatively illustrate the influence of fluorescence indicators on dynamics and discuss the implications for experiments using fluorescence indicators to measure transients (see section 3.3).
3.1 Quantitative model test
At first we verify that our model can describe transients evoked by single action potentials in single presynaptic boutons from pyramidal neurons in the neocortex of rats on the basis of a very detailed corresponding fluorescence measurements [23]. The universal parameters should especially apply for this system and are used as shown in Tab. 1. The specific parameters are determined directly and indirectly by the measurement [23] and by using independent experimental results. We calculated the geometry factor with the help of a fluorescence figure of the whole bouton (Fig. 3A in [23]). We determined the dissociation constant of the endogenous buffer using the observation that approximately only of the total incoming intracellular remains free [23]. The surface density of the NCX was determined with the help of a measurement which investigates its ratio to the PMCA density [62]. The values for the specific parameters are summarized in Tab. 2. They have to be carefully interpreted as an approximation for the neuron type under consideration. Please note that only two parameters remained free to adjust the model to the experimental data: The densities of the PMCA and of the VDCC. Note, that any dependence of channel densities on intracellular [72] has not been considered here.
| value | references |
|---|---|
| geometry (steady state) | |
| [23] | |
| [23] | |
| [47] | |
| [47] | |
| protein densities (single action potential) | |
| adjusted | |
| adjusted | |
| [62] | |
| protein densities ( tetanus) | |
| adjusted | |
| adjusted | |
| [62] | |
| endogenous buffer | |
| [23] | |
| [13],[73] | |
| fluorescence indicator | |
| [23] | |
| [23] | |
| [23] | |
| adjusted | |
In general measurements in neurons use fluorescence indicators to visualize the concentration and distribution. As already pointed out such fluorescence indicators act as an exogenous buffer system which, therefore, has been included into the model prescription (see section 2.2). With the help of a complexation ansatz [23, 74, 75] we translated the simulation of the dynamics into a simulation of the fluorescence signal
| (14) |
is the relative fluorescence change, represents its maximum, and is the dissociation constant of the indicator. The properties of the used indicators (Magnesium Green (Molecular Probes)) are shown in Tab. 2. Note, that in the experiment different concentrations of indicator have been used [23].
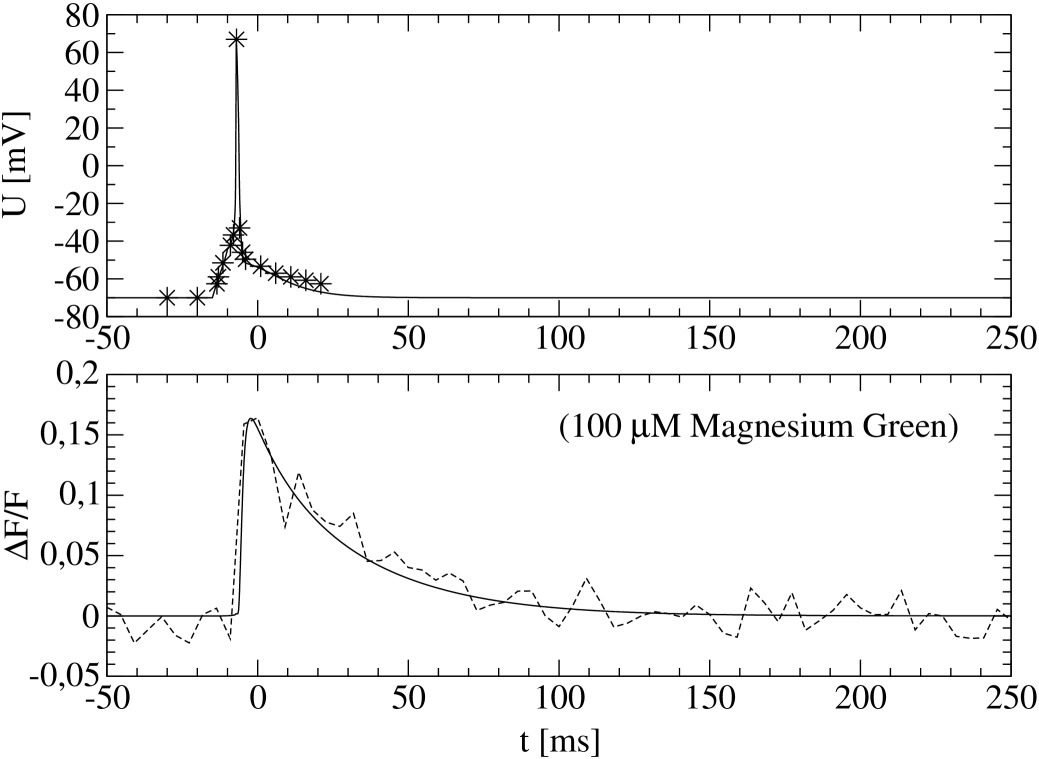
The only remaining free parameters are the surface densities of the VDCC and the PMCA . We simulate the amplitude and the shape of the action potential as applied to the presynapse in the experiment and fit the protein densities (see Tab. 2) such that the simulation result agrees with the measured fluorescence signal evoked by a single action potential (Fig. 15C in [23]). Note that the experiment has been executed with Magnesium Green and has to be chosen correspondingly (see Tab. 2). The result is shown in Fig. 1. The amplitude and the shape of the simulated fluorescence response are in good agreement with the data observed in experiment.
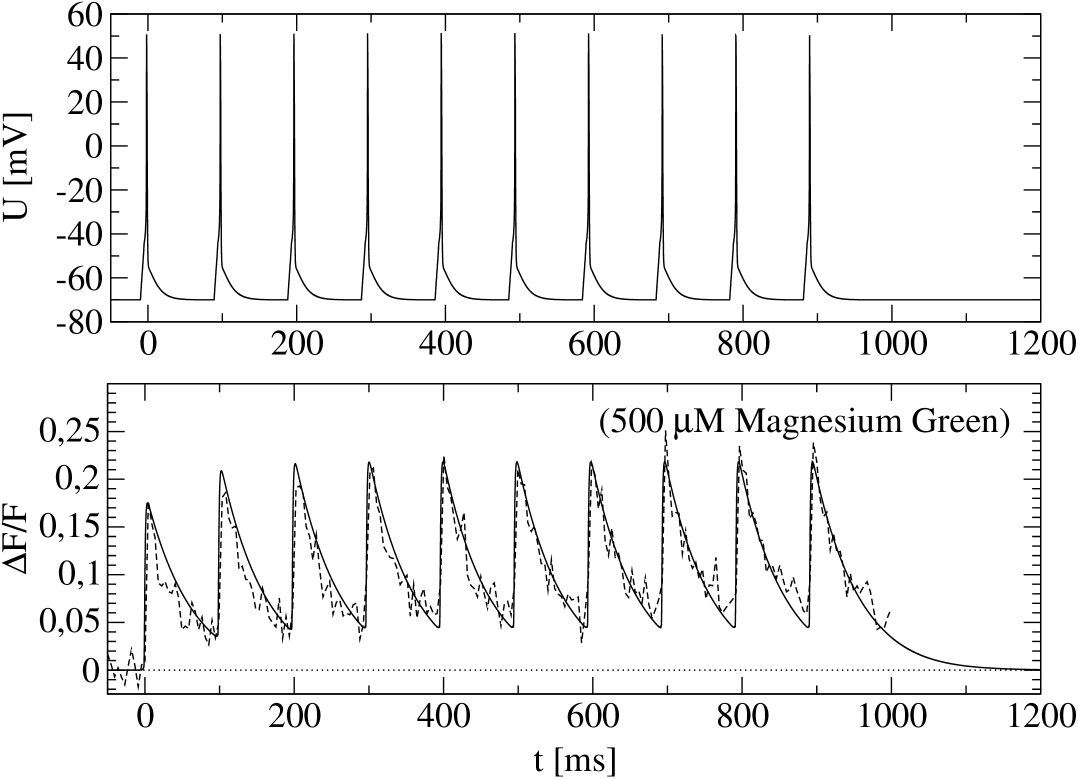
The next step is to investigate whether the same model without changing the model assumptions is able to describe transients evoked by more complex stimulation protocols. We compare the fluorescence response evoked by a tetanus to the model predictions. To this end the action potentials in the model have to be adjusted to those used in experiment (Fig. 9; upper panel in [23]). The experiment has been performed with Magnesium Green and we corrected the indicator concentration correspondingly. The maximal relative fluorescence change has not been stated explicitly. Therefore, we determine this value by the requirement that the signal in response to a single action potential (Fig. 15C; middle column in [23]) is reproduced correctly (data not shown). Finally, the protein surface densities are adjusted to reproduce the response to the first action potential of the tetanus (see Tab. 2). The subsequent signal as predicted by the model turns out to be in perfect agreement with the fluorescence signal (see Fig. 2). Note, that all others parameters of the model remained unchanged. We conclude that the model once fitted to the signal in response to single action potentials in a specific type of neuron describes the signal due to tetanus stimulation without further changes.
3.2 dynamics in response to different stimulation protocols
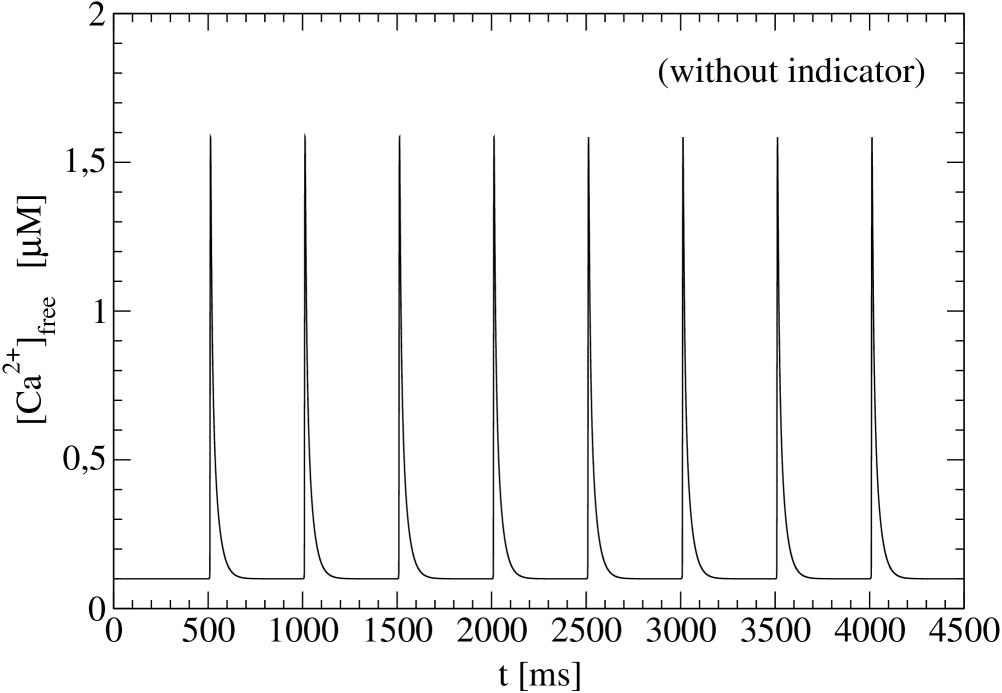
The main question we address is whether there are characteristic differences between the different transients or not. In the low frequency domain () the response appears as a train of independent single action potential responses (Fig. 3). The concentration follows the activation by each action potential. Shape and amplitude of each response is unaltered compared to the response to a single action potential. This frequencies range is typically used for LTD induction [76].
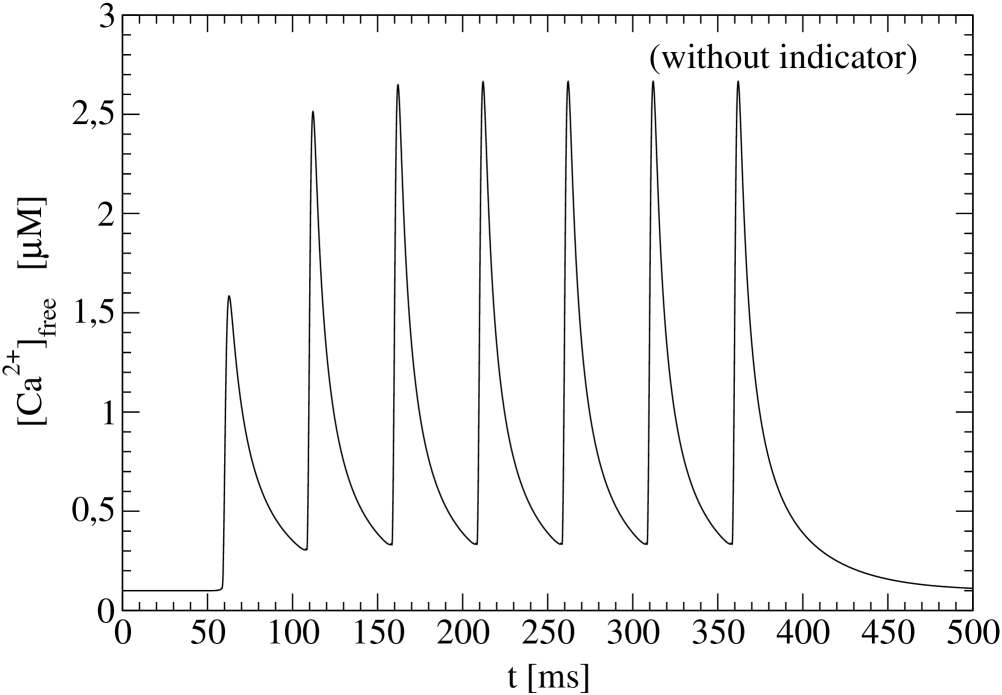
For higher frequencies () a new baseline in the concentration arises during stimulation (Fig. 4). The pumps and the / exchangers have not enough time to return the neuron into its rest state. This implies an overlap of response to subsequent action potentials. Note, that this qualitative behavior has been observed for example in experiments performed on dendritic spines of pyramidal neurons [52]. However, we can not expect that the presynaptic model also quantitatively describes the response in dendritic spines correctly (especially without including diffusion in the model).
This strong increase of the peak and baseline and especially of the average concentration for stimulations with higher frequencies is a significant difference compared to the response to a low-frequency tetanus. One may suspect that this behaviour is an important part of a process to change synaptic efficiency. For example an accumulation of residual free is responsible for synaptic facilitation in presynaptic boutons [9, 77]. Also for the induction of LTP it is well established fact, that the intensity of stimulation protocols have to overcome some threshold [76]. The strong increase of the concentration emerges for frequencies that are in the same range as this threshold [78, 79]. This hypothesis also agrees with the experimental fact that a modest influx causes LTD, whereas a large influx triggers LTP [76, 80]. In general the role of enhanced average concentrations for changes of synaptic efficiency has been pointed out by [81]. In order to look for a specific key of a concrete induction process of one of the different forms of synaptic plasticity one has to consider the synapse in more detail. For instance exocytosis steps [82], buffer properties [83], diffusion effects [84] and protein kineses [85] are important elements of the induction machinery. This is a task for future modeling work.
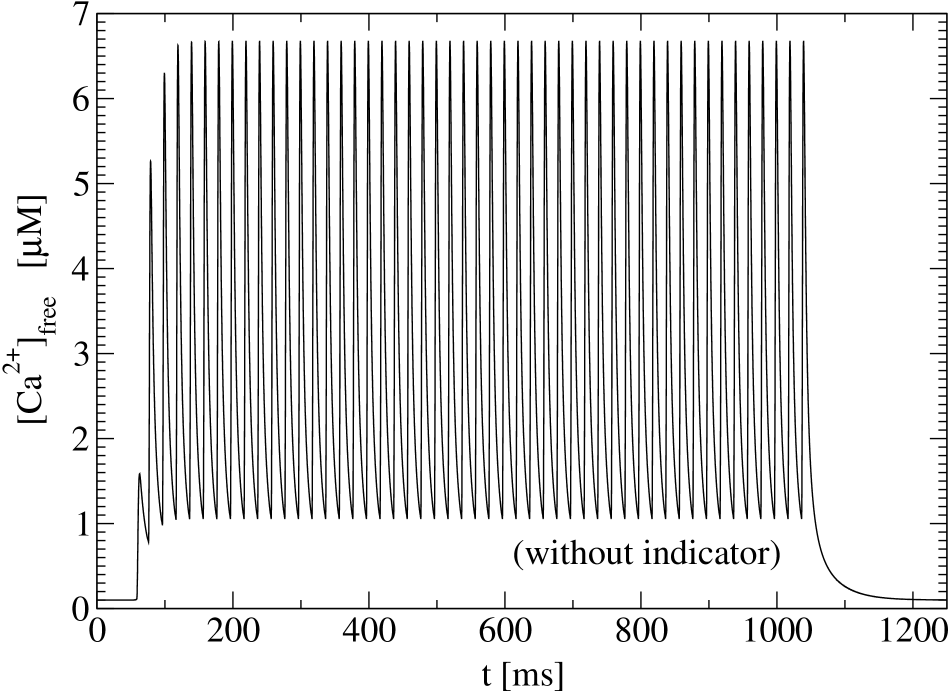
During the application of a high-frequency tetanus () the induced spikes remain in phase with the stimulating membrane potential. The enhancement of the baseline becomes even more pronounced (Fig. 5). Again the new baseline saturates during stimulation but on a higher level compared to the stimulation. The exact shape of the signal is a result of an interplay of membrane proteins and buffers. However, we observed some relations between the general appearance of the signal and some specific neuron properties. The surface density of VDCC basically determines the amplitude of the spike on the top of the baseline. The dissociation constant determines the height of the new baseline. The time scale on which the concentration returns to its rest state is governed by the surface densities of the PMCA, NCX and the dissociation constant of the buffer. We emphasize that even higher stimulation frequencies lead to still higher baseline levels of the concentration. The reached baseline grows quadratically with the stimulation frequency up to .
3.3 Fluorescence indicators disturb the intrinsic dynamics
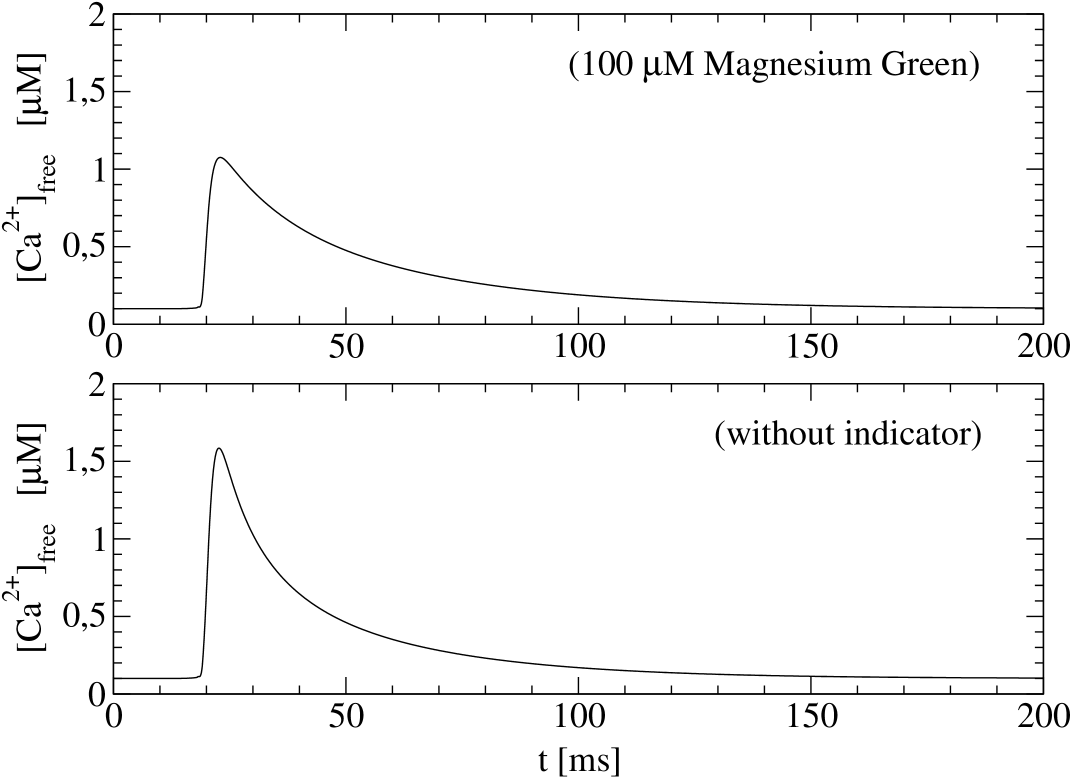
In section 3.2 we have seen that for stimulations with frequencies above some threshold frequency a new baseline of the concentration arises. In the following we show that the use of fluorescence indicators for the visualization of in experiments alters the response and especially the emergence of a new baseline considerably. In Fig. 6 the transients evoked by single action potentials with and without fluorescence indicator is compared ( Magnesium Green). The amplitude of the signal is decreased if the fluorescence indicator is used. In addition the relaxation time (needed to recover the rest concentration) becomes considerably larger using the fluorescence indicator. These relations are not surprising as the indicator binds an important part of incoming free ions and reduces the free concentration. Note, that the larger relaxation times are not caused by a decreased pump activity which is induced by the lower peak. This has consequences for the interpretation of experiments using fluorescence indicators.
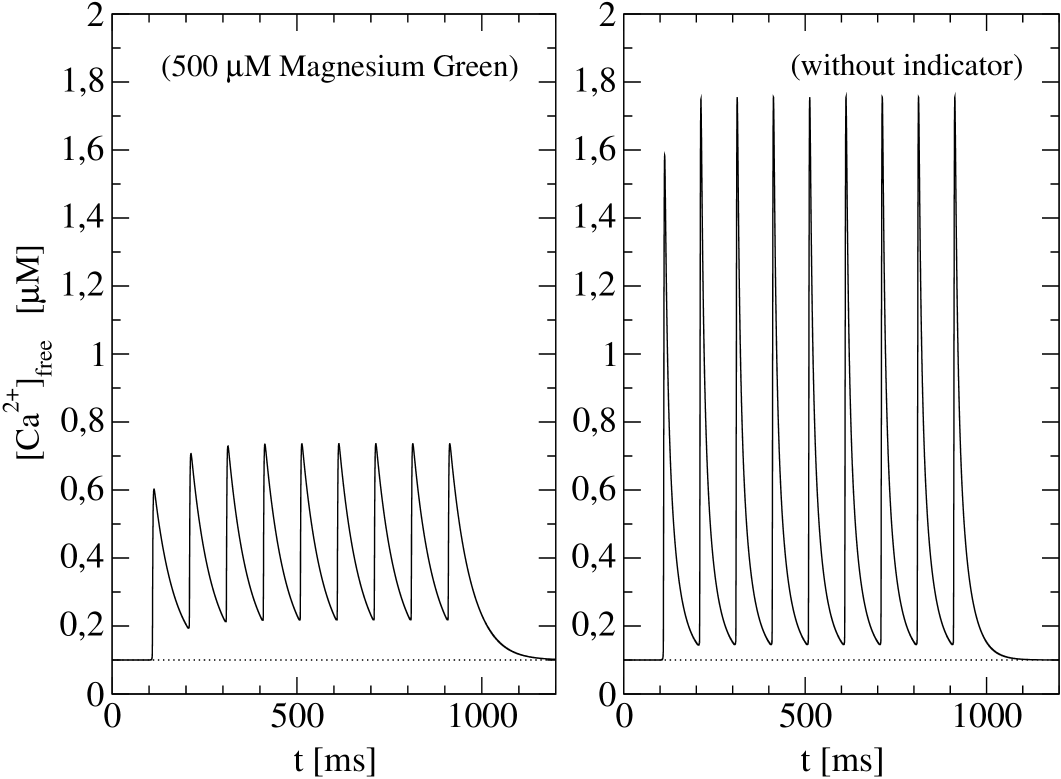
The fact that fluorescence indicators act as an additional intracellular buffer changing the shape of the calcium transient has been pointed out before [15, 16]. In Fig. 7 the influence of the fluorescence indicator ( Magnesium Green) on the transients evoked by a tetanus in a pyramidal neuron of the rat neocortex [23] is shown. The left panel (with fluorescence indicator) clearly exhibits a new baseline of the concentration whereas the baseline remains practically unchanged in the right panel (without fluorescence indicator). Because of the longer relaxation time for the spikes the fluorescence indicator facilitates the emergence of a new baseline. Using a fluorescence indicator the spikes overlap already for lower frequencies. Consequently, the threshold stimulation frequency for the emergence of a new baseline is higher for neurons without indicator compared to neurons that has been treated with indicator. A interesting conclusion from that fact is that the threshold frequency for the appearance of enhanced level changes to lower frequencies if a buffer is present. This may have implications for the induction of LTP in experiments using fluorescence indicators. Note, that the right panel in Fig. 7 provides a quantitative prediction of the signal in the pyramidal neuron of the neocortex as it would have been without the use of indicator starting from the measurement [23]. The same reconstruction procedure may be applied to other experiments in future.
4 Discussion
We developed a model for the presynaptic dynamics which includes VDCC, PMCA, and NCX, as well as endogenous buffers and fluorescence indicators. Those ingredients turned out to be sufficient to quantitatively reproduce a fluorescence measurement of intracellular free transients in response to single action potentials in pyramidal neurons of the rat neocortex. On the basis of the parameter set determined by the single action potential transients the model predicts the response to tetanus (using the same neuron type) in a quantitatively accurate way. We conclude that from the point of view of the model induced -release is not necessarily involved into the presynaptic dynamics at least for this specific type of neuron.
We would like to emphasize that the single action potential response has been produced by fitting only two parameters, i.e. the average membrane protein surface densities of the VDCC and the PMCA. All other parameters have been determined either by the experiment itself or by independent experiments. The resulting values for the VDCC density are in good agreement with experimental measured values [43]. The PMCA density in contrast turn out to be rather high but remain within a range of densities that has been observed in experiment [86]. One may think of inverting the line of argumentation and interprete the resulting protein densities as prediction for an average density on the whole bouton. In view of the difficulties to measure such densities this provides an attractive possibility.
The classification of parameters into universal and specific ones opens the possibility to adjust the model to other experiments without altering the model pillars. The (universal) properties of the VDCC for example have been determined using corresponding single channel experiments. In this context one may think of the necessity to include more than one HVA channel type into the model instead of restricting oneself to one representative type. However, a corresponding analysis revealed that the resulting transients remain basically unchanged using two different HVA channels. We conclude that the measurement of transients does not allow to distinguish between different HVA channel subtypes. This may be different if considering LVA channels in the model.
We qualitatively investigated the general behaviour of transients in response to different stimulation protocols. For tetanus we found no characteristic feature of the signal. This agrees with the interpretation, that synaptic facilitation is triggered by calcium enhancements, while synaptic depression is a consequence of reduced release site activity [87]. We found a characteristic difference between transients in response to and stimulations. At some threshold stimulation frequency the signal does not return to its rest state level after each spike. Instead a new baseline emerges on a higher level and the spikes develop on top of this baseline. This general behaviour has also been found in postsynaptic experiments before [52]. Indeed, the strong increase in the signal for above threshold stimulation frequencies can be interpreted to correspond to the stimulation threshold for changing synaptic efficiency [10]. In other words, the emergence of an enhanced baseline and, as a consequence, of an enhanced average value and increased peak values of the concentration may be thought of as a necessary requirement for induction of changes in the synaptic efficiency. The height of the baseline increases quadratically with increasing stimulation frequencies up to frequencies for which the buffer becomes saturated with . For higher frequencies the baseline increases only linearly.
Already on the level of calcium transients averaged over the whole bouton we can confirm the result, that the endogenous and exogenous buffer concentrations as well as their saturation properties crucially shift the threshold of the stimulation frequency [10, 15, 16]. Especially, it is important to realize the strong influence of indicators on the intracellular free signal [88, 89, 90]. Therefore, we investigated this problem in the framework of the model in more details. On the level of single action potentials the use of indicator leads to considerably smaller spikes which relaxed more slowly to the rest concentration. This implies that the use of indicator shifts the above mentioned threshold stimulation frequency. Therefore, a quantitative evaluation of fluorescence measurements should always include the effect of the indicator [91, 92]. The model presented here, provides a tool to reconstruct the averaged transient as it would have bean without indicator in fluorescence measurements. This has been done in this article for the experiment of [23]. It would be interesting in future to make use of the parameter classification, to enlarge the model to calcium and buffer diffusion, and to apply the model to other experiments, especially when using other neuron types. A comparative analysis of presynaptic transients in different neurons may reveal neuron-type specific characteristics of the dynamics.
Acknowledgments
We are indebted to H. J. Koester and B. Sakmann for providing us with the fluorescence data [23].
References
- [1] R. Llinas, I. Z. Steinberg, K. Walton, Relationship between presynaptic calcium current and postsynaptic potential in squid giant synapse, Biophys. J. 33 (1981) 323–351.
- [2] B. Katz, The Release of Neuronal Transmitter Substances, Liverpool university press, Liverpool, 1969.
- [3] T. V. Bliss, G. L. Collingridge, A synaptic model of memory: long-term potentiation in the hippocampus, Nature 361 (1993) 31–39.
- [4] J. Z. Tsien, Linking hebb’s coincidence-detection to memory formation, Curr. Opin. Neurobiol. 10 (2000) 266–273.
- [5] M. Baudry, J. L. Davis, Long-Term Potentiation. (Vol.1-3), The MIT Press, Cambridge MA, London, 1991, 1994, 1996.
- [6] S. R. Sinha, L. G. Wu, P. Saggau, Presynaptic calcium dynamics and transmitter release evoked by single action potentials at mammalian central synapses, Biophys. J. 72 (1997) 637–651.
- [7] F. Helmchen, J. G. Borst, B. Sakmann, Calcium dynamics associated with a single action potential in a cns presynaptic terminal, Biophys. J. 72 (1997) 1458–1471.
- [8] B. L. Sabatini, W. G. Regehr, Optical measurement of presynaptic calcium currents, Biophys. J. 74 (1998) 1549–1563.
- [9] A. L. Fogelson, R. S. Zucker, Presynaptic calcium diffusion from various arrays of single channels. implications for transmitter release and synaptic facilitation, Biophys. J. 48 (1985) 1003–1017.
- [10] A. Rozov, N. Burnashev, B. Sakmann, E. Neher, Transmitter release modulation by intracellular ca2+ buffers in facilitating and depressing nerve terminals of pyramidal cells in layer 2/3 of the rat neocortex indicates a target cell-specific difference in presynaptic calcium dynamics, J. Physiol. 531 (2001) 807–826.
- [11] R. L. Cooper, J. L. Winslow, C. K. Govind, H. L. Atwood, Synaptic structural complexity as a factor enhancing probability of calcium-mediated transmitter release, J. Neurophysiol. 75 (1996) 2451–2466.
- [12] J. Keizer, G. D. Smith, S. Ponce-Dawson, J. E. Pearson, Saltatory propagation of ca2+ waves by ca2+ sparks, Biophys. J. 75 (1998) 595–600.
- [13] A. Schiegg, W. Gerstner, R. Ritz, J. L. van Hemmen, Intracellular ca2+ stores can account for the time course of ltp induction: a model of ca2+ dynamics in dendritic spines, J. Neurophysiol. 74 (1995) 1046–1055.
- [14] E. DeSchutter, P. Smolen, Calcium Dynamics in large neuronal Models. In: C Koch and I Segev, Methods in Neuronal Modeling, The MIT Press, Cambridge MA, London, 1998.
- [15] G. D. Smith, J. Wagner, J. Keizer, Validity of the rapid buffering approximation near a point source of calcium ions, Biophys. J. 70 (1996) 2527–2539.
- [16] V. Matveev, A. Sherman, R. S. Zucker, New and corrected simulations of synaptic facilitation, Biophys. J. 83 (2002) 1368–1373.
- [17] E. Neher, G. J. Augustine, Calcium gradients and buffers in bovine chromaffin cells, J. Physiol. 450 (1992) 273–301.
- [18] C. J. Meinrenken, J. G. Borst, B. Sakmann, Calcium secretion coupling at calyx of held governed by nonuniform channel-vesicle topography, J. Neurosci. 22 (2002) 1648–1667.
- [19] R. Llinas, The squid giant synapse, Oxford, New York, 1999.
- [20] R. S. Zucker, A. L. Fogelson, Relationship between transmitter release and presynaptic calcium influx when calcium enters through discrete channels, Proc. Natl. Acad. Sci. U S A 83 (1986) 3032–3036.
- [21] B. Sakmann, E. Neher, Single-Channel Recording, Kluwer, Academic Publishers, 1995.
- [22] E. F. Barrett, C. F. Stevens, The kinetics of transmitter release at the frog neuromuscular junction, J. Physiol. 227 (1972) 691–708.
- [23] H. J. Koester, B. Sakmann, Calcium dynamics associated with action potentials in single nerve terminals of pyramidal cells in layer 2/3 of the young rat neocortex, J. Physiol. 529 (2000) 625–646.
- [24] R. R. Llinas, Calcium in synaptic transmission, Sci. Am. 247 (1982) 56–65.
- [25] E. Carafoli, Calcium signaling: a tale for all seasons, Proc. Natl. Acad. Sci. USA 99 (2002) 1115–1122.
- [26] J. Magee, D. Hoffman, C. Colbert, D. Johnston, Electrical and calcium signaling in dendrites of hippocampal pyramidal neurons, Annu. Rev. Physiol. 60 (1998) 327–346.
- [27] G. D. Smith, R. J. Lee, J. M. Oliver, J. Keizer, Effect of ca2+ influx on intracellular free ca2+ responses in antigen-stimulated rbl-2h3 cells, Am. J. Physiol. 270 (1996) C939–C952.
- [28] R. W. Tsien, Calcium channels in excitable cell membranes, Annu. Rev. Physiol. 45 (1983) 341–358.
- [29] B. P. Bean, Classes of calcium channels in vertebrate cells, Annu. Rev. Physiol. 51 (1989) 367–384.
- [30] P. Hess, Calcium channels in vertebrate cells, Annu. Rev. Neurosci. 13 (1990) 337–356.
- [31] G. R. Monteith, B. D. Roufogalis, The plasma membrane calcium pump a physiological perspective on its regulation, Cell Calcium 18 (1995) 459–470.
- [32] J. T. Penniston, A. Enyedi, Modulation of the plasma membrane ca2+ pump, J. Membr. Biol. 165 (1998) 101–109.
- [33] E. Carafoli, The ca2+ pump of the plasma membrane, J. Biol. Chem. 267 (1992) 2115–2118.
- [34] M. P. Blaustein, W. J. Lederer, Sodium/calcium exchange: its physiological implications, Physiol. Rev. 79 (1999) 763–854.
- [35] E. E. Strehler, Plasma membrane ca2+ pumps and na+/ca2+ exchangers, Semin. Cell Biol. 1 (1990) 283–295.
- [36] R. DiPolo, L. Beauge, Metabolic pathways in the regulation of invertebrate and vertebrate na+/ca2+ exchange, Biochim. Biophys. Acta 1422 (1999) 57–71.
- [37] R. J. Miller, Regulation of calcium homoeostasis in neurons: the role of calcium-binding proteins, Biochem. Soc. Trans. 23 (1995) 629–632.
- [38] C. B. Klee, Ca2+-dependent phospholipid- (and membrane-) binding proteins, Biochemistry 27 (1988) 6645–6653.
- [39] W. J. Pottorf, S. P. Duckles, J. N. Buchholz, Mechanisms of calcium buffering in adrenergic neurones and effects of ageing: testing the limits of homeostasis, J. Auton. Pharmacol. 20 (2000) 63–75.
- [40] N. Volfovsky, H. Parnas, M. Segal, E. Korkotian, Geometry of dendritic spines affects calcium dynamics in hippocampal neurons: theory and experiments, J. Neurophysiol. 82 (1999) 450–462.
- [41] W. Nernst, Die elektromotorische wirksamkeit der ionen, Z. Phys. Chem. 4 (1889) 129–181.
- [42] M. Planck, ber die potentialdifferenz zwischen zwei verd nnten l sungen bin rer elektrolyte, Ann. Phys. Chem. 40 (1890) 561–576.
- [43] J. C. Magee, D. Johnston, Characterization of single voltage-gated na+ and ca2+ channels in apical dendrites of rat ca1 pyramidal neurons, J. Physiol. 487 (1995) 67–90.
- [44] R. E. Fisher, R. Gray, D. Johnston, Properties and distribution of single voltage-gated calcium channels in adult hippocampal neurons, J. Neurophysiol. 64 (1990) 91–104.
- [45] W. H. Griffith, L. Taylor, M. J. Davis, Whole-cell and single-channel calcium currents in guinea pig basal forebrain neurons, J. Neurophysiol. 71 (1994) 2359–2376.
- [46] W. Nernst, Zur kinetik der in l sung befindlichen k rper: Theorie der diffusion, Z. Phys. Chem. 3 (1888) 613–637.
- [47] B. Hille, Ionic channels in excitable membranes, Sinauer, Sunderland MA, 1992.
- [48] A. M. Brown, K. Morimoto, Y. Tsuda, D. L. Wilson, Calcium current-dependent and voltage-dependent inactivation of calcium channels in helix aspersa, J. Physiol. 320 (1981) 193–218.
- [49] T. J. O’Dell, B. E. Alger, Single calcium channels in rat and guinea-pig hippocampal neurons, J. Physiol. 436 (1991) 739–767.
- [50] P. Belan, P. Kostyuk, V. Snitsarev, A. Tepikin, Calcium clamp in isolated neurones of the snail helix pomatia, J. Physiol. 462 (1993) 47–58.
- [51] P. V. Belan, P. G. Kostyuk, V. A. Snitsarev, A. V. Tepikin, Calcium clamp in single nerve cells, Cell Calcium 14 (1993) 419–425.
- [52] F. Helmchen, K. Imoto, B. Sakmann, Ca2+ buffering and action potential-evoked ca2+ signaling in dendrites of pyramidal neurons, Biophys. J. 70 (1996) 1069–1081.
- [53] J. Wagner, J. Keizer, Effects of rapid buffers on ca2+ diffusion and ca2+ oscillations, Biophys. J. 67 (1994) 447–456.
- [54] E. Neher, Usefulness and limitations of linear approximations to the understanding of ca++ signals, Cell Calcium 24 (1998) 345–357.
- [55] E. Carafoli, The calcium pumping atpase of the plasma membrane, Annu. Rev. Physiol. 53 (1991) 531–547.
- [56] N. L. Elwess, A. G. Filoteo, A. Enyedi, J. T. Penniston, Plasma membrane ca2+ pump isoforms 2a and 2b are unusually responsive to calmodulin and ca2+, J. Biol. Chem. 272 (1997) 17981–17986.
- [57] A. K. Verma, A. Enyedi, A. G. Filoteo, E. E. Strehler, J. T. Penniston, Plasma membrane calcium pump isoform 4a has a longer calmodulin-binding domain than 4b, J. Biol. Chem. 271 (1996) 3714–3718.
- [58] M. G. Desrosiers, L. J. Gately, A. M. Gambel, D. R. Menick, Purification and characterization of the ca2+-atpase of flavobacterium odoratum, J. Biol. Chem. 271 (1996) 3945–3951.
- [59] A. J. Caride, A. R. Penheiter, A. G. Filoteo, Z. Bajzer, A. Enyedi, J. T. Penniston, The plasma membrane calcium pump displays memory of past calcium spikes. differences between isoforms 2b and 4b, J. Biol. Chem. 276 (2001) 39797–39804.
- [60] A. Zador, C. Koch, T. H. Brown, Biophysical model of a hebbian synapse, Proc. Natl. Acad. Sci. USA 87 (1990) 6718–6722.
- [61] A. Enyedi, A. K. Verma, A. G. Filoteo, J. T. Penniston, A highly active 120-kda truncated mutant of the plasma membrane ca2+ pump, J. Biol. Chem. 268 (1993) 10621–10626.
- [62] M. Juhaszova, P. Church, M. P. Blaustein, E. F. Stanley, Location of calcium transporters at presynaptic terminals, Eur. J. Neurosci. 12 (2000) 839–846.
- [63] L. Lacinova, N. Klugbauer, F. Hofmann, Low voltage activated calcium channels: from genes to function, Gen. Physiol. Biophys. 19 (2000) 121–136.
- [64] N. M. Lorenzon, R. C. Foehring, Characterization of pharmacologically identified voltage-gated calcium channel currents in acutely isolated rat neocortical neurons. i. adult neurons, J. Neurophysiol. 73 (1995) 1430–1442.
- [65] A. Tottene, A. Moretti, D. Pietrobon, Functional diversity of p-type and r-type calcium channels in rat cerebellar neurons, J. Neurosci. 16 (1996) 6353–6363.
- [66] D. A. Coulter, J. R. Huguenard, D. A. Prince, Calcium currents in rat thalamocortical relay neurones: kinetic properties of the transient, low-threshold current, J. Physiol. 414 (1989) 587–604.
- [67] K. Takahashi, S. Ueno, N. Akaike, Kinetic properties of t-type ca2+ currents in isolated rat hippocampal ca1 pyramidal neurons, J. Neurophysiol. 65 (1991) 148–155.
- [68] A. G. Filoteo, N. L. Elwess, A. Enyedi, A. Caride, H. H. Aung, J. T. Penniston, Plasma membrane ca2+ pump in rat brain. patterns of alternative splices seen by isoform-specific antibodies, J. Biol. Chem. 272 (1997) 23741–23747.
- [69] J. Lehotsky, Plasma membrane ca2+ pump functional specialization in the brain. complex of isoform expression and regulation by effectors, Mol. Chem. Neuropathol. 25 (1995) 175–187.
- [70] A. Enyedi, A. G. Filoteo, G. Gardos, J. T. Penniston, Calmodulin-binding domains from isozymes of the plasma membrane ca2+ pump have different regulatory properties, J. Biol. Chem. 266 (1991) 8952–8956.
- [71] A. G. Filoteo, A. Enyedi, A. K. Verma, N. L. Elwess, J. T. Penniston, Plasma membrane ca2+ pump isoform 3f is weakly stimulated by calmodulin, J. Biol. Chem. 275 (2000) 4323–4328.
- [72] M. Siegel, E. Marder, L. F. Abbott, Activity-dependent current distributions in model neurons, Proc. Natl. Acad. Sci. USA 91 (1994) 11308–11312.
- [73] E. Carafoli, Intracellular calcium homeostasis, Annu. Rev. Biochem. 56 (1987) 395–433.
- [74] D. B. Jaffe, W. N. Ross, J. Lisman, N. Lasser-Ross, H. Miyakawa, D. Johnston, A model for dendritic ca2+ accumulation in hippocampal pyramidal neurons based on fluorescence imaging measurements, J. Neurophysiol. 71 (1994) 1065–1077.
- [75] G. Grynkiewicz, M. Poenie, R. Y. Tsien, A new generation of ca2+ indicators with greatly improved fluorescence properties, J. Biol. Chem. 260 (1985) 3440–3450.
- [76] J. A. Connor, J. Petrozzino, L. D. Pozzo-Miller, S. Otani, Calcium signals in long-term potentiation and long-term depression, Can. J. Physiol. Pharmacol. 77 (1999) 722–734.
- [77] M. P. Charlton, S. J. Smith, R. S. Zucker, Role of presynaptic calcium ions and channels in synaptic facilitation and depression at the squid giant synapse, J. Physiol. 323 (1982) 173–193.
- [78] J. T. Rick, N. W. Milgram, Frequency dependence of long-term potentiation and depression in the dentate gyrus of the freely moving rat, Hippocampus 6 (1996) 118–124.
- [79] E. Gamble, C. Koch, The dynamics of free calcium in dendritic spines in response to repetitive synaptic input, Science 236 (1987) 1311–1315.
- [80] S. N. Yang, Y. G. Tang, R. S. Zucker, Selective induction of ltp and ltd by postsynaptic ca2+ elevation, J. Neurophysiol. 81 (1999) 781–787.
- [81] S. Wang, J. M. Wojtowicz, H. L. Atwood, Synaptic recruitment during long-term potentiation at synapses of the medial perforant pathway in the dentate gyrus of the rat brain, Synapse 22 (1996) 78–86.
- [82] C. Rosenmund, A. Sigler, I. Augustin, K. Reim, N. Brose, J. S. Rhee, Differential control of vesicle priming and short-term plasticity by munc13 isoforms, Neuron 33 (2002) 411–424.
- [83] Y. Tang, T. Schlumpberger, T. Kim, M. Lueker, R. S. Zucker, Effects of mobile buffers on facilitation: experimental and computational studies, Biophys. J. 78 (2000) 2735–2751.
- [84] R. S. Zucker, N. Stockbridge, Presynaptic calcium diffusion and the time courses of transmitter release and synaptic facilitation at the squid giant synapse, J. Neurosci. 3 (1983) 1263–1269.
- [85] R. C. Malenka, J. A. Kauer, D. J. Perkel, M. D. Mauk, P. T. Kelly, R. A. Nicoll, M. N. Waxham, An essential role for postsynaptic calmodulin and protein kinase activity in long-term potentiation, Nature 340 (1989) 554–557.
- [86] D. Khananshvili, Structure, mechanism, and regulation of the cardiac sarcolemma na/ca exchanger, Advances in Molecular and Cell Biology 23 (1998) 311–358.
- [87] J. S. Dittman, A. C. Kreitzer, W. G. Regehr, Interplay between facilitation, depression, and residual calcium at three presynaptic terminals, J. Neurosci. 20 (2000) 1374–1385.
- [88] C. Hansel, A. Artola, W. Singer, Different threshold levels of postsynaptic ca2+ have to be reached to induce ltp and ltd in neocortical pyramidal cells, J. Physiol. Paris 90 (1996) 317–319.
- [89] C. Hansel, A. Artola, W. Singer, Relation between dendritic ca2+ levels and the polarity of synaptic long-term modifications in rat visual cortex neurons, Eur. J. Neurosci. 9 (1997) 2309–2322.
- [90] S. Williams, D. Johnston, Long-term potentiation of hippocampal mossy fiber synapses is blocked by postsynaptic injection of calcium chelators, Neuron 3 (1989) 583–588.
- [91] M. C. Nowycky, M. J. Pinter, Time courses of calcium and calcium-bound buffers following calcium influx in a model cell, Biophys. J. 64 (1993) 77–91.
- [92] D. W. Tank, W. G. Regehr, K. R. Delaney, A quantitative analysis of presynaptic calcium dynamics that contribute to short-term enhancement, J. Neurosci. 15 (1995) 7940–7952.