A Possible Role of Chemotaxis in Germinal Center Formation
Tilo Beyer, Michael Meyer-Hermann, and Gerhard Soff
Technische Universität Dresden
Institut für Theoretische Physik
D-01062 Dresden, Germany
Tel.: +49 351 463-35539
Fax.: +49 351 463-37299
E-mail: tilbey@theory.phy.tu-dresden.de
During the germinal center reaction a characteristic morphology is developed. In the framework
of a recently developed space-time-model for the germinal center a mechanism for the formation
of dark and light zones has been proposed. The mechanism is based on a diffusing differentiation signal
which is secerned by follicular dendritic cells (?). Here, we investigate a possible influence of
recently found chemokines for the germinal center formation in the framework
of a single-cell-based stochastic and discrete three-dimensional model. We will also consider
alternative possible chemotactic pathways that may play a role for the development of both zones.
Our results suggest that the centrocyte motility resulting from a follicular dendritic cell-derived
chemokine has to exceed a lower limit to allow the separation of centroblasts and centrocytes.
In contrast to light microscopy the dark zone is ring shaped. This suggests that FDC-derived
chemoattractants alone cannot explain the typical germinal center morphology.
Keywords: B cells, centroblasts, centrocytes, folliuclar dendritic cells, spatial model
1 Introduction
Germinal centers (GC) play an important role during secondary immune response (for an overview see (?)). The reaction starts with the activation of B cells by antigen (Ag) during a T cell-dependent or independent immune response (?). Within secondary lymphoid organs such as the spleen, tonsils, or lymph nodes the major part differentiates into plasma cells while a small number of activated B cells—the seeder cells—migrate into the primary follicle which now develops to a secondary follicle. There, the seeder cells develop to centroblasts (?, ?) which start to proliferate rapidly and replace the naive B cells inside a dense network of follicular dendritic cells (FDC) within 3–4 days (?, ?). At about the same time a yet unknown signal provides the centroblasts to start somatic hypermutation (?, ?) leading to a diversification of antibodies (Ab) amongst the monoclonally expanded cells (?). Several experiments suggest that the expression of Ab is suppressed on the centroblast surface (?). The centroblasts differentiate into smaller apoptotic centrocytes which express Ab to a higher degree (?, ?). To rescue centrocytes from programmed cell death they first have to interact with Ag presenting FDCs (?, ?, ?). In order to do so the centrocyte has to present an Ab with high affinity for the Ag. If the interaction is successful centrocytes are positively selected. Furthermore they have to pass a second checkpoint where T cells test for autoimmune reaction and provide signals for further differentiation either into plasma cells or memory cells (?, ?). The process of somatic hypermutation together with those two stages of selection lead to affinity maturation, i.e. to an optimization of Abs (?).
During the GC reaction a characteristic morphology occurs. When the processes of somatic hypermutation and differentiation of centroblasts to centrocytes have started basically two specific areas can be seen in the GC around day 5: a centroblast rich dark zone and a light zone primarily filled with centrocytes (?, ?, ?, ?). Until now it has not been resolved which mechanisms lead to the separation of both cell types. In the framework of a recent model for the GC morphology it has been shown that a slowly diffusing signal which is secerned by FDCs and consumed by centroblasts, indeed, leads to the intermediate development of dark and light zones as observed in experiment (?).
The importance of an intermediatly appearing dark zone for affinity maturation has been emphasized. The two zones remain for at least a few days before the light zone enriches with centroblasts and the GC is homogeneously filled with centroblasts and centrocytes (?). The total cell number than decreases until the whole GC reaction stops about 3 weeks after initiation and only a few centroblasts remain (?, ?).
Today the model mentioned above (?) is the only one considering spatial aspects of the GC reaction. Many other models deal exclusively with kinetic aspects or affinity maturation (?, ?, ?, ?, ?). In this article we will present the first three-dimensional model of the GC reaction. The model is lattice-based and includes chemotaxis as well as a more detailed spatial resolution. We discuss several known chemotactic pathways which may play an essential role for GC formation (?, ?, ?, ?, ?, ?, ?, ?).
2 The Model
To represent a GC in a spatial model we have taken into account three important concepts which are mirrored in the following three subsections: antibodies and antigen, the dynamics of cell-cell interactions, and the spatial distribution of cells. In all cases we want to stay as close as possible to experimental results. Of course there are still unknown parameters. One part of them are physiological parameters which are not yet measured or which are not determined consistently in experiments. A second part consists of model parameters that have no direct physiological correspondence but have to be motivated by physiological properties. All parameter values are summarized in Table 1. The model incorporates individual cells on a three-dimensional lattice. Each cell has its unique set of properties described in the following sections.
2.1 Representation of antibody and antigen
The representation of the Ab phenotype of each cell follows the model of Perelson and Oster (?). In this model a shape space, i.e. a -dimensional finite size lattice is defined in which each point corresponds to an Ab phenotype . The Ag is represented by the complementary Ab position in the shape space. Since non-optimal Abs may also bind an Ag, the interaction between both is described by an affinity distribution function
| (1) |
where denotes the 1-norm (sum over the absolute values of the coordinates) in the shape space, is the affinity width and is the exponential weight (?). The affinity function is interpreted as probability of an Ab to bind the Ag ranging from for a perfect matching Ab to for a non-binding Ab. In this scheme hypermutation is described as a jump from an Ab position to one of possible next neighbor Ab positions . Here we do not consider key mutations which would require a description closer to the details of somatic hypermutation. This may be provided by a genetic model including hot spots and their implication for Abs. For a discussion of the influence of key mutations see (?, ?, ?). Further we do not consider effects as Ag consumption or decay (?, ?).
2.2 Germinal center dynamics
It exists a great variety of different pictures for the dynamics and morphological properties of GC reactions. In our model we want to consider a rather general and simplified perspective on a representative GC. We will concentrate on B cells and FDCs and do not model T cells, monocytes or tingible body macrophages which may also influence the morphology. It is known that GCs can develop their typical structure in the absence of T cells (?, ?, ?). The GC reaction is initiated by activated B cells which migrate into the FDC network. It has been shown that the seeder cells have at least a low affinity for the Ag which is presented by the FDCs (?). In the model this is taken into account by using an Ab position about 5 to 10 mutation steps away from the Ag position in the shape space. This is in agreement with experimental observations (?, ?).
2.2.1 Proliferation phase
When the seeder cells have entered the FDC network they receive a signal that induces a fast proliferation phase with an average cell division time of 6–7 hr (?, ?, ?, ?, ?). During the first three days of GC reaction about 3 seeder cells (?, ?) increase their number to about cells replacing the naive B cells inside the FDC network. The naive B cells form the mantle zone now (?).
Since our model is single-cell based we will not simulate the proliferation in terms of a linear differential equation with constant cell division rate. Instead, let us consider an ensemble of equal cells in the same stage of cell cycle and measure the time they need to complete the process of mitosis. Qualitatively this leads to a peak centered at the mean cell cycle time with width . As a simple ansatz we use a Gauss-function whcih leads to a proliferation rate
| (2) |
where denotes the eigentime of the cell . The eigentime describes an internal clock of the cell indicating its cell cycle status and is an individual property of each cell. We will make use of this concept throughout the model to describe time-dependent processes such as proliferation (Sec. 2.3.1), differentiation (Sec. 2.3.1), or centrocyte-FDC interaction (Sec. 2.3.3).
2.2.2 Differentiation to Centrocytes
Some experiments show that centroblasts express low levels of Abs on their surface (?). Thus selection is very unlikely to take place in terms of Ab affinity. After three days of monoclonal expansion centroblasts differentiate into centrocytes which express higher levels of Ab. Now B cells can be selected according to their affinity for the Ag presented by the FDCs (?). The first step of B cell selection within GCs is a close cell-cell interaction between centrocytes and FDCs which takes about 1–4 hours (?, ?).
It has been shown that about at the same time when the differentiation to centrocytes starts the process of somatic hypermutation is initiated in centroblasts (?, ?).
The capability of positively selected centrocytes to recycle back to centroblasts has been frequently discussed (?, ?, ?, ?). This is incorporated to the model using the recycling probability (?, ?). This implies that of all positively selected centrocytes become either plasma or memory cells. The model does not distinguish between plasma and memory cells which are denoted as output cells in the following. In fact not all centrocytes that survive the first selection step become output cells due to the last selection step taking place in interaction with T cells. So only a certain fraction of these cells will survive (?, ?, ?).
We also include a time delay between the onset of centroblast differentiation and the start of output cell production. All positively selected centrocytes are recycled during this optimization phase (?, ?, ?), which lasts until the onset of output cell production.
2.3 Spatial modeling of the germinal center
At first we consider the spatial resolution of the model. We do not need to consider the details of the cell shape since we are not primarily interested in surface properties. But we cannot neglect the volume of the cells because centroblast are more than 10-times larger than centrocytes (centroblast diameter (?), centrocyte diameter (?, ?)). If we allow only one cell per lattice point we have essentially two possibilities to choose the lattice constant. On one hand, the lattice constant can be chosen to be of the order of the centroblast diameter . This provides a well defined volume concept in the sense that one lattice point embeds a volume larger than the volume of one cell. However, this implies that a lattice area filled with centrocytes would mainly consist of empty space. On the other hand, if we choose a lattice constant equal to the centrocyte diameter we do not have problems with empty spaces but one lattice point provides not enough space for a centroblast. As a consequence, we are led to a subcellular description that would contain more information than necessary for the present purposes.
To solve this conflict we proceed as follows. The lattice constant is defined as the average of the diameters of centroblasts and centrocytes. In the following the lattice constant denotes the distance between nearest neighbor lattice points. This is a natural unit for the discretization of parameters depending on the lattice constant (such as cell velocities). To minimize effects of lattice anisotropy we choose a face centered cubic (fcc) lattice which has the highest symmetry amongst regular lattices. Second, we consider polyeders at each lattice point formed by nearest neighbor points. Within this polyeder the volume of all cells that intersect with the polyeder are summed up. We assume spherical cells and the lattice constant to be large enough to exclude an intersection of cells on second next neighbor points with the polyeder. Then, only nearest neighbors have to be considered. A cell is allowed to move to a next neighbor point if three conditions are fulfilled: the point is not occupied by another cell, there is enough volume remaining in the corresponding polyeder to take up the volume of the new cell, and the polyeders belonging to the next neighbors of the considered target point can take up the intersecting volume of the new cell.
We consider two origins for cell movement: undirectioned random movement and chemotaxis. This is incorporated into the model by separating the cell movement into an isotropic random part and a cell type-dependent deterministic part. In each timestep a randomly chosen cell is highlighted to perform a motion. All next neighbor points are checked if the cell is allowed to move to this point in the sense explained above. Then the deterministic part is calculated as a velocity vector based on chemokine concentration gradients to free next neighbor points (the calculation of the concentrations is described in section 2.3.4). If the cell responds to multiple chemokines the corresponding velocity vectors are summed up to give the resulting velocity vector . This vector is projected onto the lattice via unit vectors , where denotes all 12 possible directions of movement. The result is multiplied with the factor in order to convert it into a probability for moving to a lattice point via channel in the time interval :
| (3) |
In an analogous way we calculate a probability for undirected random movement.
| (4) |
where is the cell velocity for undirectioned movement and is the number of next neighbors in the fcc lattice. The total probability for the movement of a cell to a neighbor point using the channel is then given by
| (5) |
where is the Kronecker symbol for channel which is equal 1 if the channel is free and 0 otherwise.
In order to interprete as probability we demand and set otherwise. As only movements to next neighbor points are allowed we have to choose the time step small enough to keep . This condition depends on the highest possible cell velocity.
Knowing the probabilities of cell movement for each free channel, one of the available channels is selected by using a pseudo random number. Note, that this procedure alters the effective values for the random velocity and the chemotactic response, e.g. in the case that all next neighbor points are occupied by other cells both values are zero.
2.3.1 Representation of B cells
B cells are modeled as individual cells with several properties: position, volume , Ab phenotype , and eigentime . Each cell has a certain probability to proliferate, if it is a centroblast, or to die by apoptosis, if it is a centrocyte, which grows according to eq. (2) when the eigentime reaches the average cell division time or lifetime , respectively. The eigentime is always set to zero when the cell has proliferated, i.e. both new cells start with eigentime . The same holds true if the cell has differentiated.
Growth and differentiation of cells
Since we included the cell volume in the model we have to explain how to differentiate from large centroblasts to small centrocytes and back. If centroblasts differentiate to centrocytes additional volume around the cell becomes available which is not a real problem. But the other way round additional volume is suddenly required. In order to provide a more realistic description of cell volume we include cell growth in the model. We use an equation of the type
| (6) |
where and determine the time course of the growth process.
When a centrocyte recycles back into a centroblast it starts to grow. To ensure the volume restriction the cell may only grow if the polyeder associated to the occupied lattice point and the polyeders associated to the next neighbor points can hold the additional volume . If this is not possible the cell stops growing until the required space becomes available. Note, that this process depends on the movement and growth of cells in the vicinity. Therefore, it is important to calculate cell growth by choosing cells in a random sequence in each time step—as it is done for cell movement.
Addionally, the growth process of a recycled cell takes longer compared to a new cell emerging from mitosis because the initial volume is substantially smaller. Proliferation requires the cell to have an above threshold volume. If this is not required for the process of differentiation as well, recycled cells would preferentially differentiate and proliferation would become a rare event. However, the multiplication of high affinity B cells through recycling is an important feature of GC dynamics. Therefore, we forbid differentiation of a recycled centroblast until it reaches the volume of a freshly proliferated cell.
The differentiation of centroblasts to centrocytes is assumed to occur with a constant rate after activation by a quantum of signal molecules (?, ?). The influence of spatial inhomogeneous differentiation signals on the GC morphology has been been studied before (?). We want to exclude a spatial inhomogeneity of signal molecules in order to avoid an interference with the chemotactic response of GC B cells. Therefore we introduce a homogeneous density of quanta of signal molecules . A centroblast consumes such quanta with a rate proportional to this density . One quantum of signal molecules is assumed to contain enough molecules to induce the differentiation process. The centroblast then differentiates with rate . The signal quanta are produced with rate from day 3 on.
In order to perform the differentiation process the cell ’shrinks’ to the proper centrocyte volume and acquires all characteristic properties as the ability to interact with FDCs and the initiation of the process of apoptosis. The cell is assumed to be already able to respond to chemokines before the typical centrocyte volume has been reached.
The constants and in eq. (6) have to be specified yet. The exponent describes the volume dependence of the growth process and is determined to be according to observations made for many different organisms (?). The coefficient is chosen for the process of shrinking and growing separately. In the case of cell shrinking is determined by the time a centroblast needs to fully differentiate into a centrocyte. Unfortunately this time is not known but seems to be substantially smaller than 7 hr (?, ?). Therefore, we assume . In the case of cell growth we chose in respect to the proliferation of centroblasts. The centroblast volume is doubled during the G1-phase of the cell cycle. We assume the duration of the G1-phase to be of the order of . It results
| (7) |
for the process of growing ( denotes the maximum centroblast volume), and
| (8) |
in the case of shrinking. The centroblast diameter is a little more than two times larger than the centrocyte diameter resulting in a volume ratio of about .
Proliferation of centroblasts
The proliferation of the centroblasts is described as the replacement of a large mother cell by two daughter cells with half volume thus respecting the volume conservation but violating the condition that only one cell can occupy one lattice point. The latter condition is restored automatically when a lattice point in the close proximity becomes available for one of the cells to move to. To each new cell the eigentime zero is attributed and it restarts to grow. If the growth process stops for a short period of time because there is not enough space available the eigentime is frozen as well. This mirrors the influence of the growth process—the G1-phase of the cell cycle—on the proliferation time. The other phases of cell cycle are more or less of constant duration and do not depend on space restrictions since the volume does not change.
Both daughter cells have to maintain a certain distance in order to have sufficient space to grow. In the case of very low mobility the B cells may not reach this minimum distance at every moment and therefore proliferation is inhibited, i.e. the expected cells after three days of clonal expansion will not be seen. This implies a lower bound for the mobility of the B cells.
We do not consider apoptosis of centroblasts. Experiments show that centroblasts can enter apoptosis when left without proper surviving signals (?, ?, ?, ?). Thus we neglect two possible effects: A time dependence and a spatial dependence of an effective proliferation rate. Also we do not include proliferation signals (?). Thus the proliferation probability depends neither on the position of the cell nor on the time course of the GC reaction. Only volume restrictions modify the proliferation rate. The results will be discussed in this context.
Hypermutation
For the selection process each B cell has its own Ab phenotype . Before the onset of somatic hypermutation all centroblasts have the same Ab phenotype. Hypermutation is started at the same time point as differentiation. A cell jumps to a next neighbor point in the shape space with hypermutation probability (?, ?). Hypermutation is allowed during cell division only, and both new cells mutate with the same probability.
2.3.2 FDC representation
Follicular dendritic cells are represented as a soma with dendrites attached to it. The soma is assumed to be immobile and to have a volume comparable to B cells. The volume of the dendrites is neglected so that B cells and dendrites may occupy the same lattice points. Each FDC has six dendrites with a length of four lattice constants resulting in an overall length of which is in good agreement with morphological studies (?). The total number of FDCs is (?). This provides enough sites for centrocytes to interact with FDCs without saturation effects.
2.3.3 Interaction between centrocytes and FDCs
The interaction between centrocytes and FDCs takes place when the centrocyte is next neighbor of a dendrite or the soma of an FDC or shares a lattice point with a dendrite. We assume that the process of selection takes about 3 hours (?, ?). During that time the centrocyte is in close contact with the FDC and therefore the centrocyte is assumed not to move. Thereafter the affinity between Ag and the Ab phenotype of the centrocyte is calculated according to eq. 1. The affinity is interpreted as probability of positive selection. If the cell is positively selected it may become an output cell or a centroblast again. During the optimization phase, i.e. before the production of output cells is started (approximately at day 5 (?, ?, ?)), all positively selected B cells are recycled.
2.3.4 Chemotaxis
Every FDC soma generates a chemotactic field by secreting a chemokine into the GC. We assume that the decay and the uptake of signal molecules by B cells is small enough to neglect the feedback on the chemotactic field. Thus the concentration of the chemokine remains in equilibrium during the whole GC reaction. The concentration of the chemokine is proportional to one over distance for each FDC and is calculated once at the beginning of the GC reaction. We further assume that the response of cells to a chemotactic gradient is constant: ( denoting the velocity of the cell type in response to a chemoattractant stemming from cell type ), i.e. the cell detects the gradient and actively moves into that direction. At every lattice point we calculate all concentration differences to free next neighbor points resulting from all FDCs and use a vector sum to compute the corresponding velocity vector which enters eq. (3). For our purposes is the key parameter and is varied over several magnitudes to investigate its influence on the GC morphology.
2.3.5 Boundary and initial conditions
We restrict the whole GC reaction to a sphere with diameter (?) of a fully developed GC. This ensures sufficient space for slightly more than 12000 centroblast on the lattice. No cells except output cells can leave this volume. We do not consider adhesion or pressure of surrounding naive B cells. This assumption, or more generally, the boundary conditions will have to be further discussed.
The starting point of our model are three activated B cells which already entered the network of FDCs which are homogeneously distributed on one half of the sphere mentioned above. Some experiments indicate that the FDC network is not homogeneous. There may exist regions where FDCs present Ag and other regions where FDCs present less or almost no Ag. In the first region centrocytes are primarily found while in the second region centroblasts are dominating (?). In our model only the Ag containing region is take into account.
In all of our simulations we will use the same configuration of the initial Ab phenotype of the seeder cells and the Ag held by the FDCs for reasons of comparibility. The initial affinity of the Ab is .
3 Results
GC population kinetics
The inclusion of a differentiation signal allows various scenarios for the GC population kinetics. Therefore at first, we have to determine realistic time courses of the GC reaction.
The GC kinetics is strongly dependent on the production rate of the signal molecule quanta and the boundary conditions. High production rates result in an exponentially declining cell population. Too small production rates imply a domination of proliferation over differentiation and the cells fill the whole lattice until the proliferation is inhibited by space limitations. This leads to a durable dynamic equilibrium with a stable B cell population (data not shown). For production rates between these two extreme scenarios the time course of the B cell population becomes realistic. At the beginning B cells fill the whole lattice. After a certain time (depending on the signal production rate ) the signal molecule density increases and more centroblasts start to differentiate. This results in a controled reduction of the centroblasts population (Fig. 1).
The typical GC reaction in the model shows a nearly exponential increase of the centroblast population during the first (Fig. 1). Then the differentiation process starts and the centrocyte population increases. The peak of the reaction is reached at about in good agreement with experiment (?). The total population then stabilizes on a plateau for some days before it declines rapidly entering a long lasting low level reaction with a very slowly decreasing B cell population.
The time course of such a GC reaction is only slightly dependent on the differentiation rate , describing the rate with which activated centroblasts differentiate into centrocytes. The differentiation rate has basically to be large enough to guarantee a declining GC population in the late stages of the reaction (?). Note, that observable differentiation rates are effective rates which already include the effect of signal molecules.
FDC-derived chemoattractant for centrocytes
For our purpose we define the appearance of a light zone as a cluster of cells in which centrocytes dominate. The dark zone is analogously defined. To achieve a separation of centrocytes and centroblasts in a GC the FDCs may selectively attract centrocytes but not centroblasts (?). To test this hypothesis we simulate the GC reaction with a chemotactic response of centrocytes only.
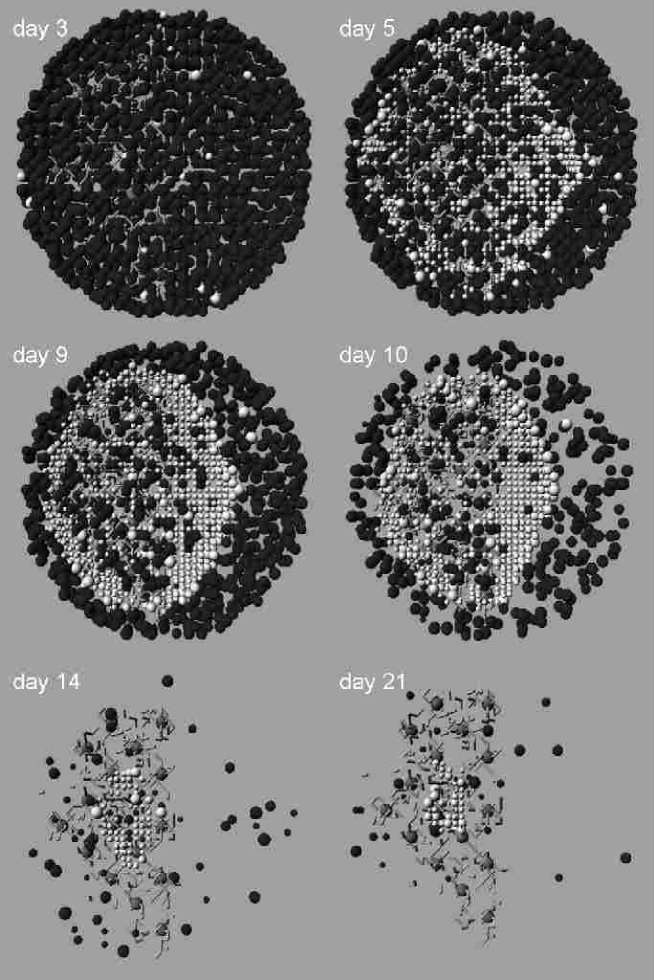
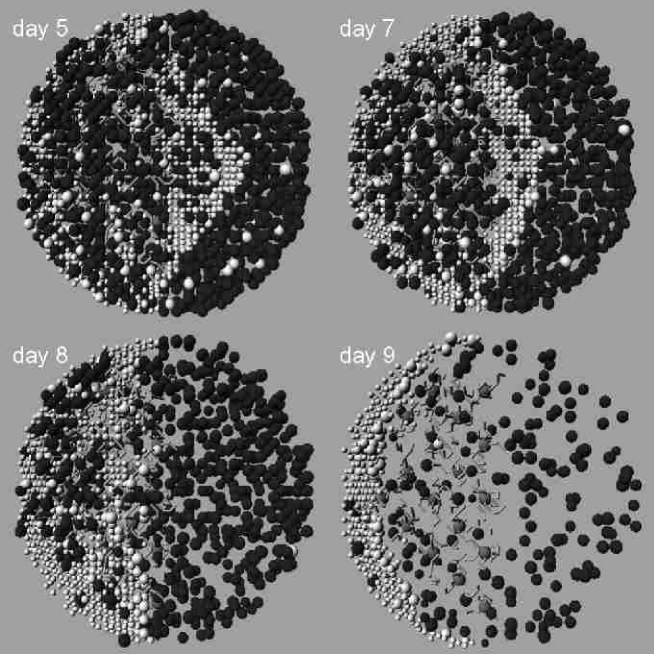
A light zone is observed if the centrocyte velocity resulting from the chemokine allows the cells to leave the centroblast population before they die by apoptosis. A dark zone develops if this velocity is high enough to allow centrocytes to leave the centroblast population before new centrocytes arise from centroblast differentiation, thus generating a centroblast dominated area. For very small chemotactic coefficients no zones occur at all (data not shown). Large chemotactic coefficients result in the formation of a light and dark zone. While the light zone consists of a dense cluster of centrocytes with only few centroblasts, the dark zone is formed in an asymmetric ring like structure of less dense packed centroblasts (Fig. 2). This can be understood by assuming a quasi-stationary situation in which cell numbers do not significantly change. Then the centrocytes get entrapped in the local minima of the chemotactic field reproducing the equipotential lines of the signal molecule concentration (Fig. 3). Note, that not all cells can achieve local minima since volume restrictions have to be respected. The unphysiological ring structure of the dark zone is caused by the fact that the centroblasts have no attractor and behave like a gas inside the GC sphere. With intermediate chemotactic coefficients the zones appear less clearly and later (Fig. 4 left column). The resulting deterministic velocity critical for the formation of light zones is of the order of several per .
Required motility of centroblasts
The reaction also requires that the undirected movement of the centroblasts is fast enough (with a random velocity ) in order to allow the centrocytes to escape the centroblast dominated areas. For random velocities which are significantly below this threshold no light zone develops as long as the centroblast population forms a dense packed cluster. Only when the density of centroblasts declines a light zone occurs for a short period of time (data not shown). Remarkably, the necessary random velocity shows no significant dependence on the chemotactic coefficient . The undirected movement of centroblasts is necessary to offer the possibility to centrocytes to use small gaps for movement. Higher centrocyte velocities have basically no effect if the space for movement is lacking. On the other hand a faster undirected movement of centroblasts may offer enough dynamically produced gaps to ensure the mobility of centrocytes. However, the directed centrocyte movement may be to slow to use the available space. We conclude that a reasonable relation of centroblasts and centrocytes mobility is necessary to allow the separation of both cell types.
In the cases where dark and light zones appear it can be observed that the centrocytes can leave the centroblast dominated areas. This results from the high mobility and small diameter of centrocytes which use every available space around the large centroblasts to perform a movement in direction of the FDC network. However, they do not replace all of the centroblasts inside the FDC network. This is in parts related to the process of recycling which acts as an additional source of centroblasts in the FDC network. In addition, centroblasts rarely leave the FDC network due to their relatively weak mobility. In conclusion, dark zones with very low numbers of centrocytes and light zones with relatively high fraction of centroblasts are generated.
Chemoattractant for centroblasts
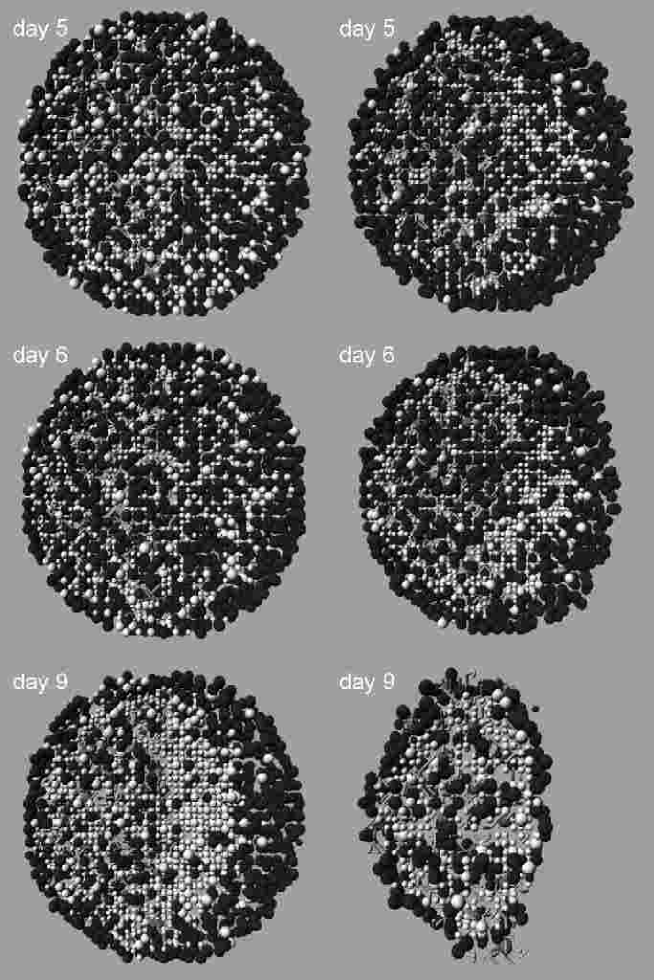
In a second step we let the centroblasts also respond to the FDC chemokine with equal, higher and weaker response compared to the centrocytes. In all three cases there exists neither a dark nor a light zone during the whole GC reaction (Fig. 4 right column) except if the chemotactic response of the centroblasts is weak enough so that the undirected movement dominates. Then, the centroblasts behave similar to a free gas as in the scenario where only centrocytes respond to the chemokine. In the case of weak chemotactic response of centroblasts () and strong chemotactic response of centrocytes () a very small symmetric ring of centroblasts occurs (Fig. 4 right column, day 7).
Mantle zone-derived chemotactic signals
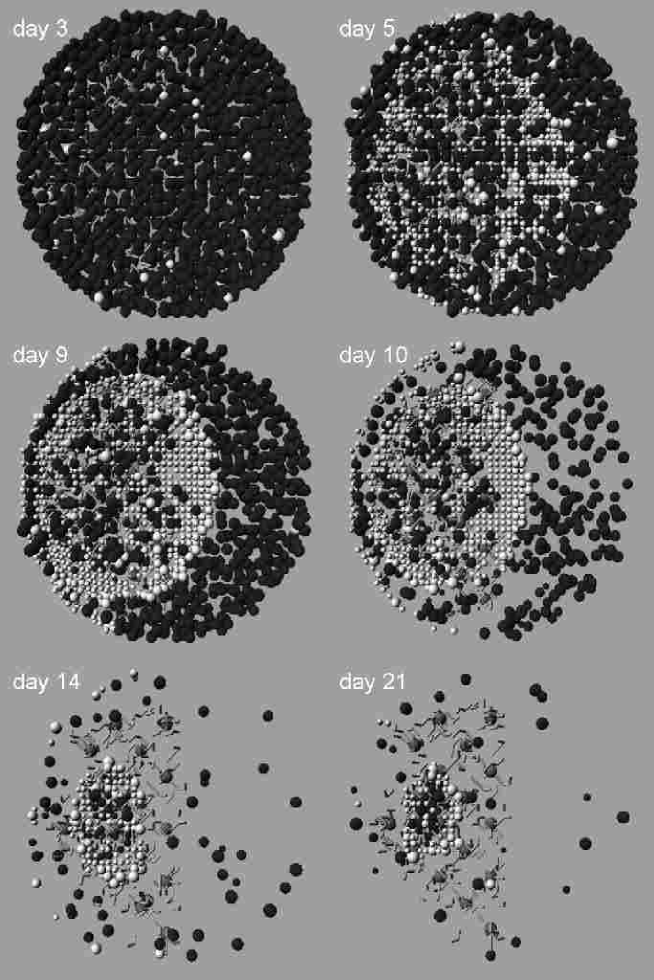
In order to avoid the ring structure we investigate the mantle zone as an alternative source for a chemokine that may act on centrocytes. We include a preformed mantle zone of a GC which is polarized, i.e. the mantle zone is thicker on the side of the FDC network. Similar to the FDCs we let the cells in the mantle zone segregate a chemokine. As before this is reflected in a stationary configuration. This signal alone is sufficient to form light and dark zones (Fig. 5). The dark zone is even more physiological than with FDC-derived chemokine but begins to penetrate the FDC network from day 8 on while the light zone moves towards the boundary of the FDC network around day 9 (Fig. 5). This is due to the new location of the local minima of the chemotactic field situated at the outer boundary of the FDC network. Centrocytes are densely packed in these local minima. When their number begins to decline they do not longer extend to the FDC network. The centroblasts behave like a gas and are dispersed over the free space including the part of the FDC network opposite to the mantle zone. This affects also the late stage of the GC reaction. The B cell population declines much faster than with FDC-derived chemokine and therefore generates less output cells (data not shown).
Combined chemotactic signals
When the centrocytes respond to signals from FDC and mantle zone cells, a light zone and a dark zone can be observed (Fig. 6). The light zone stays within the FDC network during the whole reaction. The dark zone neither is ring shaped nor penetrates the FDC network. The GC morphology is closer to observed morphologies than with FDC-derived chemokine alone. Also the GC kinetics stays in good agreement with experiment (data not shown). Only the differentiation rate has to be adjusted to restore the late stage of the reaction. Otherwise, the B cell population would decline faster than with FDC-derived chemokine only, because the FDC-centrocyte interaction is slightly reduced when some of the centrocytes are entrapped at the boundary of the FDC network.
The relative strength of the chemotactic response must be tightly balanced. The velocity in response to the mantle zone-derived chemokine has to be twice the strength compared to the response to FDC-derived chemokines. Higher values lead to structures like in Fig. 5 and smaller values to structures like in Fig. 2. To explain this behavior we plot the equipotential lines of the resulting chemotactic field (Fig. 7). The shift of the isolines towards the mantle zone compared to Fig. 3 can clearly be seen. We want to emphasize that the B cells in the mantle zone are not necessarily the source for the chemokine. Any other cell type with similar spatial distribution leads to the same result.
Affinity maturation
If we investigate the affinity of the output cells we recognize that we have approximately output cells with high affinity () and about medium affinity cells () (Fig. 8). The plot shows the fraction of corresponding numbers of output cells integrated over time intervals of and reflects the quality of produced output cells. The small numbers of produced output cells during those short time intervals lead to huge statistical fluctuations. Remarkably, the ratio between medium and high affinity cells is reversed after two weeks. At the beginning of the output production most cells have still low affinity for the Ag. Then, the fraction of medium and high affinity cells increases. After two weeks the fraction of high affinity cells increases further while the fraction of medium affinity cells is declining. This behavior is in good quantitative agreement with experiment (?).
Interestingly, this behavior seems to be independent of the GC morphology as long as the general GC kinetics remains unaffected. In contrast, the number of output cells changes for different morphologies. The output quantity depends on the probability for centrocytes to interact with FDCs. Some morphologies of GC reaction induce volume constellations that inhibit the movement of centrocytes and in this way reduce this interaction probability. However, the fact that the quality remains almost the same (data not shown), at first sight, seems to be in contradiction to results of Meyer-Hermann (?). But we use another indicator for the quality of the GC reaction. Considering the time course of the time integrated output quality instead, the GC morphology, indeed, influences the total output quality (data not shown). This value memorizes the total output production and is therefore sensitive to the effectivity of affinity maturation in the early phase (around day 6) of the GC reaction which is inhibited by the absence of zones (?).
Robustness of the model and the results
The model results are stable against small variations of most of the experimentally unknown parameters. This applies especially to the parameters of cell movement (). The most sensitive parameter is the production rate of the signal molecule quanta . Its value determines the duration of the plateau phase in the GC kinetics and variations of more than 10% cause exponentially declining reactions or persistent plateau phases, respectively. Also the total size of the GC represented by influences the GC kinetics. The plateau phase of the reaction is reached when the proliferation is inhibited due to limited space. This results in an increased number of centroblasts. When the signal production rate is adjusted the GC kinetics in Fig. 1 is restored on a higher level of cell numbers. In order to fit the cell numbers to experiment (?), the value for the diameter of the GC is fixed to .
Despite the stochastical nature of the model, the results are reproducible without significant statistical variations. The only exception are the details of the affinity maturation (Fig. 8) due to small cell numbers.
Also the morphology is independent of the details of the FDC distribution. An expansion of the FDC network slightly beyond the boundary of the GC does not alter the results in general.
4 Discussion
In the present study we enlarged our previous model for the GC morphology in order to investigate the influence of chemotaxis on the GC formation. To this end it was necessary to develop a more detailed description of cell mobility. Besides a minimization of lattice-anisotropy effects, this, especially, includes a self-consistent cell-volume concept on a discrete regular lattice without going into the details on a subcellular level. We included cell growth and shrinking, as well as cell differentiation. The resulting model is the first three-dimensional attempt to simulate GC cell population dynamics and GC morphology. It should, therefore, provide a more realistic description of processes involved in the GC development.
Within our model the different cell volumes of centroblasts and centrocytes strongly influence their mobility. We observe in the simulations that small centrocytes are able to move in the environment of large centroblasts even when the latter ones are densely packed. The centrocytes find small gaps and slip through the centroblasts. The mobility of the centroblasts is inhibited by their larger volume. The restrictions on the total GC volume inhibit centroblasts growth and in this way centroblast proliferation. All of these observations in the GC simulations are quite realistic effects which have an equivalent in real GCs, and which seem to be important on the way towards a realistic picture of moving cells during the GC reaction. We consider therefore our model to be suitable for studying possible effects of chemotactic signals.
First, we investigated the influence of a FDC derived chemoattractant (?, ?) on the GC morphology. This signal is sufficient to separate centroblasts and centrocytes but can not explain the formation of the characteristic GC structures. If the chemotactic response of the centrocytes and the random movement of the centroblasts exceeds given values ( for centrocytes and for centroblasts, respectively) a light and a dark zone develop. But in contrast to experiment the centroblasts form an asymmetric ring like structure (Fig. 2). For smaller values of the cell mobility (about one order of magnitude) the zones are developed later in the GC reaction when the total density of cells becomes small enough (Fig. 4). For significantly reduced cell mobility no separation into light and dark zone occurs at all. The corresponding velocities of both cell types are within physiological relevant values and are comparable to relatively slowly moving cells (?, ?, ?, ?, ?, ?).
Interestingly, chicken GCs seem to have such a ring structure suggesting that FDC-derived chemotaxis acting on centrocytes is adequate to describe their morphology (?). In contrast, in mammalian GCs other or addional mechanisms cause the formation of dark and light zones. To test this hypothesis the mantle zone was taken into consideration as source of a chemokine acting on centrocytes. Again a separation into light and dark zone can be observed. The dark zone is sickle-shaped and the light zone is shifted within the FDC network towards the source of the chemoattractant. This causes an inhibited FDC-centrocyte interaction resulting in reduced numbers of recycled centroblasts and output cells.
In addition we investigated centroblasts responding to FDC-derived chemokines. Only a small ring shaped dark zone can be achieved for small values of the chemotactic coefficient and a more intense chemotactic response of centrocytes (Fig. 4). The ring of centroblasts is now symmetric in contrast to the results when the centroblasts do not respond to the FDC-derived chemoattractant. The asymmetric ring structure is restored for significantly reduced chemotactic response when the random motility dominates (data not shown). It is known that the seeder B cells enter the primary follicle via chemotaxis provided by the BLC - CXCR5 pathway (?, ?, ?, ?). Our results suggest that centroblast only weakly respond to FDC-derived chemokines during the GC reaction. In agreement with this GC B cells showed no response to BLC (?), SDF-1 (?, ?), SLC, and MIP-3 (?), and a weak response to rC5a (?).
We also analyzed alternative sources for the chemokines. If the mantle zone B cells or cells with a similar distribution secrete a chemokine acting as attractant for centrocytes, dark and light zones are formed (Fig. 5). The separation of dark and light zone is more physiological but results in a shorter GC reaction because the light zone shifts to the boundary of the FDC network while the dark zone enters it. This may be related to the model assumptions. We did not include the dynamics of the mantle zone thus neglecting a possible movement of the minima of the chemotactic field relative to the FDC network. The duration of the GC reaction can only be prolonged if unrecycled centroblasts are attributed a longer lifetime to. But the quality of the output cells still remains too low (data not shown).
When centrocytes respond to both chemokines—the mantle zone-derived and FDC-derived chemokine—a longer lasting light zone can be observed which remains inside the FDC network. The dark zone is sickle shaped and does not expand into the FDC network (Fig. 6). This is the most realistic scenario we could generate. The GC kinetics and the affinity maturation are similar to the scenario with FDC chemokine alone (Fig. 1 and Fig. 8) while the unphysiological ring structure of the dark zone turns into a more realistic sickle shaped dark zone. This result still does not reproduce the observations of light microscopy (?, ?, ?, ?) suggesting that other mechanism are necessary to generate the typical GC morphology. One possible mechanism is a diffusing differentiation signal secerned by the FDCs (?).
In general we achieved physiologically realistic GC population kinetics for the different scenarios of the GC morphology Fig. 1. In the late stages of the reaction when low numbers of GC B cells remain differences occur affecting the number of output cells. This results in different total average affinities of output cells depending on the various GC morphologies. However, the quality of output cells produced at the end of the reaction are comparable provided that the number of output cells is large enough. The distribution between high, medium, and low affinity cells (Fig. 8) quantitatively mirrors experimental results very well (?). We can conclude that the morphology of the GC mainly influences the quantity and not the quality of output cells.
One assumption of the model is that centrocytes respond to a chemokine with constant velocity only detecting the direction of the chemotactic gradient. We addressed the question if a linear dependency of the velocity on the chemokine concentration gradient (), would change the results. Indeed, the results can not be restored within reasonable parameter values, i.e. velocities. Centrocytes far away from the FDC network have the smallest velocities and at the same time the longest way to go. However, increasing the over all velocity in response to the chemotactic gradient means, especially, also increasing the velocity of cells close to the FDC network reaching unphysiological high values. If the chemotactic response was linear to the concentration itself one would get almost the same result with a slightly flatter velocity distribution (one over distance compared to one over distance squared). Taken together, this suggests that centrocytes use the chemokine concentration mainly to detect the direction of movement and have a more or less constant velocity in response to the chemoattractant.
One may think about a possible influence of cell-cell adhesion. It is known that GC B cells and FDCs form clusters in vitro (?). The cooperation of chemotaxis and differential adhesion for the separation of cells has been studied in other systems (?). The major difference to this study is that centroblasts differentiate into centrocytes and vice versa while in the model of Jiang et al. the cell fractions remain constant. In addition, the cells have no gaps between them while in our model small gaps are necessary to allow the centrocytes to move towards the FDC. It would be interesting to investigate if adhesion could substitute the boundary condition, namely the restriction of cell movement to a sphere, and thus circumvent the gas behavior of the centroblasts.
We conclude, that FDC-derived chemokines acting on centrocytes lead to a separation of centroblasts and centrocytes in GC reaction. However, the GC morphology as observed in mammalians is not correctly reproduced. This problem persists even using a combined centrocyte response to mantle zone-derived and FDC-derived chemokines. These results suggests that chemotaxis for its own is not sufficient to induce a realistic development of dark and light zones. The present model points towards an additional role either of cell-cell adhesion or of cells surrounding the GC.
References
- 1 Meyer-Hermann, M. 2002. A mathematical model for the germinal center morphology and affinity maturation. To appear in J. Theor. Biol.
- 2 MacLennan, I. C. M. 1994. Germinal centers. Annu. Rev Immunol., 12:117–139.
- 3 Liu, Y.-J., Zhang, J., Lane, P. J. L., Chan, E. Y.-T., and MacLennan, I. C. 1991. Sites of specific B cells activation in primary and secondary response to T cell-dependent and T cell independent antigens. Eur. J. Immunol., 21:2951–2962.
- 4 Li, L., Zhang, X., Kovacic, S., Long, A. J., Bourque, K., Wood, C. R., and Sung Choi, Y. 2000. Identification of a human follicular dendritic cell molecule that stimulates germinal center B cell growth. J. Exp. Med., 191(6):1077–1083.
- 5 Camacho, S. A., Kosco-Vilbois, M. H., and Berek, C. 1998. The dynamic structure of the germinal center. Immunol. Today, 19(11):511–514.
- 6 McHeyzer-Williams, M. G., McLean, M. J., A., L. P., and Nossal, G. J. 1993. Antigen-driven B cell differentiation in vivo. J. Exp. Med., 178(1):295–307. hypermutation.
- 7 Han, S., Zheng, B., Takahashi, Y., and Kelsoe, G. 1997. Distinctive characteristics of germinal center B cells. Semin. Immunol., 9:255–260.
- 8 Liu, Y.-Y., Joshua, D. E., Williams, G. T., Smith, C. A., Gordon, J., and MacLennan, I. C. 1989. Mechanism of antigen-driven selection in germinal centres. Nature, 342:929–931.
- 9 Liu, Y.-J., Barthélémy, C., de Boutellier, O., and Banchereau, J. 1994. The differences in survival and phenotype between centroblasts and centrocytes. Adv. Exp. Med. Biol., 355:213–218.
- 10 Tew, J. G., Wu, J., Qin, D., Helm, S., and Burton, Gregory F. Szakal, A. K. 1997. Follicular dendritic cells and presentation of antigen and costimulatory signals to B cells. Immunol. Rev., 156:39–52.
- 11 Hur, D. Y., Kim, D. J., Kim, S., Kim, Y. I., Cho, D., Lee, D. S., Hwang, Y.-I., Bae, K.-W., Chang, K. Y., and Lee, W. J. 2000. Role of follicular dendritic cells in the apoptosis of germinal center B cells. Immunol. Lett., 72:107–111.
- 12 van Eijk, M., Defrance, T., Hennino, A., and de Groot, C. 2001. Death-receptor contribution to the germinal-center reaction. Trends Immunol., 22(12):677–681.
- 13 Lindhout, E., Koopman, G., Pals, S. T., and de Groot, C. 1997. Triple check for antigen specifity of B cells during germinal centre reactions. Immunol. Today, 18(12):573–576.
- 14 Bancheraeau, J. and Steinmann, R. M. 1998. Dendritic cells and the control of immunity. Nature, 392:245–252.
- 15 Nossal, G. 1991. The molecular and cellular basis of affinity maturation in the antibody response. Cell, 68:1–2.
- 16 Oprea, M. and Perelson, A. S. 1997. Somatic mutation leads to efficient affinity maturation when centrocytes recycle back to centroblasts. J. Immunol., 158(11):5155–5162.
- 17 Keşmir, C. and de Boer, R. J. 1999. A mathematical model on germinal center kinetics and termination. J. Immunol., 163:2463–2469.
- 18 van Nimwegen, E., Oprea, M., and Perelson, A. S. 2000. Dynamics of one-pass germinal center models: Implications for affinity maturation. Bull. Math. Biol., 62(1):121–153.
- 19 Kleinstein, S. H. and Pal Singh, J. 2001. Toward quantitative simulation of germinal center dynamics: Biological and modeling insights from experimental validation. J. Theor. Biol., 211:253–275.
- 20 Meyer-Hermann, M., Deutsch, A., and Or-Guil, M. 2001. Recycling probability and dynamical properties of germinal center reaction. J. Theor. Biol., 210(3):265–285.
- 21 Bouzahzah, F., Antoine, N., Simar, L., and Heinen, E. 1996. Chemotaxis-promoting and adhesion properties of human tonsillar follicular dendritic cell clusters. Res. Immunol., 147:165–173. chemotaxis, follicular dendritic cells, adhesion.
- 22 Komai-Koma, M., Donachie, A. M., and Wilkinson, P. C. 1997. Antigen-specific chemotaxis of b cells. Immunol., 91:579–585. chemotaxis.
- 23 Bleul, C. C., Schultze, J. L., and Springer, T. A. 1998. B lymphocyte chemotaxis regulated in association with microanatomic localization, differentiation state, and B cell receptor engagement. J. Exp. Med., 187(5):753–762.
- 24 Gunn, M. D., Ngo, V. N., Ansel, M. K., Ekland, E. H., Cyster, J. G., and Williams, L. T. 1998. A B-cell-homing chemokine made in lymphoid follicles activates burkitt’s lymphoma receptor-1. Nature, 391:799–803.
- 25 Legler, D. F., Loetscher, M., Stuber Roos, R., Clark-Lewis, I., Baggiolini, M., and Moser, B. 1998. B cell-attracting chemokine 1, a human CXC chemokine expressed in lymphoid tissues, selectively attracts B lymphocytes via BLR1/CXCR5. J. Exp. Med., 187(4):655–660.
- 26 Tarlinton, D. 1998. Germinal centers: form and function. Curr. Opin. Immunol., 10(3):245–251.
- 27 Ansel, K. M., Ngo, V. N., Hyman, P. L., Luther, S. A., Förster, R., Sedgwick, J. D., Browning, J. L., Lipp, M., and Cyster, J. G. 2000. A chemokine-driven positive feedback loop organizes lymphoid follicles. Nature, 406:309–314.
- 28 Dubois, B., Massacrier, C., and Caux, C. 2001. Selective attraction of naive and memory B cells by dendritic cells. J. Leukoc. Biol., 70:633–641.
- 29 Perelson, A. S. and Oster, G. F. 1979. Theoretical studies of clonal selection: Minimal antibody repertoire size and reliability of self-non-self discrimination. J. Theor. Biol., 81:645–670.
- 30 Radmacher, M. D., Kelsoe, G., and Kepler, T. B. 1998. Predicted and inferred waiting times for key mutations in the germinal centre reaction: Evidence for stochasticity in selection. Immunol. Cell Biol., 76:373–381. somatic hypermutation, key mutation.
- 31 England, P., Nageotte, R., Renard, M., Page, A.-L., and Bedouelle, H. 1999. Functional characterization of the somatic hypermutation process leading to antibody D1.3, a high affinity antibody against lysozyme. J. Immunol., 162:2129–2136. key mutations, hypermutation.
- 32 Garside, P., Ingulli, E., Merica, R. R., Johnson, J. G., Noelle, R. J., and Jenkins, M. K. 1998. Visualization of specific B and T lymphocyte interactions in the lymph node. Science, 281:96–99.
- 33 Lentz, V. M. and Manser, T. 2001. Cutting edge: Germinal centers can be induced in the absence of T cells. J. Immunol., 167:15–20.
- 34 García de Vinuesa, C., Cook, M. C., Ball, J., Drew, M., Sunners, Y., Cascalho, M., Wabl, M., Klaus, G. G. B., and MacLennan, I. C. M. 2000. Germinal centers without T cells. J. Exp. Med., 191(3):485–493.
- 35 Agarwal, A., Nayak, B. P., and Rao, K. V. S. 1998. B cell responses to a peptide epitope. VII. antigen-dependent modulation of the germinal center reaction. J. Immunol., 161.
- 36 Küppers, R., Zhao, M., Hansmann, M. L., and Rajewsky, K. 1993. Tracing B cell development in human germinal centers by molecular analysis of single cell picked from histological sections. EMBO J., 12(13):4955–4967.
- 37 Han, S., Zheng, B., Dal Porto, J. M., and Kelsoe, G. 1995. In situ studies of the primary immune response to (4-hydroxy-3-nitrophenyl) acetyl IV. affinity-dependent, antigen-driven B-cell apoptosis in germinal centers as a mechanism for maintaining self-tolerance. J. Exp. Med., 182(6):1635–1644.
- 38 Hanna, M. G. 1964. An autoradiographic study of germinal center in spleen white pulp during early intervals of the immune response. Lab. Invest., 13:95–104.
- 39 Zhang, J., MacLennan, I. C. M., Liu, Y., and Lane, P. J. L. 1988. Is rapid proliferation in B centroblasts linked to somatic mutation in memory B cell clones. Immunol. Lett., 18:297–299.
- 40 Kroese, F. G., Wubbena, A. S., Seijn, H. G., and Nieuwenhuis, P. 1987. Germinal centers develop oligoclonally. Eur. J. Immunol., 17(7):4955–4967.
- 41 Lindhout, E., Lakeman, A., and de Groot, C. 1995. Follicular dendritic cells inhibit apoptosis in human B lymphocytes by a rapid and irreversible blockade of preexisting endonuclease. J. Exp. Med., 181(6):1985–1995.
- 42 van Eijk, M. and de Groot, C. 1999. Germinal center B cell apoptosis requires both caspase and cathepsin activity. J. Immunol., 163:2478–2482.
- 43 Kepler, T. B. and Perelson, A. S. 1993. Cyclic re-entry of germinal center B cells and the efficiency of affinity maturation. Immunol. Today, 14:412–415.
- 44 Liu, Y.-J. 1997. Reuse of B lymphocyte in germinal centers. Science, 278:238–239.
- 45 Oprea, M. and Perelson, A. S. 2000. Dynamics of one-pass germinal center models: Implications for affinity maturation. Bull. Math. Biol., 62:121–153.
- 46 Jacob, J., Przylepa, J., Miller, C., and G., K. 1993. In situ studies of the primary immune response to (4-hydroxy-3-nitrophenyl)acetyl. III. the kinetics of V region mutation and selection in germinal center B cells. J. Exp. Med., 178(4):1293–307.
- 47 Pascual, V., Cha, S., Gershwin, E., Capara, J. D., and Leung, P. S. C. 1994. Nucleotide sequence analysis of natural and combinatorial anti-PDC-E2 antibodies in patients with primary biliary cirrhosis. J. Immunol., 152:2577–2585.
- 48 Hostager, B. S., Catlett, I. M., and Bishop, G. A. 2000. Recruitment of CD40 and tumor necrosis factor receptor-associated factors 2 and 3 to membrane microdomains during CD40 signaling. J. Biol. Chem., 275(20):15392–15398.
- 49 Thompson, C. B., Scher, I., Schaefer, M. E., and Lindstein, T. 1984. Size-dependent B lymphocyte subpopulations: Relationship of cell volume to surface phenotype, cell cycle, proliferative response, and requirements for antibody production to TNP-Ficoll and TNP-BA. J. Immunol., 133:2333–2342. centrocyte diameter, cell cycle.
- 50 Choe, J., Li, L., Zhang, X., Gregory, C. D., and Sung Choi, Y. 2000. Distinct role of follicular dendritic cells and T cells in the proliferation, differentiation, and apoptosis of a centroblast cell line, L3055. J. Immunol., 164:56–63.
- 51 Zhang, X., Li, L., Jung, H., Xiang, S., Hollmann, C., and Sung Choi, Y. 2001. The distinct role of T cell-derived cytokines and a novel follicular dendritic cell-signaling molecule 8d6 in germinal center-b cell differentiation. J. Immunol., 167:49–56.
- 52 Kleiber, M. 1932. Body size and metabolism. Hilgardia, 6:315–353.
- 53 Hennino, A., Bérard, M., Krammer, P., and Defrance, T. 2001. FLICE-inhibitory protein is a key regulator of germinal center B cell apoptosis. J. Exp. Med., 193(4):447–458.
- 54 Kim, H.-S., Xinhong, Z., Klyushnenkova, E., and Sung Choi, Y. 1995. Stimulation of germinal center B lymphocyte proliferation by an FDC-like cell line, HK. J. Immunol., 155:1101–1109.
- 55 Lebecque, S., de Bouteiller, O., Arpin, C., Banchereau, J., and Liu, Y.-J. 1997. Germinal center founder cells display propensity for apoptosis befor onset of somatic mutation. J. Exp. Med., 185(3):563–571.
- 56 Berek, C. and Milstein, C. 1987. Mutation drift and repertoire shift in the maturation of the immune response. Immunol. Rev., 96:23–41.
- 57 Szakal, A. K., Gieringer, R. L., Kosco, M. H., and Tew, J. G. 1985. Isolated follicular dendritic cells: cytochemical antigen localization, Nomarski, SEM, and TEM morphology. J. Immunol., 134:1349–1359.
- 58 Tew, J. G., Thorbecke, . J., and Steinmann, R. M. 1982. Dendritic cells in the immune response: characteristics and recommended nomenclature. J. Reticuloendothel. Soc., 31(5):371–380.
- 59 Breitfeld, D., Ohl, L., Kremmer, E., Joachim, E., Sallusto, F., Lipp, M., and Förster, R. 2000. Follicular B helper T cells express CXC chemokine receptor 4, localize to B cell follicles, and support immunoglobulin production. J. Exp. Med., 192(11):1545–1551.
- 60 Kosco-Vilbois, M. H., Zentgraf, H., Gerdes, J., and Bonnefoy, J.-Y. 1997. To ’B’ or not to ’B’ a germinal center. Immunol. Today, 18(5):225–230.
- 61 Smith, Kenneth, G., Light, A., Nossal, G., and Tarlinton, D. M. 1997. The extend of affinity maturation differs between the memory and antibody-forming cell compartments in the primary immune response. EMBO J., 16(11):2996–3006.
- 62 Boll, I. T., Domeyer, C., and Buhrer, C. 1992. Locomotion of human bone marrow and peripheral blood leukocytes is associated with maturational stage and altered in malignancy. Blood Cells, 18(2):278–279.
- 63 Murray, J., Vawter-Hugart, H., Voss, E., and Soll, E. R. 1992. Three-dimensional motility cycle in leukocytes. Cell Motil. Cytoskeleton, 22(3):211–223.
- 64 Felder, S. and Kam, Z. 1994. Human neutrophil motility: time-dependent three-dimensional shape and granule diffusion. Cell Motil. Cytoskeleton, 28(4):285–302.
- 65 Masellis-Smith, A., Belch, A. R., Mant, M. J., Turley, E. A., and Pilarski, L. M. 1996. Hyaluronan-dependent motility of B cells and leukemic plasma cells in blood, but not of bone marrow plasma cells, in multiple myeloma: alternate use of receptor for hyaluronan-mediated motility (RHAMM) and CD44. Blood, 87(5):1891–1899.
- 66 Niggemann, B., Maaser, K., Lu, H., Kroczek, R., Zanker, K. S., and Friedl, P. 1997. Locomotory phenotypes of human tumor cell lines and T lymphocytes in a three-dimensional collagen lattice. Cancer Lett., 118(2):173–180.
- 67 Friedl, P., Borgmann, S., and Bröcker, E.-B. 2001. Amoeboid leukocyte crawling through extracellular matrix: lessons from the Dictyostelium paradigm of cell movement. J. Leukoc. Biol., 70(4):491–509.
- 68 Yasuda, M., Taura, Y., Yokomizo, Y., and Ekino, S. 1998. A comparative study of germinal cente: fowls and mammals. Comp. Immunol. Microbiol. Infect. Dis., 21:179–189.
- 69 Shi, K., Hayashida, K., Kaneko, M., Hashimoto, J., Tomita, T., Lipsky, P. E., Yoshikawa, H., and Ochi, T. 2001. Lymphoid chemokine B cell-attracting chemokine-1 (CXCL13) is expressed in germinal center of ectopic lymphoid follicles within the synovium of chronic arthritis patients. J. Immunol., 166:650–655.
- 70 Bowman, E. P., Campbell, J. J., Soler, D., Dong, Z., Manlongat, N., Piracella, D., Hardy, R. R., and Butcher, E. C. 2000. Developmental switches in chemokine response profiles during B cell differentiation and maturation. J. Exp. Med., 191(8):1303–1317.
- 71 Ottonello, L., Corcione, A., Tortolina, G., Airoldi, I., Albesiano, E., Favre, A., D’Agostino, R., Malavasi, F., Pistoia, V., and Dallegri, F. 1999. rC5a directs the in vitro migration of human memory and naive tonsillar B lymphocytes: Implications for B cell trafficking in secondary lymphoid tissues. J. Immunol., pages 6510–6517.
- 72 Schaerli, P., Willimann, K., Lang, A. B., Lipp, M., Loetscher, P., and Moser, B. 2000. CXC chemokine receptor 5 expression defines follicular homing t cells with B cell helper function. J. Exp. Med., 192:1553–1562.
- 73 Steininger, B., Barth, P., and Hellinger, A. 2001. The perifollicular and marginal zones of the human splenic white pulp. Am. J. Pathol., 159(2):501–512.
- 74 Verbeke, C. S., Wenthe, U., and Zentgraf, H. 1999. Fas ligand expression in the germinal centre. J. Pathol., 189(2):155–161.
- 75 Kosco, M. H., Pflugfelder, E., and Gray, D. 1992. Follicular dendritic cell-dependent adhesion and proliferation of B cells in vitro. J. Immunol., 148:2331–2339.
- 76 Jiang, Y., Levine, H., and Glazier, J. 1998. Possible cooperation of differential adhesion and chemotaxis in mound formation of Dictyostelium. Biophys. J., 75:2615–2625.
| parameter | value | source |
|---|---|---|
| time resolution | ||
| lattice constant | ||
| centrocyte diameter | (?, ?) | |
| centroblast diameter | (?) | |
| germinal center diameter | (?) | |
| random velocity | ||
| number of seeder cells | (?) | |
| number of FDCs | 104 | (?) |
| proliferation time | (?, ?, ?, ?, ?) | |
| proliferation time width | ||
| differentiation time | (?, ?) | |
| production of differentiation signal molecule | ||
| centrocyte lifetime | (?) | |
| duration of selection process | (?, ?) | |
| growth exponent | (?) | |
| duration of growth | ||
| growth coefficient | ||
| duration of differentiation process | ||
| shrink coefficient | ||
| recycling probability | (?) | |
| affinity width | (?) | |
| exponential weight | (?) | |
| shape space dimension | (?, ?) | |
| hypermutation probability | (?, ?) | |
| time delay between start of differentiation and production of output cells | (?) |