Empirical Formula for the Excitation Energies
of the First
and States in Even-even Nuclei
Abstract
We report empirical findings that a simple formula in terms of the mass number , the valence proton number , and the valence neutron number can describe the essential trends of the excitation energies of the first and states in even-even nuclei throughout the periodic table. The formula reads as . The parameter in the first term is determined from the mass number dependence of the bottom contour line of the excitation energy systematics. The other three parameters , , and are fitted by minimizing the value between logarithms of the measured and the calculated excitation energies. Our results suggest that the single large- shell simulation can be applied to the excitation energies of the first and states in even-even nuclei.
pacs:
21.10.Re, 23.20.LvThe exhaustive compilation of the values between the ground state and the first state in even-even nuclei by Raman et al. has provided a rare opportunity to make a systematic study of the relevant nuclear properties throughout the periodic table Raman-a ; Raman-b . For example, it was seen that values, when plotted in terms of the atomic number , showed a mid-shell bump within a major shell consisting of several single -particle levels. It was also shown that this bump could be nicely explained by an idea of the single large- shell simulation Raman-c ; Raman-d . Within this simulation, the nuclei corresponding to the sub-states of large angular momentum are described in terms of the valence nucleon numbers and , which are then adopted to parameterize various quantities such as the values and the nuclear quadrupole moments. The valence proton (neutron) number is defined as the number of proton (neutron) particles below mid-shell or the number of proton (neutron) holes past mid-shell within the given major shell. Hamamoto, who introduced the concept of the valence nucleon numbers for the first time more than four decades ago, has shown that the square root of the ratio of the measured and the single-particle values, , is roughly proportional to the product Hamamoto . Casten has extended the idea and shown that if one parameterizes the collective variables or operators in terms of the product instead of the usual mass number , the neutron number , or the proton number , then one gets a substantial reduction in the number of parameters without serious loss of accuracy Casten ; Casten-a .
In this brief report, we want to illustrate that the valence nucleon numbers can be employed in describing not only the values as shown in the previous publications by other authors Hamamoto ; Casten but also the excitation energies themselves of the first states in the even-even nuclei. In addition, we will also show that a single formula in terms of the valence nucleon numbers reproduces the essential trends of the first excitation energies throughout the periodic table. This fact presents a noticeable contrast to former studies in which the parametrization by the valence nucleon numbers and was performed for nuclei that belonged to one major shell only.
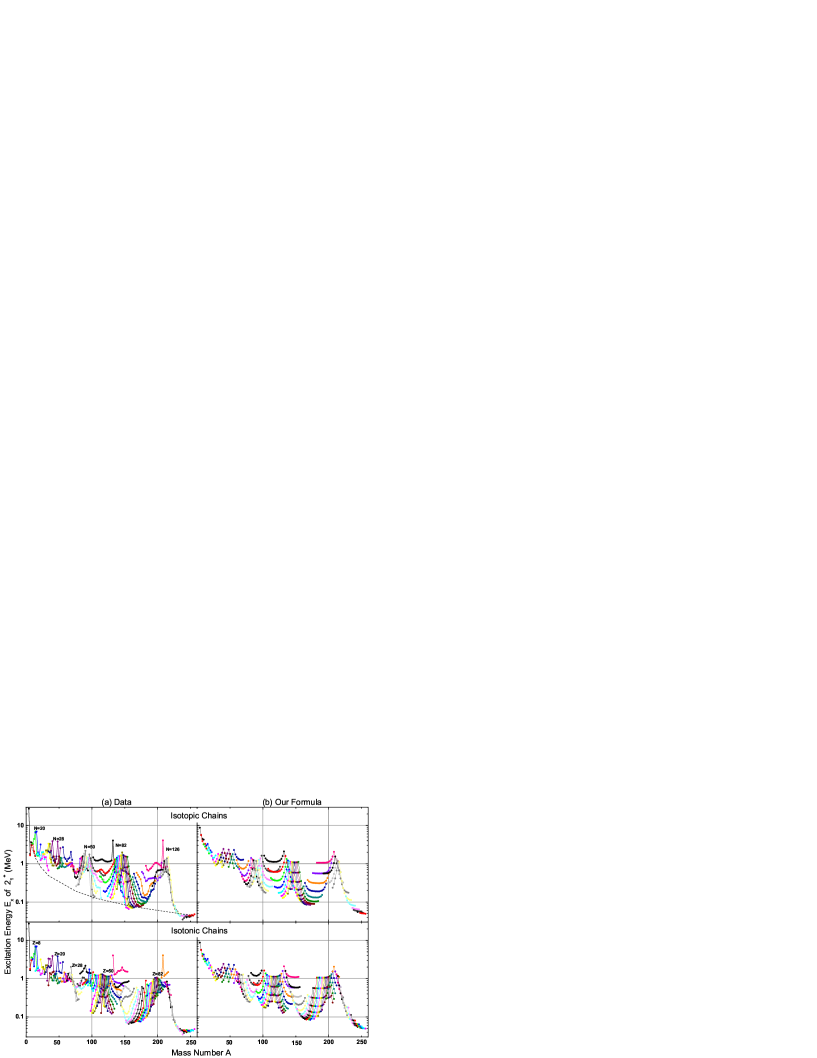
Evidence in favor of the single large- shell structure in the excitation energies of the first states can be seen from Fig. 1(a), which shows the data quoted from Ref. 2 where the best-known values of have been compiled for even-even nuclei. First, consider the solid lines in the upper panel of Fig. 1(a), which connect the excitation energies of the nuclei that belong to the same isotopic chain. Let us focus on the V-shaped portion that can be easily identified from each one of isotopic chains in Fig. 1(a). Those nuclei which form a Vshape actually constitute one of the neutron major shells (with the proton number fixed) in the single large- shell simulation. The Vshape itself tells us that, within a major shell, the excitation energy is minimum in the mid-shell nucleus, which corresponds to the bottom of the Vshape, and that becomes larger either when the neutron number increases or decreases from the mid-shell. Furthermore, as indicated by the numbers in the upper panel of Fig. 1(a), the neutron number of the nucleus at the top of Vshapes is one of magic numbers , , , , , and that form the boundary between adjacent major shells within the model of the single large- shell simulation Raman-d . Now, turn to the lower panel of Fig. 1(a). The data points in the lower panel are exactly the same as those in the upper panel, but the solid lines in the lower panel of Fig. 1(a) are obtained by connecting the excitation energies of the nuclei that belong to the same isotonic chain with different proton numbers. From the isotonic chains in the lower panel of Fig. 1(a), we can observe precisely the same kind of evidence for the single large- proton shell structure (with the neutron number fixed) as for the single large- neutron shell structure in the upper panel of Fig. 1(a).
As an effort to describe the systematic behavior of by using a formula that is as simple as possible, we try the following equation:
| (1) |
where , , , and are our free parameters to be fitted from the data. The first term of Eq. (1) represents the overall dependence of the excitation energy on the mass number , and the last two terms account for variations of excitation energies, which form the Vshape within a major shell in Fig. 1. We divide our fitting procedure into two steps. First, we construct the bottom contour line by connecting the lowest points among the adjacent V’s in the upper panel of Fig. 1(a) and fit it by only the first term, , of Eq. (1) to determine the two parameters and . However, we take only the value of from the first step, and let , , and be subject to a variation in minimizing the value given by
| (2) |
between logarithms of all the measured excitation energies in Fig. 1(a) and the calculated by using Eq. (1), where is the number of total data points considered. The adopted values of , , , and in Eq. (1) for the excitation energies of the first states are listed in the first row of Table 1. Our adopted bottom contour line, , is shown as the dashed curve in the upper panel of Fig. 1(a).
| Multipole | (MeV) | (MeV) | ||
|---|---|---|---|---|
| 34.9 | 1.00 | 1.19 | 0.36 | |
| 62.8 | 0.90 | 0.79 | 0.24 |
In Fig. 1(b), the excitation energies of the first states in even-even nuclei calculated with our formula, Eq. (1), with the parameter set given in Table 1 are plotted. The upper and the lower panels of Fig. 1(b) show the same results, but the curves in the upper panel connect isotopic chains while those in the lower panel connect isotonic chains. One can immediately find a very close resemblance between the curves in Figs. 1(a) and (b), the data and our results, respectively. (In the electronic version, the color code for an isotopic (isotonic) chain in Fig. 1(a) is the same as the color code for the corresponding isotopic (isotonic) chain in Fig. 1(b).) It is quite remarkable to note that a simple formula such as Eq. (1) can reproduce the data not only qualitatively but also quantitatively to some extent. Especially, the characteristic shape of the single large- neutron shell structure in isotopic chains and that of the single large- proton shell structure in isotonic chains is nicely reproduced by our formula.

The role played by the two exponential terms of Eq. (1) in reproducing the data can be seen in Fig. 2 where the excitation energies for nuclei between are displayed. The solid lines of the left part (a) of Fig. 2 are obtained by connecting the excitation energies that belong to isotopic chains while those of the right part (b) are obtained by connecting those that belong to isotonic chains. Let us first compare the central two panels and then the bottom two panels with the data in the top two panels. The solid lines of the left central panel are drawn by taking only the first two terms of Eq. (1), which show , and those of the right central panel are drawn by taking two similar terms, . We can observe that while the lines at the left (right) side of the left (right) central panel explain the data shown in the corresponding top panel quite reasonably, the same lines at the right (left) side of the left (right) central panel cannot reproduce the main features of the data, which show a monotonic increase in the excitation energy for increasing (decreasing) mass number . Now, by comparing the top two panels with the corresponding bottom ones, which are obtained by adding the term in the case of the left central panel or the term in the case of the right central panel, we find that the overall main features of the data are fairly well reproduced.
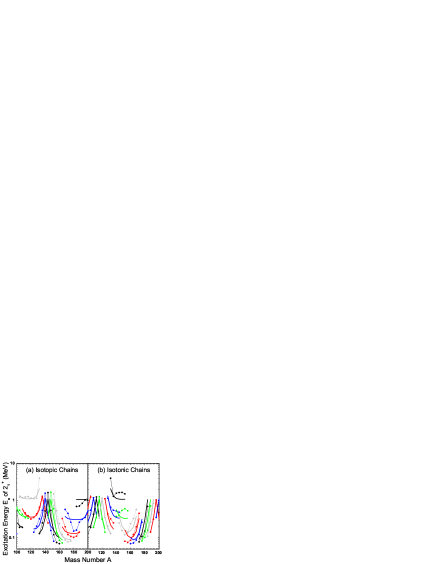
One can observe from Fig. 1 that the measured excitation energies for nuclei roughly between are explained best by our formula given by Eq. (1), even quantitatively to some extent. In order to examine them in more detail, we extract the corresponding part from Fig. 1, and out of it we create Fig. 3 where the calculated excitation energies and the data are plotted in the same panel. In Fig. 3(a), the calculated excitation energies of the isotopic chains are represented by thick solid curves while the measured ones of the corresponding isotopic chains are depicted by solid circles connected by thin solid lines. Figure 3(b) is drawn from exactly the same data points used in Fig. 3(a), but the points are connected for isotonic chains. However, three quarters of the data points that appear in Fig. 1 were excluded in making Fig. 3 to avoid too much complexity within a graph. It is noticeable in Fig. 3 that our formula, which is able to account for the essential trends in the systematic behavior of the excitation energies observed in Fig. 1 very successfully, has its shortcomings in explaining either the detailed shape or actual height of the measured isotopic or isotonic chains.
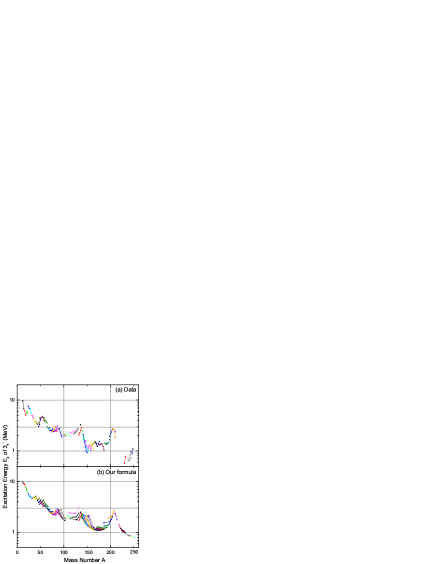
Encouraged by uncovering the fact that the valence nucleon numbers can be employed successfully in explaining the excitation energies of the first states in even-even nuclei throughout the periodic table, we decided to apply the above same procedure to the first states in even-even nuclei. Fortunately, a recently updated compilation of the excitation energies and the values between the ground state and the first state has been already published by Kibédi and Spear Kibedi .
The results for are presented in Fig. 4. The measured excitation energies shown in Fig. 4(a) are quoted from Ref. 8, and the calculated ones plotted in Fig. 4(b) are obtained by using Eq. (1). The solid lines connecting the data points in Figs. 4 (a) and (b) represent isotopic chains. Additional data points, which do not have measured counterparts in the part (a), are included in the part (b) for illustrative purposes. The four parameters, , , , and , in Eq. (1) for are determined by exactly the same fitting procedure as for , and the final adopted values are listed in the second row of Table 1. One can find a very close resemblance between (a) the data and (b) our results in Fig. 4 and conclude that the characteristic shape of the single large- shell structure is present in the excitation energies of the first states as well as of the first states, in even-even nuclei. The excitation energies estimated by using our simple formula may be of assistance in the various nuclear structure studies Lee-a ; Lee-b .
In summary, we have presented a simple formula that can describe the systematic behavior of excitation energies of the first and states in even-even nuclei. Our formula, given by Eq. (1), is composed of only three terms that depend on the mass number , the valence proton number , and the valence neutron number , respectively. The first term of Eq. (1) represents the overall dependence of the excitation energy on the mass number while the second (third) term reflects the single large- proton (neutron) shell structure found in each isotonic (isotopic) chain. We find that Eq. (1) can reproduce the essential trends of the measured excitation energies of the first and states, which were compiled extensively in Ref. 2 and Ref. 8, respectively. Furthermore, a preliminary study indicates that Eq. (1) can still be applied to the first excitation energies and to the second excitation energies in even-even nuclei Kim . Therefore, it would be most interesting if one can clarify the physics underlying the above observations.
Acknowledgements.
This work was supported by a Inha University research grant.References
- (1) S. Raman, C. H. Malarkey, W. T. Milner, C. W. Nestor, Jr., and P. H. Stelson, At. Data Nucl. Data Tables 36, 1 (1987).
- (2) S. Raman, C. W. Nestor, Jr., and P. Tikkanen, At. Data Nucl. Data Tables 78, 1 (2001).
- (3) S. Raman, C. W. Nestor, Jr., and K. H. Bhatt, Phys. Rev. C 37, 805 (1988).
- (4) S. Raman, C. W. Nestor, Jr., S. Kahane, and K. H. Bhatt, Phys. Rev. C 43, 556 (1991).
- (5) I. Hamamoto, Nucl. Phys. 73, 225 (1965).
- (6) R. F. Casten, Nucl. Phys. A443, 1 (1985).
- (7) R. F. Casten and N. V. Zamfir, J. Phys. G 22, 1521 (1996).
- (8) T. Kibédi and R. H. Spear, At. Data Nucl. Data Tables 80, 35 (2002).
- (9) Su Youn Lee and J. H. Lee, J. Korean Phys. Soc. 49, 2 (2006).
- (10) L. Zamick, A. Z. Mekjian, and S. J. Lee, J. Korean Phys. Soc. 47, 1 (2005).
- (11) D. Kim (private communication).