The neutron magnetic form factor from Quasi-Elastic inclusive scattering data on and 4He
Abstract
We analyze cross sections for Quasi-Elastic inclusive scattering of electrons on nuclei and show that the observed isolated peaks for relatively low are unique for the lightest targets. Focusing in particular on D and 4He, we investigate in two ways to what measure the above peaks can be allocated to nucleon-elastic processes. We first compute approximate upper limits for the nucleon-inelastic background in the Quasi-Elastic region due to inclusive excitation, and find those to be small. Far more precise is a semi-phenomenological approach, where the dominance of nucleon-elastic processes is translated into a set of stringent requirements. We show that those are very well fulfilled for recent D data, and to a somewhat lesser extent for older D and 4He data. With knowledge of and information on , we then extract and find agreement with values obtained by alternative methods. We discuss the sensitivity of the extraction method and mention future applications.
I Introduction.
Charge-current distributions of hadrons are basic sources of information, which may be compared with predictions of fundamental theories. Examples are static form factors of the neutron and its structure functions (SF) which depend on those distributions. Over many years, experimental efforts have been made to extract those observables with maximal accuracy. This requires high-quality data, and in parallel, accurate control of nuclear medium effects. In this note we focus on the magnetic form factor of the neutron.
A standard tool for the study of has been Quasi-Elastic (QE) electron scattering on a D for relatively low . We also mention semi-inclusive scattering experiments D, where or ank1 ; kubon , as well as total inclusive data on D up to lung . The varied kinematics in the latter experiment made it possible to perform a Rosenbluth separation and a subsequent isolation of transverse parts of cross sections. Once inelastic background effects are removed, one is left with a simple expression for .
Another source of information is the asymmetry in the inclusive process gao ; xu , which requires for its analysis a complete 3-body calculation. In most of those one has neglected Final State Interactions (FSI) or relativistic kinematics xu ; golak . The present range GeV2 will soon be considerably enlarged jones2 .
In the following we re-open the discussion on the extraction of from QE inclusive scattering on D and other targets. There is no change in the basic understanding of those reactions. New is the much improved accuracy, for instance, with which one nowadays computes wave functions for light targets bench . In parallel, more precise expressions for FSI have been also obtained. The above new input is here applied to analyze the total-inclusive data for light nuclei.
We base our analysis on a specific relation between nuclear and nucleon structure functions. The latter leads to the definition of the Nucleon Elastic (NE) and Nucleon Inelastic (NI) components of the inclusive cross sections for a composite target, which correspond to processes where a virtual photon leaves a struck in its ground state, or excites it.
In our analysis we consider recent D data arrd ; nicu , as well as older ones on 4He day and D lung . We first address inelastic contributions in the QE region. We estimate their magnitude on a model of inclusive - excitation and show that those are small compared to the QE total inclusive cross section. Next we formulate in a semi-empirical fashion stringent requirements which have to be fulfilled if total inclusive cross sections are dominated by their NE components. We find that those demands are accurately fulfilled for the recent D arrd ; nicu and to a somewhat lesser extent for the NE3 4He data day . In the same fashion we re-analyze separated transverse parts of the above-mentioned older D data lung and in parallel exploit the simultaneously measured total QE inclusive cross sections, which before have not been investigated in their own right.
In the above NE parts appear all four static form factors . Those for a proton have recently been determined with improved precision sill ; brash ; mjon , while is reasonably well known for GeV rocco . As a consequence one can extract from cross sections, provided those are indeed dominated by their NE components.
We show that the thus determined are essentially independent of both the QE data points chosen for extraction, and of the target nucleus. We discuss the sensitivity of our results to the quality of the experimental input and mention forthcoming precise data to which the presented extraction methods can be applied. Those will help to sharpen the results obtained below.
II Quasi-Elastic inclusive scattering.
II.1 Generalities.
Consider the cross section per nucleon for inclusive scattering over an angle of unpolarized electrons, with initial and final beam energies . The same, relative to the Mott cross section is
| (1) | |||||
are the nuclear SF which depend on the modulus of the squared 4-momentum transfer and on the Bjorken variable . With the nucleon mass, its range is . In order to calculate the nuclear SF, we shall exploit a previously postulated relation between nucleon and nuclear SF gr , which for isospin targets reads
| (2) |
The link between the SF and the nucleon SF (assumed to coincide with the free ones), is provided by the SF of a fictitious target composed of point-nucleons. It includes the effect of the mixing of the nucleon SF via the coefficients , which expression can be obtained using standard procedures atw ; sss . As usual, we take , and retain only in the expression above. In Appendix A we provide details.
Many data-analyses have been made with , calculated in the Plane Wave Impulse Approximation (PWIA) in terms of the single-hole spectral function ciof . We favor the Gersch-Rodriguez-Smith (GRS) theory for grs , which has recently been generalized for use in the relativistic regime gr1 . One of the reasons of our preference is the convergence of the GRS series to the exact , which is generally faster than is the case for the Impulse Series (IS). Moreover, it is more convenient to use the GRS series for a computation of FSI, which are present in gr ; gr1 ; rt .
II.2 Nucleon-Elastic and Inelastic components of SF.
We first consider in Eq. (2) the SF of nucleons and separate those in nucleon-elastic NE and NI parts (), which correspond to processes or (hadrons, partons). The NE components contribute only for , and contain the standard combinations of static electro-magnetic form factors )
| (3) | |||||
| (4) |
All except , have in the past been assumed to be of the dipole form , but recent experiments have detected deviations from 1 of the following quantities sill ; brash ; mjon
| (5) | |||||
| (6) |
with , the static magnetic moment of a .
In the relevant -range, the deviation of from 1 is moderate: After reaching a maximum of at decreases and crosses the value 1 for sill ; brash . In contrast, the measured deviation of from 1 is far more pronounced mjon
| (7) | |||||
As to the NI components, for sufficiently high we use parametrized data on bod and amad which are actually averages over structures, reflecting inclusive resonance excitations. Those stand out for relatively low , but get gradually smoothened for growing . For lack of direct information on the NI parts of the SF for a neutron are frequently approximated by
| (8) |
which is reasonable for . Only recently has for GeV2 been extracted with reasonable accuracy rtb .
The above division of the SF in NE and NI parts determines through Eq. (2) corresponding components in the reduced cross section defined in Eq. (1). For example,
| (9) |
and a similar expression defines . Explicitly, for nuclei commar
| (10) | |||||
| (11) | |||||
| (12) |
In. Eq. (12) we have used the Galster parametrization galster which approximately accounts for data for GeV2 rocco .
Using the definitions
| (13) |
one solves from Eqs. (9), (10) and 11), for the desired
| (14) |
Should transverse components be available, Eq. (14) for those reduces to
| (15) |
Next we discuss general trends of the NE, NI components as functions of in the QE region rt . The SF of a nucleus, composed of point nucleons, peaks around the QEP at ), and decreases strongly with increasing . Eqs. (10), (11) then implies similar behavior of . As regards the variation with , by far the strongest ones are due to the static form factors in , which approximately decrease as , while in Eq. (1) at constant is independent of .
The NI parts have entirely different characteristics. Most pronounced for fixed is their steady increase with (decreasing ), causing NI parts to dominate the deep inelastic region . For increasing , NI components decrease, but less rapid than do the NE ones. Ultimately NI competes with NE parts, even on the elastic side of the QEP.
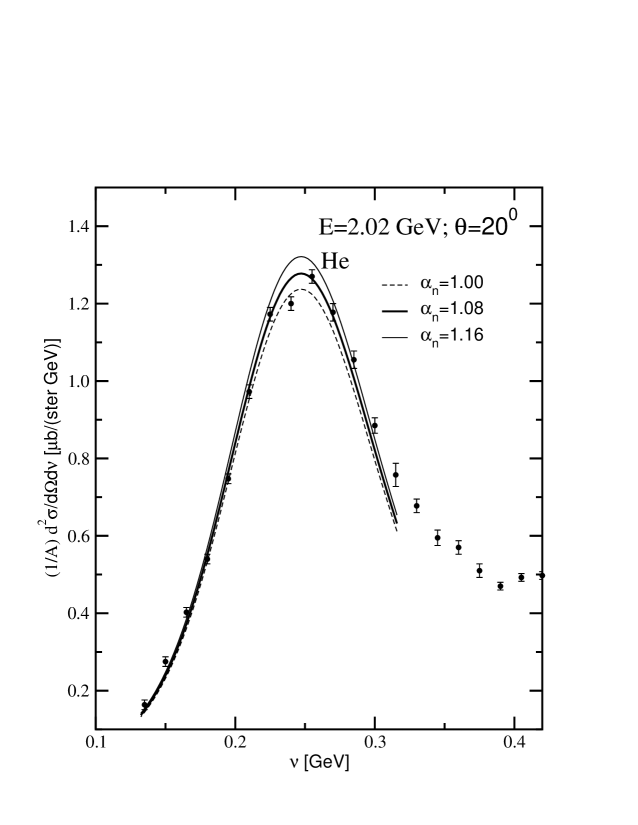
The above reasoning predicts that the reduced total cross sections for GeV2 generally vary smoothly with . Roughly speaking, around the QEP, , NI components overtake NE, which is reflected in a change of the logarithm of the slope of cross sections. The above behavior has indeed been observed for (see Fig. 1a), for which incidentally, the normalized hardly depend on rt . In contrast, the non-standard structure of the lightest nuclei with (for instance reflected in the quantitatively different single- momentum distributions), causes the normalized to be much sharper peaked, than is the case for . Fig. 2 illustrates this on for D, 4He, Fe (or C, Au), whereas Fig. 3 displays the dependence of .
From the above one predicts, that in medium and low cross sections for inclusive scattering on targets with , the QEP may stand out against a smooth background. With increasing , those peaks fade into the NI background. Both features appear confirmed by data (cf. Fig. (1b)).
We already argued that for decreasing the NE component increases relative to the NI one. Ultimately on reaches GeV2, below which Eq. (2) is no longer reliable as a tool for a calculation of NI. Yet, when wishing to extract information from NE parts of cross sections by their isolation, one clearly needs to know the relative size of the NI background.
Another difficulty in the same -region regards the use of parametrized, resonance-averaged , which masks actual resonance structures. In fact, one may exploit inclusive resonance excitation as a model for . As is the case for the NE parts, Eqs. (10), (11), we expect that, irrespective of the relatively low , Eq. (2) will properly produce the corresponding due to an isolated resonance of moderately small width. In Appendix B we present relevant material for . Should the numerical outcome indeed prove that NI is negligibly small compared to NE, the latter can be identified with actual data, i.e. .
III Analysis.
In the following we shall analyze the following QE data sets:
B) 4He data for =2.02 GeV, and = 3.595 GeV, day . Those may well be the first QE inclusive scattering data on a nucleus, heavier than . to be used as a source for .
C) Older D-data for more or less constant GeV2 lung , which comprise total inclusive cross sections (14) at approximately the same for various beam energies and scattering angles and Rosenbluth-separated transverse components. Those contain only in conjunction with . Results for have in Ref. lung, been presented as effectively originating from data with , which implies some binning of bands of values.
We start with the NI cross sections , first estimated from inclusive production (Appendix B). In Table I we both enter results for a with its actual and a zero-width. One notices that the latter produces cross sections about a factor 2 lower than one with its actual width. This outcome warns against the use of an excitation amplitude into the tail of a resonance, far beyond, say, twice the width of the used Breit-Wigner amplitude (40).
In addition of the above, we also performed a standard calculation of for GeV2 using parametrized, resonance-averaged . The results are entered in the 7th column of Table I and enable a comparison with the resonance-excitation predictions. We estimate that only the entry for GeV2 may be indicative of the actual size of .
From the results in Table I it is difficult to reach a firm conclusion regarding the size and -dependence of the NI background around the QEP. Recalling that Eq. (41) give an upper limit for , we tend to conclude that in the QE region of the considered experiments the computed excitation contributions are small and presumably negligible. Nevertheless, the conclusion is not firm, and it is desirable to look for corroborative evidence, which confirms NE dominance. Only then can one safely extract from Eq. (9).
Such support can actually be found in a semi-empirical fashion directly from data, specifically on the elastic side , of the QEP, and for sufficiently small , in addition on its adjacent inelastic side . In order to conclude that the data in those regions are essentially uncontaminated NE, and thus directly accessible to the extraction of by means of Eqs. (9)–(11), the following requirements ought to be fulfilled:
i) In QE regions , with the -value (), where the NI part about overtakes the NE component, the cross sections should follow the computed bell-shaped -dependence of , with computed target and dependence.
ii) Extracted from either Eq. (14) or (15) should not depend on the -values chosen for the extraction.
iii) should not depend on the target in which the neutron is embedded.
With the source of the strongest variation with , requirements i) and ii) demand that in Eq. (9) be -independent, and moreover, that tan. The same nuclear SF carries the -dependence, which we recall, is most pronounced for : the ratio in Eq. (9) should be -independent.
The above conditions are quite stringent and lean heavily on the central role played by . Of course, it is always possible to fit one or two points on the elastic side of the QEP (), whether or not the cross sections do contain some NI part in addition to the NE component. However, since NI parts grow with decreasing (increasing ), a fit of NE based on one or two points, cannot possibly hide a NI component over an interval .
The above is most expediently tested on QE data which are represented on a linear scale. Figs. 4 and 5 show that criterion i) is very well met for recent, high-quality D data in the elastic neighborhood of the QEP. As a result we could extract, for a range of selected data points, , and from those an unbiased average and an error of the mean.
For decreasing into the inelastic region of the QEP (increasing ), differences emerge between the measured and computed NE cross sections for fixed . Those reflect the growing importance of NI parts, for and increasing with .
The very quality of the fit makes one wonder why, for the stated average , the maxima of the two D cross sections is off by 3-5 . We probed, sometimes substantially larger and the result for those is common to all cases to be discussed: even a 10% increase in hardly affects the NE wings and only moderately changes the peak area. Those bridge only a small part of the discrepancy there, while the error from the mean generally grows. It seems more likely that, what seems to be a tiny misfit at the QEP, is actually the onset of NI at about the same . In line with expectations, those are smooth in .
It is of course desirable to have an error estimate due to the systematic errors in the cross sections. In spite of the fact that the latter are only of the order of a few , the resulting averaged error estimates may be large fractions of the average . Clearly, the desired error estimates require far smaller systematic errors on the data than are presently available. The above failure actually contains information: provided the data are smooth and have a small error of the mean, the method of extraction of and its average is quite sensitive to the central data. This is borne out by the above D data sets A).
At this point we make a digression and report on an attempt to fit the D data, with for , or alternatively with a -independent . The result, the dashed curve in Fig. 5, manifestly produces a far worse fit than the the drawn line for with the appropriate to . The above supports (but does not prove) the assumption that the SF in the link (2) is -dependent, as its interpretation as a SF of a nucleus demands. It runs counter the claim that is -independent, which holds in the PWIA (see for instance Ref. ath, ), but not for the GRS theory used above.
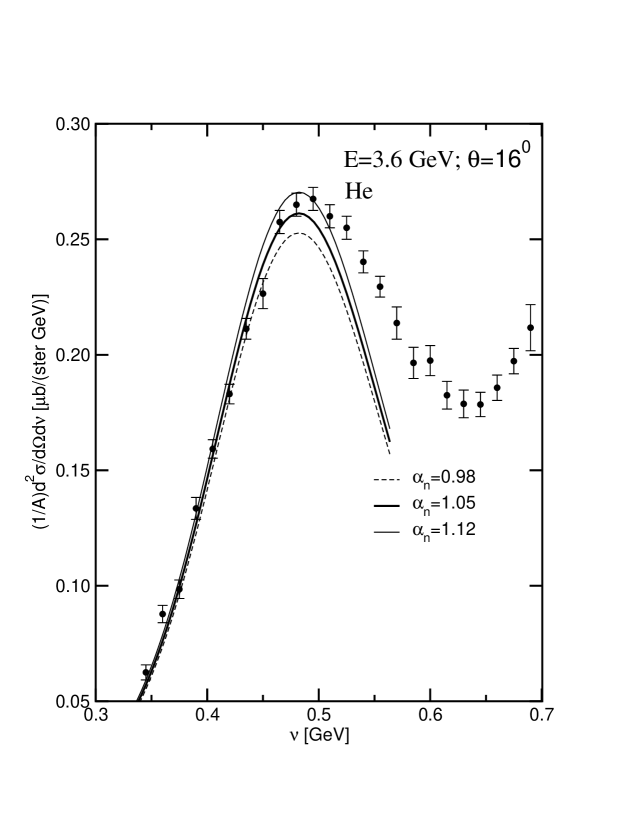
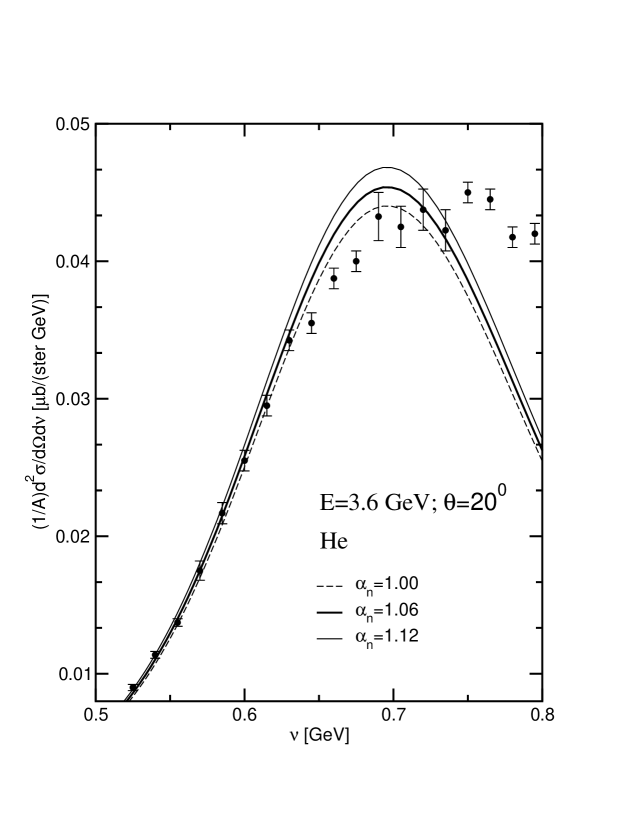
Next we discuss the above mentioned older 4He data sets day . As a comparison of Figs. 4,5 and Figs. 6–8 shows, the quality of the He data is inferior to those for D and consequently one cannot expect a similar precision for , as obtained from the above D data.
An additional complication is the non-negligible mixing of nucleon SF in , which is primarily determined by , given by Eq. (29). Although qualitatively understood, any evaluation amounts in practice to an approximation.
B1) GeV, : Fig. 6 reports our predictions for a number of . A characteristic pattern for this case and the others mentioned below is the insensitivity of the cross section on the elastic side for even changes in . However, those do matter around the QEP and beyond. Since the average GeV2 is very low, one expects NE still to dominate in some range on the inelastic side of the QEP, which increases the sample of points. From a total of 9, one extracts an average . Taking out the irregular point GeV close to the QEP, the average increases to 1.10. Either value is higher than most other extracted ones for similar . However, a 10% NI contribution at the QEP and extrapolated behaviour about it causes an appreciable decrease of . With as yet no accurate NI estimate, one can only point at sensitivity.
B2) GeV, : Fig. 7 shows that, as expected, the NI component grows relative to NE component on the inelastic side of the QEP. Limiting the sample to 9 points with GeV GeV, the average is obtained.
B3) GeV, : the data show substantial noise around the QEP and in the near-NI region (see Fig. 8). The QEP is hardly visible for this case. One clearly cannot well fit both the elastic slope and the QEP region. The average over 8 points with GeV produces . The curves reported in Fig. 8 are for .
We only briefly mention the total cross sections and separated transverse D data of Lung lung (sets C)). Part of those are for medium, and part for larger : all reduced data follow the theoretical predictions, but only to about 10 accuracy. We note that for all the data are given only to two decimals. Therefore, in spite of the approximately fulfilled requirement i), insufficient accuracy hampers the drawing of sharper conclusions.
To the above one may add that the extracted results may well be affected by the precision of the Rosenbluth separation (cf. Figs. 55 and Table 22 in Lung’s PhD Thesis lung ). The latter appears to have been renormalized to one nominal , which implies some binning. Consequently, in spite of the fact that the Rosenbluth-separated contains a simpler form for than does the total cross sections, we consider the latter to be a competitive and fiducial tool for extraction.
Table II summarizes our results for . Column 1 indicates the targets for which total QE inclusive cross sections have been analyzed, whereas the same for separated transverse data are denoted by . Columns 2-5 contain the beam energies, the scattering angles, ranges of the considered Bjorken on the elastic side up to, and just over the QEP, and the corresponding ranges of . The separated are all for fixed at the QE peak and correspond to renormalized energies and fixed lung . The 6-th column gives ranges of the point-nucleon nuclear SF, with in parenthesis values at the QEP. The last column presents the values of the extracted , which measures the deviation of from a dipole form factor. As discussed above, we only give errors of the mean values and do not include systematic errors in the underlying data. between parenthesis in the last column are the results of Lung lung .
The results in Table II and a few earlier values of are shown in Fig. 9. The values, obtained in the present analysis are seen to agree amongst themselves and, within the experimental accuracy with information from other sources.
IV Summary and Conclusions.
We have analyzed QE inclusive scattering on D and 4He. From the general behavior of NE components, where a nucleon in the medium absorbs a virtual photon without being excited, we concluded that one should observe an outstanding QEP in moderate cross sections for inclusive scattering on the lightest targets. For non-separated cross sections, those NE parts contain all four static form factors, as well as , the computed SF of a nucleus composed of point-nucleons. With knowledge of and information on , the NE component of the cross section is a measure for .
In order to assess to what extent the experimental QE cross sections are well represented by the uncontaminated NE component, one has to know the size of the NI background, relative to NE. We first assumed that the dominant NI parts are generated by the excitation of resonances. In general their contributions on the elastic side of the QEP are small. However, those NI estimates for the QE region in the tail of the Breit-Wigner excitation amplitude are presumably not sufficiently precise.
In a far more reliable, semi-empirical approach, one compares the -dependence of the reduced cross section data in the immediate region of the QEP with the theoretical prediction, Eqs. (9)–(11) for a purely NE component. Our results:
1) The values , extracted from the QE part of recent D data, show little variation with and an unbiased average produces excellent fits to the recent D data. As expected, deviations due to NI appear on the inelastic side of the QEP and grow with and .
2) The poorer quality of the He data bars an equally clean result for the He data. Nevertheless we could extract from those reasonable . The one for the lowest is a standard deviation higher than other extracted values.
3) We re-analyzed Lung’s non-separated D cross sections for similar , but different . For increasing , the relative weight of grows, but simultaneously, information on becomes increasingly scant. We therefore only analyzed total cross sections for the lowest GeV2 of the above experiment.
4) The same experiment with varied kinematics provides , in principle the simplest source of from inclusive QE scattering. One expects the above source and unseparated data to produce the same . The entries in Table II bear this out for GeV 2, while Lung’s value from for GeV 2 somewhat exceeds our result. However, for the larger measured , our analysis seems to show a stronger downward trend of for growing than reported by Lung.
It is clear from our analysis that the extracted are sensitive to the precision of the input. For instance, a 5 changes in cross sections may produce ten times larger relative changes in . The same prevents the allocation of systematic ′errors′ to extracted , due to the same in the data.
We conclude that medium QE inclusive scattering on light nuclei provide an accurate tool to determine , with as single most important source of lack of accuracy, the same in the underlying data.
Until recently we were rather pessimistic as to prospects for new information. It appears however, that new JLab data on 3He have already been taken, D data are forthcoming, while experiments on 4He have been approved. Once analyzed, those data will be directly accessible to the above analysis and promise to sharpen the predictions in this communication, in particular for 4He.
In parallel, measurements will extend reliable information on over a wider range bro . This will enable to establish whether and continue to behave similarly as function of .
V Acknowledgements.
ASR has profited from discussions with several experimentalists at JLab, in particular with Haiyan Gao, Cynthia Keppel and Doug Higinbotham and others. ASR thanks Jian-Ping Ling for emphasizing the need to ascertain the role of resonance tails in the QE region. Allison Lung supported our re-analyses of her NE11 data and Paul Stoler helped in locating inclusive production data.
Appendix A Discussion of the mixing coefficient in the GRS theory
The sensitivity of the extracted from inclusive scattering data, in particular for low , calls for scrutiny in the handling of tools for analysis. A delicate aspect of the theory used here concerns the mixing coefficients entering Eq. (2). All treatments and applications we know of are based on a comparison of hadron tensors of the target and of an isolated nucleon in the PWIA of the full IS atw ; sss . Those tensors contain invariants and , with , , the 4-momenta of the struck and the target, and are related by the single-hole spectral function of the target
| (16) |
Expressing the hadron tensors by use of the invariant SF , one obtains
| (17) |
| (18) |
where is the component of the 3-momentum of the struck nucleon along . The dominant coefficient reads
| (19) |
where . The mixing coefficients and atw ; sss , while is negligibly small.
We evaluate the integral in Eq. (19) making the standard assumption that the spectator nucleus is on its mass shell. Energy conservation in the vertex then determines . In the target rest frame
| (20) | |||||
where is the mass of the system in the -excited state and the mass of the target in its ground state. In the following, we will neglect the recoil energy of the spectator and therefore
| (21) |
where the excitation energy of the sytem and the smallest separation energy of the nucleon system from the target. One can easily transform the integration over in an integral over .
We now specifically turn to GRS theory. First, whereas , the SF of a nucleus composed of point-nucleons, has FSI contributions due to scattering of off–mass shell nucleons, GRS assumes to be the SF of an on-shell nucleon. Consequently the argument of the nucleon SF becomes
| (22) |
and the mixing coefficient in Eq. (19) now reads
| (23) |
We write the GRS SF of a nucleus composed by point-nucleons as a lowest order term, supplemented by a FSI term,
| (24) |
The lowest order can be derived from Eq. (17) using the assumption (22). Writing , the in Eq. (17) becomes
Appendix B inclusive cross section
In the following we discuss the NI background in the QE region, as due to inclusive electro-excitation of the lowest -resonance. Its cross section for a proton is
| (30) | |||||
| (31) |
Since all data are for forward angles, it suffices to consider only . denotes a transition form factor to be given below and the number in Eq. (31) accounts for a proper normalization of the nearly-elastic resonance amplitude.
Total cross section data are frequently expressed in terms of those for transverse and longitudinal virtual photons (see for instance Ref. muld, )
| (32) | |||||
| (33) |
with
| (34) | |||||
| (35) |
the flux of virtual photons. For small one approximates , to be used in Eq. (35).
As regards the transition form factor in Eq. (31), we assume it to be of the form (cf. Eqs. (10), (11)) for NE).
| (36) |
with , some effective transition magnetic moment and the reduced transition form factor of a dipole form. The parameters in Eq. (36) are estimated by a comparison of small data for reduced cross sections with Eq. (31)
In particular at the top of the resonance
| (37) |
From data for =0.5, 1.0, 2.0 GeV2 (Figs. 12, 13, 14 in Ref.brasse ), we extracted GeV. Those values have been used in Eq. (36) for all relevant .
No such information exists for the neutron. However, guided by the behavior of the nucleon SF, averaged over resonances, (see for instance Ref. nicu2 ), it is reasonable to assume that
| (38) |
The above suffices to compute from Eq. (2)
| (39) | |||||
| (40) | |||||
Finally, the corresponding nuclear QE inclusive excitation cross section reads
| (41) | |||||
| (42) | |||||
| (43) |
with the value of the Bjorken variable at the resonance peak. Eq. (42) is the zero-width limit of (41), which resembles the NE part, if , and thus . The same limit of is obtained for , corresponding to the resonance position in , ultimately coinciding with the QEP.
For small, medium , is substantially larger than 1, i.e. the resonance peak is far from the QE region. In that case, the QEP region corresponds to the tail of , far from its maximum value , and consequently is expected to be small. For increasing values of , however, the resonance peak moves closer and closer to the QEP and the NI contribution to the total cross section at the QEP can become there quite sizable.
References
- (1) H. Anklin , Phys. Lett. B336, 313 (1994); B428, 248 (1998); E.E.W. Bruins Phys. Rev. Lett. 75, 21 (1995).
- (2) G. Kubon , Phys. Lett. B524, 26 (2002).
- (3) A. Lung , Phys. Rev. Lett. 70, 718 (1993); PhD. thesis, The American University, Washington D.C., 1992.
- (4) H. Gao , Phys. Rev. C 50, R546 (1994).
- (5) W. Xu , Phys. Rev. Lett. 85, 2900 (2000); F. Xiong , Phys. Rev. Lett 87, 242501 (2002); W. Xu , Phys. Rev. C 67, 012201 (2003).
- (6) J. Golak , Phys. Rev. C 66, 024008 (2002)
- (7) M. Jones, private communication.
- (8) H. Kamada , Phys. Rev. C 64, 044001 (2001).
- (9) J. Arrington , Phys. Rev. C 64, 014602 (2001).
- (10) I. Niculescu . Phys. Rev. Lett. 85, 1182 (2000).
- (11) D.B. Day , Phys. Rev. C 48, 1849 (1993).
- (12) A.F. Sill , Phys. Rev. D 48, 29 (1993); L. Andivahis , Phys. Rev. D50, 5491 (1994).
- (13) E.J. Brash, A. Kozlov, Sh. Li, G.M. Huber, Phys. Rev. C 65, 051001 (2002).
- (14) M. Jones , Phys. Rev. Lett. 84, 1398 (2000); Third Workshop on ’Perspective in Hadronic Physics’ Trieste 2001, IT; to be published; O. Gayou , Phys. Rev. C64, 038202 (2001).
- (15) R. Schiavilla and I. Sick, Phys. Rev. C 64, 041002(R) (2001).
- (16) S.A. Gurvitz and A.S. Rinat, TR-PR-93-77/ WIS-93/97/Oct-PH; Progress in Nuclear and Particle Physics, Vol. 34, 245 (1995).
- (17) G.B. West, Ann. of Phys. (NY) 74, 646 (1972); W.B. Atwood and G.B. West, Phys. Rev. D7, 773 (1973).
- (18) M.M. Sargsian, S. Simula and M.I. Strikman, Phys. Rev. C66, 024001 (2002)
- (19) See for instance: C. Ciofi degli Atti, E. Pace and G. Salme, Phys. Rev. C 43, 1155 (1991).
- (20) H. Gersch, L.J. Rodriguez and Phil N. Smith, Phys. Rev. A5, 1347 (1973).
- (21) S.A. Gurvitz and A.S. Rinat, Phys. Rev. C 65, 024310 (2002).
- (22) A.S. Rinat and M.F. Taragin, Nucl. Phys. A598, 349 (1996); A620, 412 (1997); Erratum: A623, 773 (1997); Phys Rev. C 60, 044601 (1999).
- (23) C.H. Llewelyn Smith, Phys. Lett. B 128 (1983) 107; M. Ericson and A.W. Thomas, p. 112.
- (24) A. Bodek and J.L. Ritchie, Phys. Rev. D23, 1070 (1981)
- (25) P. Amadrauz , Phys. Lett. B295, 159 (1992); M. Arneodo B364, 107 (1995)
- (26) A.S. Rinat and M.F. Taragin, Phys. Lett. 551, 284 (2003).
- (27) A.S. Rinat and M.F. Taragin, Phys. Rev. C 62, 034602 (2000).
- (28) S. Galster , Nucl. Phys. B32, 221 (1971).
- (29) J. Arrington . Phys. Rev. Lett. 82, 2056 (1999).
- (30) A.S. Rinat and M.F. Taragin, Phys. Rev. C 65, 042201(R) (2001).
- (31) R.L. Jaffe, Nucl. Phys. A478, 3c (1988); R.P. Bickerstaff and A.W. Thomas, J. Phys. G 15, 1523 (1989).
- (32) M. Viviani, A. Kievsky and A.S. Rinat, nucl-th/0111049, Phys. Rev. C67, 034003 (2003).
- (33) S.A. Gurvitz, Phys. Rev. C 42, 2653 (1990).
- (34) P.J. Mulders, Phys. Reports, 185, 83 (1990).
- (35) F.W. Brasse , Nucl. Phys. B 110, 413 (1976).
- (36) E.D. Bloom and F.J. Gilman, Phys. Rev. Lett. 25, 1140 (1970); Phys. Rev. D 4, 2901 (1971); I. Niculescu , Phys. Rev. Lett. 85, 1186 (2000).
- (37) W. Brooks, private communication.


. target arrd ; nicu 4.045, 0.972, 0.601 0.465, 1.131 0.0193 0.0089 0.0162 0.178 0.495, 1.054 0.0368 0.0130 0.0225 0.263 0.525, 0.985 0.0656 0.0193 0.0627 0.435 0.555, 0.922 0.0827 0.0295 0.1110 0.312 arrd ; nicu 4.045, 1.94, 0.750 0.975, 1.079 0.00195 0.00096 0.00050 0.0064 1.005, 1.037 0.00325 0.00150 0.00084 0.0108 1.035, 0.997 0.00531 0.00225 0.00138 0.0248 1.065, 0.959 0.00806 0.00363 0.00232 0.0126 4He day 2.02, 0.434, 0.402 0.210, 1.125 0.0580 0.0202 0.256 0.973 0.225, 1.035 0.0833 0.0281 0.386 1.173 0.240, 0.962 0.1122 0.0382 0.535 1.200 0.255, 0.898 0.1442 0.0504 0.704 1.270 4He day 3.595, 0.872, 0.575 0.420, 1.121 0.0322 0.0165 0.0297 0.183 0.450, 1.037 0.0520 0.0259 0.0488 0.227 0.465, 0.998 0.0629 0.0318 0.0607 0.258 0.480, 0.963 0.0824 0.0399 0.0766 0.227 4He day 3.595, 1.266, 0.662 0.615, 1.119 0.008 0.0039 0.0029 0.0293 0.645, 1.056 0.015 0.0086 0.0069 0.0343 0.675, 0.999 0.021 0.0126 0.0105 0.0400 0.705, 0.947 0.029 0.0186 0.0144 0.0425
| target | [GeV] | |||||
| 4He day | 2.02 | 1.018-0.745 | 0.444-0.430 | 1.18-1.20 (1.49) | 1.08 | |
| 3.595 | 1.041-0.908 | 0.887-0.864 | 1.57-1.92 (1.92) | 1.05 | ||
| 3.595 | 1.126-0.905 | 1.275-1.250 | 1.28-2.11 (2.16) | 1.06 | ||
| arrd ; nicu | 4.045 | 1.131-0.953 | 0.988-0.972 | 1.31-3.65 (4.30) | 1.039 | |
| 4.045 | 1.079-0.978 | 1.976-1.929 | 2.44-5.18 (5.18) | 1.062 | ||
| lung | 5.507 | 1.063-0.978 | 1.769-1.741 | 2.89-5.04 (5.31) | 1.055 | |
| 2.407 | 1.081-0.957 | 1.803-1.721 | 2.37-4.89 (5.32) | 1.050 | ||
| 1.511 | 1.059-0.977 | 1.812-1.728 | 3.21-4.79 (5.26) | 1.057 | ||
| 3.809 | 1.141-0.962 | =1.75 | 1.79-3.38 (5.31) | 1.004 | ||
| lung | 5.507 | 1.104-1.000 | 2.561-2.501 | 1.69-5.65 (5.98) | 1.032 | |
| 2.837 | 1.101-0.991 | 2.613-2.500 | 1.69-5.91 (5.94) | 1.031 | ||
| 1.968 | 1.064-0.984 | 2.608-2.474 | 3.06-5.71 (5.90) | 1.078 | ||
| 5.016 | 1.068-0.940 | =2.50 | 2.92-4.16 (5.94) | 0.986 (1.014 | ||
| 5.016 | 1.051-0.958 | =3.25 | 3.50-6.15 (6.43) | 0.940 (0.967 | ||
| 5.016 | 1.079-1.038 | =4.00 | 3.80-6.20 (6.50) | 0.830 (0.923 |