Threshold hyperon production in proton–proton collisions at COSY–11
Abstract
hyperon production was measured at the COSY–11 spectrometer via the reaction at excess energies of = 13 MeV and = 60 MeV. These measurements continue systematic hyperon production studies via the / reactions where a strong decrease of the cross section ratio near threshold was observed. In order to verify models developed for the description of the and production we have performed the measurement on the hyperon and found unexpectedly that the total cross section is by more than one order of magnitude larger than predicted by all models investigated.
After the reconstruction of the kaon and neutron four momenta, the is identified via the missing mass technique. Details of the method and the measurement will be given and discussed in view of theoretical models.
pacs:
13.60.Hb, 13.75.-n, 25.40.Ve, 28.20.-nI Introduction
The study of hyperon production in hadron induced multi particle exit channels like involves several aspects. The nucleon–hyperon interaction can be extracted by analyzing the subsystem in the appropriate kinematical region. Closely related to that is the issue of the reaction mechanisms of the hyperon production which have to be clarified for an unambiguous interpretation of the data. If the hyperon production is due to the excitation and a subsequent decay of intermediate nucleon resonances than information about the structure of the relevant resonances can be extracted.
The excitation function near threshold shows a clear deviation from a pure s–wave phase space distribution, and the proton–hyperon final state interaction (FSI) has to be included to describe the data bal98 ; sew99 ; kow02 ; FW . In the channel the FSI seems to be negligible and the pure s–wave phase space calculations follow the data points reasonably well. The cross section ratio below excess energies of 20 MeV is about 28 sew99 ; kow02 in contrast to the value of about 2.5 determined for excess energies higher than MeV bald88 (see figure 1). This value is in good agreement with the isospin relation. The question arises if this drastic increase of the cross section ratio near threshold is a mere effect of the FSI or wether it is partly due to the reaction mechanisms in the channels. To explain the increase of the cross section ratio in the near threshold region, different scenarios were proposed.

Calculations of the strangeness production based on incoherent and exchange have been performed in Ref. sib99 . The and scattering amplitudes for pion and kaon exchange, respectively, were taken from the existing data in the higher energy region bald88 . This incoherent exchange model describes the cross section over the whole energy range, however in the near threshold region the channel is overestimated, and thus the predicted ratio is too low for 20 MeV (see curve (1) in figure 1).
A better description of the strong rise of the ratio towards lower -values is achieved by the resonance model (curve (2) in figure 1) sib99 ; sib00 ; shy01 ; tsu99 . In this model the nonresonant direct contributions like or exchange were not included, but the , and meson exchange with the excitation of the intermediate baryonic resonances (1650), (1710), (1720) and (1920) are taken into account. In this resonance model the near threshold region of the cross section ratio seems to be better reproduced than the higher energy values (i.e. 10 MeV). It should be stressed that in these calculations the parameters were fixed on the basis of higher energy data, before the near threshold and data were available.
Other calculations by Shyam shy04 (based on the effective Lagrangian model) for the strangeness production include meson exchange ( and ) together with the excitation of resonances. The coupling constant was determined from data of the , and reaction channels. The coherent sum of resonant states and meson exchange processes describe the experimental data for the and channels very well. The effective Lagrangian model is depicted by the curve (3) in figure 1.
The Jülich theory group has performed calculations including and exchange gas99 ; gas01 . In their approach the interaction between the hyperons (, ) and the nucleon is described by a microscopic (N-N) coupled channel model hol89 with a coherent superposition of the production amplitudes. The production is dominated by the exchange and therefore the contribution due to an interference between and exchange is negligible in this hyperon channel. On the other hand the and exchanges give a comparable contribution to the cross section in the case of production. An interference between and exchange amplitudes act very differently on the two channels. Within the Jülich meson exchange model the large cross section ratio can be described by a destructive interference of the and exchange amplitudes only. For excess energies above 20 MeV the model is not valid any more but qualitatively the cross section ratio given by the model stays at a nearly constant level.
Although the various descriptions of the cross section ratio differ even in the dominant reaction mechanism, all reproduce more or less the trend of an increase of the cross section ratio in the threshold region (see figure 1). The present data are not sufficient to unambiguously identify the dominant reaction mechanism. To clarify this point further data are needed. Especially the other isospin channels should allow information about the production mechanisms to be extracted. Recently, after the installation of a neutron detector in addition to the and production the reaction channel became accessible at the COSY–11 detection system. The measurement of the hyperon production via this reaction was performed at two beam momenta, = 2.6 GeV/c and = 2.74 GeV/c, corresponding to excess energies of 13 MeV and 60 MeV, respectively.
II Experiment
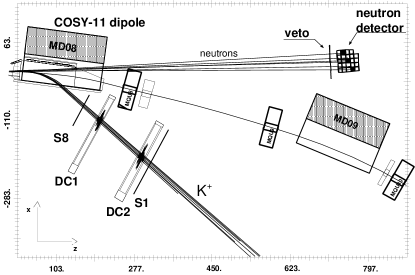
COSY–11 is an internal magnetic spectrometer at the COoler SYnchroton and storage ring COSY cosy_ring in Jülich. The interaction between a proton in the beam and a proton from the cluster target target-dom may lead to the production of the hyperon in the reaction. The charged reaction products are separated from the circulating beam in the magnetic field of one of the regular COSY dipoles bra96 . The hyperon is identified via the missing mass technique by detecting the and the neutron. The momentum vector () of the meson can be determined by tracking the trajectory reconstructed in the drift chambers (DC1 and DC2 in figure 2) through the known magnetic field back to the target point. The momentum vector together with the velocity () measurement in the two scintillators S8 and S1 are used to identify the kaon via its invariant mass .
Assuming that a hit in the neutron detector is from a neutron, the four momentum vector of the neutron is calculated by the measured velocity, the direction of the neutron (given by the first module hit) and the known mass. The background from charged particles incident on the neutron detector is discriminated by veto scintillators.
In figure 3 the experimental distributions of the squared missing mass () of the system for the two beam momenta are shown. For the higher momentum, an enhancement around the squared mass is clearly seen on a large background (figure 3b), but for the lower beam momentum (figure 3a) a peak is not directly visible.

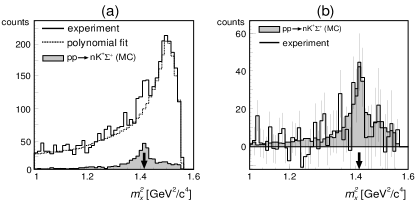
In order to determine the number of events in the higher energy data set, the background has been parametrized by a polynomial function which is added to the expected missing mass distribution of the system for the reaction obtained from simulation studies. In figure 4a the experimental missing mass spectrum of the system is compared with the fitted polynomial function. The expected distribution from Monte-Carlo studies with is depicted in the figure as well. Figure 4b shows the result of the subtraction of the polynomial from the experimental missing mass distribution together with the Monte-Carlo distribution.
In order to understand the background distribution, 22 reaction channels (mostly multi-pion reactions but also ) were simulated and their contributions to the missing mass distribution were determined. These studies showed that the reactions , and are the dominant background channels in the region. The Monte Carlo code includes the realistic geometry and physics processes like energy loss and straggling which occasionally cause the misidentification of the particle type.
All background channels result in a rather smooth distribution of the missing mass spectrum as can be inferred from calculations from Monte-Carlo studies and by comparing the two experimental distributions (see figure 3).
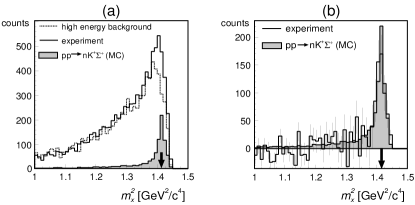
For the lower energy data set a peak is not obviously visible via the missing mass distribution. Therefore, a simple polynomial background parametrization cannot be used. To determine the number of events it was assumed that the background shape for this data set is the same as that at the higher energy. This assumption is justified since there are no new open channels for the higher energy.
At the COSY-11 experiment the shape of the missing mass distribution is mainly determined by the acceptance of the detection system and is dependent on the excess energy of an individual event. From the analysis of and production studies at COSY-11 it was verified that the background shape resulting here mainly from multi pion production is in very good agreement with the expectations from Monte Carlo studies taking into account the detector characteristics and is comparable at different beam momenta. In addition, Monte Carlo data of the reaction channels which contribute dominantly to the background in the production were compared in view of the background shape by adjusting the kinematical limits. Within error bars their shapes were identical. Therefore it is justified to assume that the background shape is the same for both beam momenta. For a detailed discussion on the background shape at COSY-11 we refer to mos06 . The background shape from the experimental missing mass distribution for the higher energy data set was shifted such that the kinematical limits for both spectra were the same. Afterwards, it was added to the missing mass distribution of the reaction which was determined from Monte-Carlo studies at the lower energy (see figure 5). The relative magnitudes were determined by the minimisation of the functional forms to the data sample at lower energy.
III Results
III.1 Total cross section
For the lower energy data set, no clear enhancement near the kaon mass in the invariant mass distribution is visible. Therefore the assumption was made, that the kaon peak in the experimental distribution has the same position and width as in the simulated distribution.
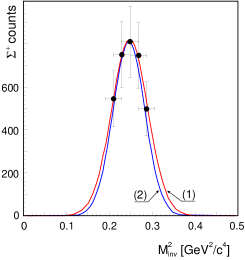
As a cross check, event samples in different regions of experimental invariant mass but still within the expected range for kaons were taken and the missing mass distributions were determined. The assumed background shape was subtracted from the experimental distribution and the enhancement around the mass of the was interpreted as a signal from the hyperon (see figure 5). This procedure was repeated for five different invariant mass regions and the number of events under the remaining peak was determined. The results are shown in figure 6. The vertical error bars correspond to the statistical error of the number of events. The horizontal error bars indicate the widths of the appropriate invariant mass intervals. In figure 6 curve (1) shows the expected invariant mass distribution of kaons from Monte-Carlo calculations. Curve (2) is a Gauss fit to the experimentally determined number of events in the different invariant mass regions. This can be interpreted as an experimental distribution of kaons. The assumed experimental kaon invariant mass distribution is consistent with the distribution expected from Monte-Carlo studies.
For the higher beam momentum a kaon peak is clearly visible in the invariant mass distribution and can be fit by a Gauss function. In a systematical study of the result at the higher beam momentum three different selections on the experimental invariant mass distribution were applied. Events from the following regions: , and centered around the nominal reconstructed mass () were taken and the corresponding missing mass distributions were generated. is the experimental resolution of this observable. Next the number of events for each of these distributions was determined. The results are listed in the middle column of table 1 and in the last column the number of the events corresponding to the full Gaussian distribution.
| Invariant | Number | Number of events identified |
|---|---|---|
| mass range | of events | as and scaled to the |
| identified as | full Gaussian distribution | |
| 0.25 | 187 51 | 944 257 |
| 0.5 | 367 83 | 960 217 |
| 1.0 | 661 134 | 969 197 |
In order to calculate the cross section for the reaction the number of hyperon events and the detection efficiency of the COSY–11 apparatus for the two excess energies were determined. The luminosity was determined by a simultaneous measurement of proton-proton elastic scattering.
In table 2 the total cross sections for both beam momenta are given. The systematical errors are due to: error of the detection efficiency determination which is 8.5 % for the lower and 3.5 % for the higher energy data set (including the inaccuracy of the effective detector position and of the beam momentum determination), uncertainty in the form of the background, and error of the luminosity calculation which is 3 % for both data sets and includes the uncertainty due to the normalization procedure and the error of the solid angle determination. For the data at 2.74 GeV/c the uncertainty in the background form was estimated by comparing the polynomial parametrization to a background form resulting from the sum of known background reaction channels generated in Monte Carlo studies. The difference is about 18%. For the data at 2.6 GeV/c the region used to normalize the background was varied resulting in an error of about 20%. The values in table 2 include also a change in the detection efficiency resulting from the inclusion of higher partial waves. Close to the reaction threshold partial wave contributions higher than are not expected. However, if the excess energy for a given channel goes beyond a few MeV it cannot be a priori neglected. The contribution of partial waves with is not known for the reaction investigated here. Thus, this effect has been studied by assuming a similar distribution of partial waves as measured in the channel studied by the TOF collaboration at COSY hessel ; fritsch ; tof_web . The inclusion of higher partial waves with a relative strength quoted in hessel ; fritsch lower the detection efficiency by 30 % for the lower and by 7.7 % for the higher energy data set. The sum of the total systematical errors equals 60 % for the lower and 34 % for the higher energy data set.
| Beam momentum | Excess energy | Total cross section |
|---|---|---|
| 2.60 | 13 | |
| 2.74 | 60 |
III.2 Comparison with model predictions
Among the models described in the introduction only two give predictions for the reaction, namely the Jülich meson exchange model gas99 ; gas01 and the resonance model sib99 ; tsu99 . Calculations of the production within the Jülich meson exchange model predict a total cross section of = 0.23 at = 13 MeV for the destructive interference (which was necessary to describe the high cross section ratio at threshold). This is about a factor of 20 below the experimental value of 4.56 b given in table 2. A constructive interference would result in a cross section even a factor of 53 too low.
For the resonance model the predictions for the channel for the near threshold region deviate even more from the data. In figure 7 the model predictions and the available data for the (a), (b) and (c) channels are shown. The filled data points presented by triangles, dots and squares in the near threshold region were measured by the COSY–11 collaboration bal98 ; sew99 ; kow02 . The data point in the channel indicated by the arrow was determined in parallel to this work by selecting the exit channel which was included in the events sample at 2.74 GeV/c. The high energy data for the given reactions were taken from bald88 and flamino . The model calculations for each channel are given by the solid lines tsu99 ; Sibi-pc .
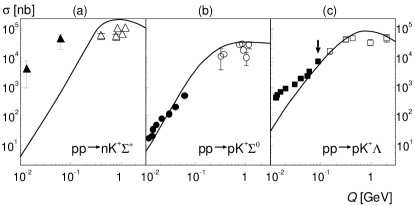
The data point for the channel at = 13 MeV is underestimated in the total cross section calculated using the resonance model sib99 ; tsu99 by about a factor of 500 and for = 60 MeV by about a factor of 50. For the channel, this model calculation describes the existing data set and in the case of the channel the underestimation of the cross section in the near threshold region is about a factor of 16 being 30 times smaller than for the production. At high excess energies, the data points are by factor 3 – 4 below the model calculations. Previous COSY–11 hyperon production studies conclude that final state interactions (FSI) plays an important role in the near threshold production bal98 ; sew99 ; kow02 ; bal98a . In the resonance model the FSI is not included sib99 ; tsu99 and therefore the deviation of the model calculations from the data points in the near threshold region is expected if a strong FSI is present. This effect is clearly seen for the and barely observed for the reaction channel.

Investigations of hyperon production in COSY–11 bal98 ; sew99 ; kow02 indicate that the data cannot be described by a pure 3-body phase space (PS) dependent cross section expressed as byckling :
| (1) |
where is a normalization factor and the excess energy. Therefore a modification is needed which takes into account the proton - hyperon FSI. In order to describe the near threshold region, the parametrisation of the excitation function including the FSI proposed by Fäldt-Wilkin FW was used. It is expressed by:
| (2) |
where and are parameters related to the FSI strength.
In figure 8 the cross sections for different production channels for the , and hyperons are compared to predictions based on the 3–body phase space (PS, dotted line) and the 3–body phase space calculations modified by the FSI (PS + FSI, solid line), following equation 2 with and as free parameters. These parameters are related to the scattering length a and the effective range r of the potential FW .
For the data the resulting and parameters have similar values as for the channel. It seems that for the production via the reaction a rather strong FSI is present, however, within the error bars also the curve obtained without FSI describes the two data points. Therefore an unambiguous conclusion about the FSI requires more data to disentangle the reaction mechanisms and especially the role of nuclear resonances.
IV Conclusions and perspectives
The total cross section of the reaction was determined by means of the COSY–11 detection system for excess energies of = 13 and 60 MeV. The values established are more than an order of magnitude larger than the expectations of currently available model predictions.
The unexpected large total production cross section is consistent with an observation by Tan TAN69 who concluded that when assuming charge symmetry in and scattering, the contribution from the diagram is less than one seventh of the contribution from the channel. Further, recently it was suggested that for the production SIB05 a strong enhancement of the reaction amplitude towards threshold might be due to the presence of a crypto exotic baryon with hidden strangeness. Although this observation is not directly applicable to other isospin channels, (in the system no corresponding structure was observed) it might be a hint of an exotic mechanism. In any case, present theoretical predictions of the cross sections strongly underestimate the experimental data. The comparison of the excitation function expected based upon phase space distribution including FSI to the data results in FSI parameters comparable to the system. This may indicate a strong interaction but due to the large systematic uncertainties the data are also consistent with a pure phase space distribution without FSI.
Further studies of the production are necessary to clarify the picture. On the experimental side additional data points should be added for which an improved event selectivity is favorable to reduce the large uncertainties introduced by the background subtraction. A detection system for neutral and charged particles which will be soon available with WASA at COSY could be used WASA . On the theoretical side an improved model has to be developed which consistently reproduces the hyperon cross section data near threshold.
V Acknowledgments
This work has been supported by the European Community - Access to Research Infrastructure action of the Improving Human Potential Programme, by the FFE grants (41266606 and 41266654) from the Research Center Jülich, by the DAAD Exchange Programme (PPP-Polen), and by the Polish State Committee for Scientific Research (grant No. PB1060/P03/2004/26).
VI Note added in proof
During the evaluation process of the article we have been made aware of the predictions of the excitation function of the total cross section for the reaction which is closer to the data in comparison with the models discussed, yet still underpredict the determined total cross sections by more than an order of magnitude shyamnew .
References
- (1) J. T. Balewski et al., Phys. Lett. B420 (1998) 211.
- (2) S. Sewerin et al., Phys. Rev. Lett. 83 (1999) 682.
- (3) P. Kowina et al., Eur. Phys. J. A22 (2004) 293.
- (4) G. Fäldt and C. Wilkin, Z. Phys. A357 (1997) 241.
- (5) A. Baldini et al., Total Cross-Section for Reactions of High-Energy Particles, Springer, Berlin, 1988.
- (6) A. Sibirtsev et al. Nucl. Phys. A646 (1999) 427.
- (7) A. Sibirtsev et al. nucl-th/0004022 v2 (2000).
- (8) R. Shyam et al., Phys. Rev. C63 (2001) 022202.
- (9) N. Tsushima et al., Phys. Rev. C59 (1999) 369.
- (10) R. Shyam, hep-ph/0406297 (2004).
- (11) A. Gasparian et al., Phys. Lett. B480 (2000) 273.
- (12) A. Gasparian et al., Nucl. Phys. A684 (2001) 397.
- (13) B. Holzenkamp et al., Nucl. Phys. A500 (1989) 485.
- (14) R. Maier, Nucl. Instr. & Meth. A390 (1997) 1.
- (15) H. Dombrowski et al., Nucl. Instr. & Meth. A386 (1997) 228.
- (16) S. Brauksiepe et al., Nucl. Instr. & Meth. A376 (1996) 397.
- (17) P. Moskal et al., J. Phys. G 32 (2006) 629.
- (18) D. Hesselbath, PhD. thesis, Universität Bonn, 2000.
- (19) M. Fritsch, PhD. thesis, Universität Erlangen, 2002.
- (20) http://www.fz-juelich.de/ikp/COSY-TOF.
- (21) V. Flamino et al., Compilation of Cross Sections, CERN-HERA 84-01 1984.
- (22) A. Sibirtsev, IKP, FZ–Jülich, Germany, priv. comm. (2005).
- (23) J. Balewski et al., Eur. Phys. J. A2 (1998) 99.
- (24) R. Bilger et al., Phys. Lett. B420 (1998) 217.
- (25) E. Byckling and K. Kajantie, Particle Kinematics, John Wiley & Sons Ltd., London 1973.
- (26) Tai Ho Tan, Phys. Rev. Lett. 23 (1969) 395.
- (27) A. Sibirtsev et al., Eur. Phys. J.A27 (2006) 263.
- (28) H.-H. Adam et al., Proposal for the WASA at COSY experiment, nucl-ex/0411038 (2004).
- (29) R. Shyam, Phys. Rev. C 73 (2006) 035211.