Low Mass Dimuon Production in Indium-Indium Collisions at the CERN SPS
NA60 is a fixed-target experiment at the CERN SPS which measured dimuon production in nucleus-nucleus and proton-nucleus collisions. In this paper we report on a precision measurement of low-mass muon pairs in 158 AGeV indium-indium collisions. A significant excess of pairs is observed above the yield expected from neutral meson decays. The excess can be isolated by subtraction of expected sources, thanks to the excellent mass resolution and large sample size.
The ultimate goal of heavy ion collisions is the detection of signatures of a phase transition from hadronic matter to a deconfined and/or chirally restored medium. One of the main observation from the heavy ion program at the CERN SPS is the excess of low mass dimuons in nucleus-nucleus collisions reported by the CERES experiment . This is usually understood in terms of in-medium modification of the meson, which could convey information about chiral symmetry restoration: changes in mass and/or width of the are predicted as the chiral phase transition is approached. Most of the models agree in predicting an increase in the width of the while several different predictions were formulated for its mass. The CERES data could be described by several significantly different models, so that an unambiguous interpretation of this result was not possible. A clear discrimination between different theoretical models requires good statistics and mass resolution, together with a good signal to background ratio. These requirements are met by the NA60 experiment.
NA60 is a fixed target experiment which measures dimuon production in nucleus-nucleus and proton-nucleus collisions at the CERN SPS. The apparatus is composed of 4 main detectors:(i) a muon spectrometer, which tracks muons and provides the trigger signal to the experiment; (ii) a Zero Degree Calorimeter, for centrality measurements; (iii) a silicon vertex tracker, which tracks particles in the vertex region; (iv) a silicon beam tracker, which tracks incoming beam particles before they hit the target. A complete description of the apparatus can be found elsewhere . Here we only briefly describe the detector concept. Experiments measuring dimuons usually put a hadron absorber in front of the muon spectrometer, to make sure only muons can reach this detector. This is also the main limiting factor, because of energy loss fluctuations and multiple scattering. NA60 overcomes this limitations by means of a vertex tracker , placed before the hadron absorber. Muons reconstructed in the muon spectrometer are extrapolated back to the vertex region and matched to vertex tracks, using both angles and momenta. This leads to a much improved vertexing (the origin of the muons can be accurately determined) and mass resolution (from roughly 80 MeV to 20 MeV at the mass).
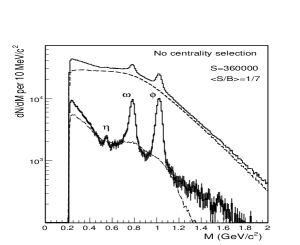
NA60 physics programme includes topics from the three mass region in which the dimuon invariant mass spectrum is customarily divided . In this paper results on the Low Mass Region (LMR, ) are reported. The data were collected in indium-indium collisions in 2003; the sample analyzed in this work consists of roughly half of the 230 million events put on tape. The data were selected requiring only one vertex in the target region, to avoid re-interactions and pile-up events. The tracks reconstructed in the muon spectrometer were then matched to vertex tracks as stated above, allowing to extract the invariant mass spectrum of the resulting muon pairs. This is affected by two main sources of background: the combinatorial background and the fake matches, which have to be subtracted. The combinatorial background is the contribution to the dimuon spectrum of uncorrelated pairs coming from decays of and K. This is estimated with an event mixing technique: two muons from different events are randomly paired to build an invariant mass spectrum, which is uncorrelated by construction. This technique automatically takes into account all experimental details, provided the muons are taken with the correct normalization. The NA60 apparatus not only triggers opposite sign pairs () but also like sign pairs ( and ), which are made of uncorrelated muons only. The real and mixed spectra for the like-sign should then be identical. This can be used to asses the quality of the estimated background. The accuracy was found to be of the order of 1% over several orders of magnitude . As for fake matches, they are mistakes produced by the matching algorithm: a muon track can be matched to the wrong track in the vertex telescope, giving rise to a distorted spectrum. These can be estimated in two different ways. The first approach is an overlay Monte Carlo technique, where a Monte Carlo dimuon is reconstructed on top of a real event, allowing to check the probability of getting a fake match. The second method is an event mixing method, which extracts the probability for fake matches from data alone. The basic idea is to match the tracks in the muon spectrometer from one event to the vertex tracks of a different event. All the matches obtained in this way are fake by construction. This technique is more complicated but more rigorous. It is not used in the present analysis, though is crucial for other NA60 physics topics . The two methods agree within 5%. Fake matches yield is less than 10% of the combinatorial background. The quality of the data after combinatorial background and fake matches subtraction is very good (Fig. 1, left): the signal/background ratio is 1/7 and the mass resolution at the peak is 23 MeV. The analysis of the LMR data was done in 4 centrality bins, selected using charged particle multiplicity density: peripheral (4-30), semiperipheral (30- 110), semicentral (110-170) and central (170-240). The signal to background ratio, from peripheral to central is: 2, 1/3, 1/8, 1/11. The acceptance of NA60 extends all the way down low masses and , as opposed to previous dimuon experiments. This is important because the excess observed by CERES in the dielectron channel is stronger at low pt.
The first step in the analysis was the study of the peripheral bin. In order to extract particle ratios in full phase space, data were fitted with expected sources: , , , , , , . The fit was done in 3 bins. The quality of the fit is very good. The results are found to be nearly independent of and in agreement with expectations, confirming that the acceptance is well under control. The particle ratios obtained from the fits without selection, corrected for acceptance and extrapolated to full phase space are , and . The errors quoted are purely statistical. The value for agrees with previously published results . The value for is higher than measured in pp and pA collisions, as expected from strangeness enhancement. The value for is higher than expected from pp or pA, probably due to the fact that even in peripheral indium-indium collisions some hadronic medium is created, where the is produced by annihilation.
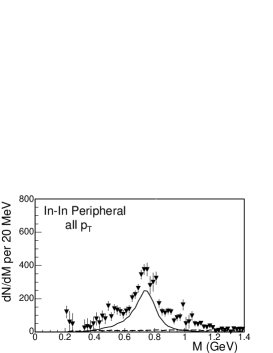
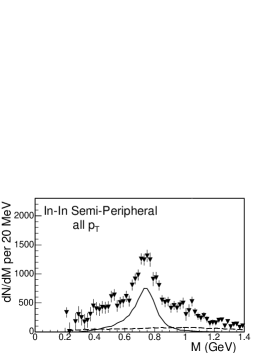
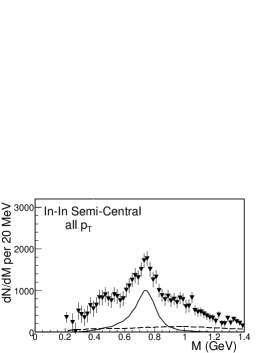

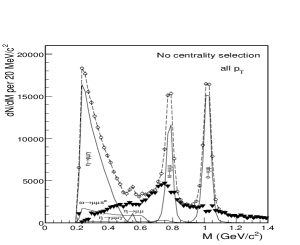
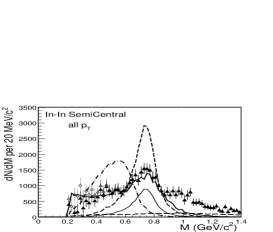
The more central bins could not be studied by a simple fitting procedure, because of the unknown source reported by CERES. Data were compared to a conservative cocktail, defined as follows: (i) the yields of and is fixed from the 2-body-decay peaks under the assumption that the underlying continuum is smooth (i.e. so as not to create any bump or dip in the spectrum after subtraction of these sources); (ii) the yield of the is fixed from the Dalitz channel saturating the very low mass part of the spectrum; (iii) the yield of the is fixed by assuming a ratio of 1.2 (as expected from previous pp and pBe measurements and from statistical models). The data show a clear excess when compared to this cocktail, becoming more pronounced with increasing centrality. Thanks to the good mass resolution, the excess could be isolated by subtraction of the known sources (Fig. 1, right), namely the conservative cocktail described above, with the exception of the : since the modification in the spectrum is generally understood as due to in-medium modification of this particle, it does not make sense to subtract from the spectrum its vacuum line-shape. The difference spectrum obtained in this way is a lower limit to the excess, as a consequence of the procedure adopted to fix yields (for example, there is no excess at very low masses by construction). Fig. 2 shows the excess as a function of centrality. For comparison, the cocktail and are also plotted. A clear excess rising with centrality and centered at the nominal pole is visible. The excess spectrum is robust against systematical uncertainties: both the combinatorial background and the fake matches are flat as a function of mass. A 1% error on combinatorial background or a 5% error on fake matches would not change the overall features of the spectrum. Changing the procedure to fix the normalization, for example by requiring that it accounts for 90% of the data at very low masses, has a small effect on the lowest part of the spectrum only, while the yield above 0.4 GeV is unaffected (Fig. 3).
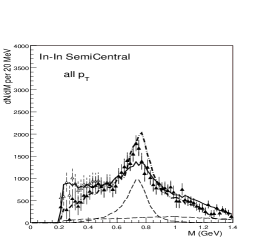
The excess was compared to theoretical models available before the NA60 data. Dropping mass scenarios seem to be ruled out, while broadening models are strongly favored as can be seen in the left part of Fig. 3 (theoretical models are normalized to data in the range ). None of the existing models was able to describe the data in full detail. The qualitative features of the spectrum are consistent with production via annihilation in the framework of a hadron many-body theory. The prediction, however, fails to describe the excess spectrum for . An updated version of this model, implementing an improved fireball dynamics and processes (including a contribution from vector-axialvector mixing) is able to describe the spectrum, even in absolute term (Fig. 3 right, solid curve). A different model, based on a similar idea but with a different technical implementation, considering only a hot pion gas without baryons (which are an essential ingredient in the previous approach) is also able to describe the data in absolute terms (Fig. 3 right, dashed-dotted curve). The processes are not included in this model. Both models require a continuum contribution from a partonic spectral function, which is much stronger in the second one and fills the high mass region. A conclusive discrimination between different scenarios may come from the study of the dependence of the excess data. Attempts to theoretically understand NA60 data are progressing steadily and more approaches, different from the ones briefly outlined here, are appearing in the literature .
References
- [1] CERES Collaboration, G. Agakichiev et al., Eur. Phys. J. C4, 231 (1998).
- [2] CERES Collaboration, G. Agakichiev et al., Phys. Lett. B422, 405 (1998); B. Lenkeit et al., Nucl. Phys. A661, 23c (1999); G. Agakichiev et al., Eur. Phys. J. C41, 475 (2005).
- [3] R. Rapp and J. Wambach, Adv. Nucl. Phys. 25, 1 (2000).
- [4] G. E. Brown and M. Rho, Phys. Rept. 363, 85 (2002).
- [5] NA60 Collaboration, G. Usai et al., Eur. Phys. J. C43, 415 (2005).
- [6] M. Keil et al., Nucl. Instrum. Meth. A539, 137 (2005) and A546, 448 (2005).
- [7] C. Lourenco, Nucl. Phys. A 698, 13 (2002) [arXiv:hep-ex/0105053].
- [8] NA60 Collaboration, R. Shahoian et al., PoS HEP2005, 131 (2006).
- [9] NA60 Collaboration, S. Damjanovic et al., Phys. Rev. Lett. 96 (2006) 162302 arXiv:nucl-ex/0605007.
- [10] T. Renk and J. Ruppert, arXiv:hep-ph/0605130.
- [11] H. van Hees and R. Rapp, arXiv:hep-ph/0604269.
- [12] See, for example: V. V. Skokov and V. D. Toneev, arXiv:nucl-th/0509085; K. Dusling, D. Teaney and I. Zahed, arXiv:nucl-th/0604071.