Charged-Particle Pseudorapidity Distributions in Au+Au Collisions at GeV
Abstract
The charged-particle pseudorapidity density for Au+Au collisions at =62.4 GeV has been measured over a wide range of impact parameters and compared to results obtained at other energies. As a function of collision energy, the pseudorapidity distribution grows systematically both in height and width. The mid-rapidity density is found to grow approximately logarithmically between AGS energies and the top RHIC energy. As a function of centrality, there is an approximate factorization of the centrality dependence of the mid-rapidity yields and the overall multiplicity scale. The new results at =62.4 GeV confirm the previously observed phenomenon of “extended longitudinal scaling” in the pseudorapidity distributions when viewed in the rest frame of one of the colliding nuclei. It is also found that the evolution of the shape of the distribution with centrality is energy independent, when viewed in this reference frame. As a function of centrality, the total charged particle multiplicity scales linearly with the number of participant pairs as it was observed at other energies.
pacs:
25.75.DwIn previous publications the PHOBOS Collaboration has presented the full systematic behavior of inclusive charged particle production in heavy ion collisions over a large range of collision parameters: 1) from 19.6 GeV to 200 GeV, 2) Pseudorapidities from to , nearly the full solid angle, and 3) average impact parameter from fm, corresponding to 50-360 participating nucleons () Back:2000gw ; Back:2001ae ; Back:2001bq ; Back:2001xy ; Back:2002uc ; Back:2002wb ; Back:2004dy . While these data are already useful as a broad systematic study, several non-trivial features have been made manifest by direct comparisons between the data at different energies and centralities: 1) a logarithmic increase with in the mid-rapidity particle density Back:2001ae , 2) an approximate factorization of the centrality and energy dependence of the mid-rapidity yields Back:2004dy 3) the phenomenon of “limiting fragmentation” in the forward direction Back:2002wb , and 4) a linear “-scaling” of the total particle yield Back:2003xk . This paper presents for the first time the multiplicity data for Au+Au collisions at the most recent RHIC energy of GeV, corresponding to the top energy reported by several earlier experiments at the CERN ISR. With our new data, we can test the previously-found scaling relationships at an intermediate energy.
The data were obtained with the PHOBOS detectorBack:2003sr during the RHIC 2004 run. In this analysis only the data taken with the magnetic field switched off are analyzed. To select events with various ranges of impact parameter, characterized typically by , we use the particle multiplicity measured in two sets of “paddle” counters, situated at meters from the nominal interaction point. These cover a pseudorapidity range of with 95% azimuthal acceptance. The overall triggering and event selection efficiency at 62.4 GeV corresponds to of the total Au+Au inelastic cross section, estimated using HIJING simulations Gyulassy:1994ew . We use the Glauber model calculation implemented in HIJING to estimate for each centrality bin by assuming a monotonic relationship between and the relevant experimental observable. This procedure has been described in Refs. Back:2000gw ; Back:2001xy ; Back:2002uc . It was found that trigger efficiencies are typically around 100% for the top 50% of the total cross section at energies of and GeV. At the lowest energy of GeV, an alternative method of centrality determination was developed, that uses all particles detected in the “Octagon” silicon detector, covering , as a measure of the particle multiplicity Back:2002wb . These two methods agree within 3% at the higher energies and have been used as a cross-check in this analysis. However it should be noted that the two methods give values of that differ by in the most central bin, since this bin is more sensitive to the fluctuations of the variable used to estimate the centrality. Thus, we separate the tabulated results (in Table 1) for that bin, but do not in the other bins when they agree to better than .
Several methods were used to estimate the charged particle density in each centrality class. In the full phase space, a combination of data from the single-layer “Octagon” () and “Ring” () detectors were analyzed using two different techniques. In the “analog” method, the deposited energy in a detector pad is used to estimate the number of particles traversing the pad after accounting for orientation of the Si-wafer relative to the interaction point. The “digital” approach treats each pad as a binary counter and assumes Poisson statistics to estimate the total occupancy in various regions of pseudorapidity. These methods have been discussed in more detail in Refs. Back:2001bq and Back:2002wb . At mid-rapidity, the PHOBOS vertex detector, consisting of two planes covering over a limited azimuthal range, , is used to count “tracklets”. These are two-hit tracks which point back to the event vertex, providing redundancy not present in the single-layer analyses, and thereby reducing systematic effects at mid-rapidity. This method has been described in detail in Refs. Back:2001bq ; Back:2002uc ; Back:2004dy .
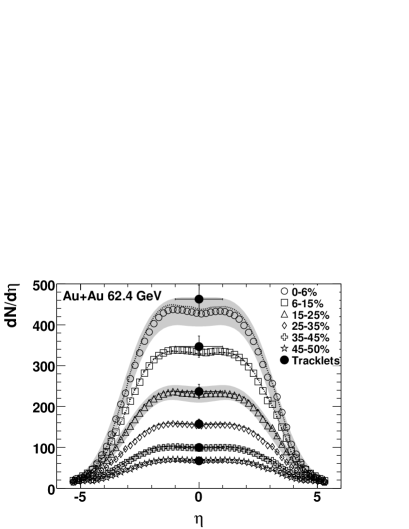
The GeV data are shown in Fig. 1 as a function of collision centrality, determined by the paddle-counter method. Results using the Octagon-based centrality method, shown for each bin by dotted lines, agree very well with those from the paddle-based method. Mid-rapidity data from the tracklet method also agree well with the single-Si-layer analysis over the full centrality range studied.
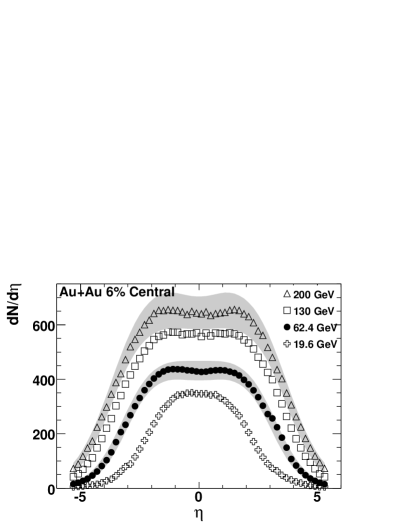
To place these data in context, Fig. 2 shows data from the most central collisions in comparison with similar data at 19.6, 130, and 200 GeV from Ref. Back:2002wb . Increases both in the height and width of the distribution are observed as a function of increasing energy. Already at GeV, the central “plateau” nascent at GeV is fully developed and grows in width slowly with increasing energy. Of course, the existence of a plateau in does not necessarily imply the existence of a plateau in because of the non-trivial transformation between rapidity and pseudorapidity () Back:2002wb .
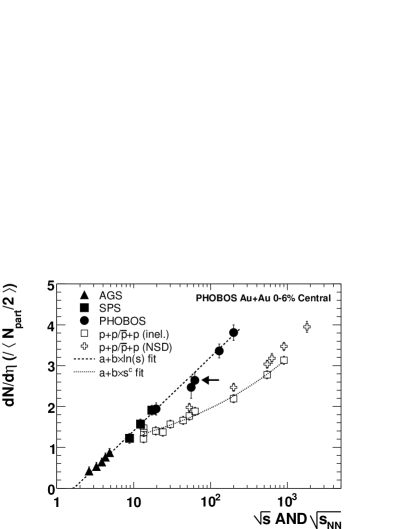
The scaled particle densities near midrapidity () for and GeV Back:2000gw ; Back:2001xy ; Back:2001ae ; Back:2002uc ; Back:2002wb ; Back:2004dy ; Back:2004je are shown as a function of collision energy in Fig. 3 for the 6% most central events. Where possible, PHOBOS results from the various measurement techniques have been averaged at each energy, weighted by the inverse square of the relative error. At GeV, this gives . Data from comparable centralities at lower energies are also shown, as compiled in Ref. Back:2004je . While high-statistics data from the three other RHIC energies suggested an approximately-logarithmic rise of the particle density, the low-statistics data point measured at GeV was found to be only barely consistent with a logarithmic fit based only on the data at and GeV (shown as a dashed line). The data point at GeV (indicated by an arrow in Fig. 3) falls closer to the fit, and is, within errors, consistent with the logarithmic rise. The data are compared to a wide range of and data, separately shown for inelastic as well as non-single diffractive events ua5 ; ua5physrep ; Abe:1989td . While these data also appear to rise logarithmically at higher energies, the inclusion of data points below 30 GeV appears to indicate a curvature in the energy dependence. To interpolate between the measured points, they have been fit by a function , shown by the thin dashed line.
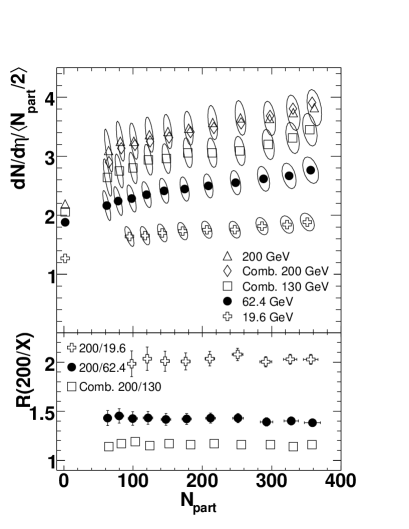
The centrality dependence of , measured with the tracklet technique, is shown in Fig. 4a, and tabulated in Table 1. Data at and GeV have been analyzed using only the tracklet technique in the PHOBOS Vertex detector (hereafter called the “vertex-tracklet” method) and the Octagon-based centrality method. At 130 and 200 GeV, results are also available using a method (the “combined” method) which averages the vertex tracklet results with a similar method using the PHOBOS spectrometer Back:2002uc , and using the paddle-based centrality method. The results are typically compatible within 2% over the full centrality range, as can be seen by direct comparison in Fig. 4a of the vertex tracklet and the combined result for 200 GeV. The vertex-tracklet method and Octagon-based centrality method is used at 62.4 GeV for overall consistency and partial cancellation of certain systematics in the ratios relative to 19.6 and 200 GeV data.
The centrality dependence of the mid-rapidity yields has often been interpreted in a two-component picture of particle production, with “soft” processes scaling with and “hard” processes scaling with the number of binary collisions, . As the beam energy increases, particle production from the hard processes, which exceed the number of participant pairs by a factor of in central events for ranging from 19.6 to 200 GeV, are expected to dominate over that from soft processes as the minijet cross sections increase Gyulassy:1994ew . This expectation may be examined by studying the ratio of the yields at different energies for the same fraction of the total cross section, shown in Fig. 4b. Despite the expected increase in hard processes with increasing energy, these ratios are observed to be constant over the measured centrality range, showing a “factorization” of beam energy and collision geometry at midrapidity. This result extends the analysis presented in Ref. Back:2004dy and is fully compatible with the constant ratio found in comparisons between data at 200 and 130 GeV obtained with the “combined” method. All of these data suggest that while two-component models can fit the midrapidity data at each energy, they do not have an energy dependence characteristic of a growing contribution of hard-processes.
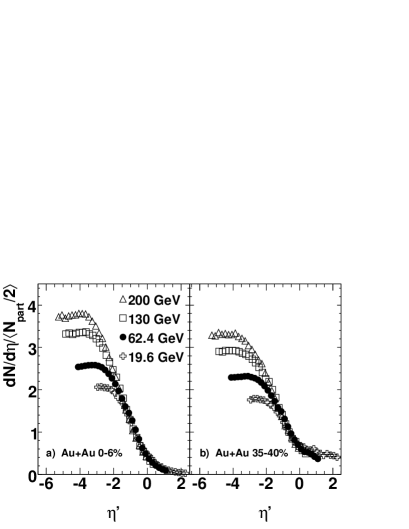
In a previous PHOBOS publication, the phenomenon of “limiting fragmentation” was observed by comparing Au+Au collisions at the three RHIC energies for which data were available Back:2002wb . This phenomenon, which we also refer to as “extended longitudinal scaling” Back:2004mr is simply the invariance of the scaled yields with beam energy in the reference frame of one of the projectiles, i.e. by plotting the scaled yields with respect to the variable , where is the beam rapidity. The concept of extended longitudinal scaling is expected to apply to rapidity distributions, but since for particles emitted far away from mid-rapidity, this scaling is also expected to apply to pseudorapidity distributions. This scaling phenomenon was also found in collisions at RHIC Back:2004mr and, surprisingly, also for elliptic flow at all of the RHIC energies, including GeV Back:2004zg . The new multiplicity data at GeV, shown in Figs. 5a and 5b, clearly fit well into the existing pattern.
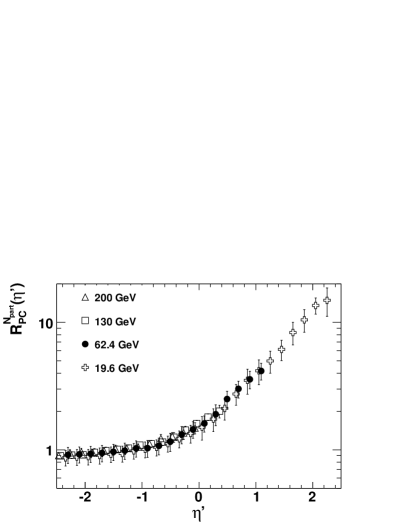
The data in Fig. 5 suggest that the change in the shape of away from mid-rapidity is a stronger function of the collision geometry than of the beam energy, when observed in the rest frame of one of the projectiles. This is shown more clearly in Fig. 6, where the ratio of peripheral to central data scaled by
is plotted as a function of . The error bars in this figure indicate 90% C.L. systematic errors. A similar figure was shown in Ref. Back:2002wb , showing that the change in shape as a function of centrality is independent of beam energy when observed in the rest frame of one of the projectiles. This ratio was also used to compare the shapes of transverse momentum distributions, , measured near mid-rapidity for different energies and centralities, and a similar invariance with energy was found for each centrality bin Back:2004ra , i.e. in all of these cases, the centrality and energy dependences factorize to a large extent. Such behavior has also been seen in proton-nucleus collisions at lower energies Busza:1991ah .
| Centrality | Fig. 4 | Fig. 7 | |||
|---|---|---|---|---|---|
| Bin | |||||
| 0-3% | 35611 | 49236 | 2.760.23 | ||
| 34911 | 2988149 | 17.101.02 | |||
| 3-6% | 32510 | 43332 | 2.670.22 | 2775138 | 17.171.01 |
| 6-10% | 288 9 | 37728 | 2.620.21 | 2489124 | 17.291.01 |
| 10-15% | 248 8 | 31623 | 2.550.21 | 2120106 | 17.131.00 |
| 15-20% | 209 7 | 26019 | 2.500.20 | 177788 | 17.031.02 |
| 20-25% | 174 7 | 21215 | 2.440.21 | 148574 | 17.071.08 |
| 25-30% | 145 7 | 17413 | 2.410.21 | 123661 | 17.031.17 |
| 30-35% | 119 7 | 14010 | 2.350.22 | 102751 | 17.151.30 |
| 35-40% | 98 7 | 111 8 | 2.280.23 | 84042 | 17.171.45 |
| 40-45% | 78 6 | 87 6 | 2.240.25 | 67933 | 17.301.63 |
| 45-50% | 62 6 | 67 5 | 2.160.26 | 53226 | 17.161.80 |

As observed previously, the centrality dependence of the limiting curve has the interesting property that the decrease in the scaled particle density, , at mid-rapidity when moving from central to peripheral events is correlated with the increase at forward rapidities. Although some of the particles with may be attributed to emission from spectators, the systematic change of the slope leads to an approximately constant total multiplicity. Using the method outlined in Ref. Back:2003xk , which combines analytic fits of the measured region with estimates of the unmeasured yields using the lower-energy data, the total charged-particle multiplicity extrapolated to has been calculated as a function of centrality, as shown in Fig. 7 and tabulated in Table 1. The uncertainty from the extrapolation procedure itself is indicated by the grey bands. As at the other RHIC energies Back:2003xk , the data at GeV shows an approximately linear relationship between and . This persistence of “wounded nucleon scaling” elias ; wounded has not been fully explained for heavy ion collisions, especially since the multiplicity is evidently not a simple multiplication of nucleon-nucleon multiplicity by .
It is an interesting question whether or not the various scaling behaviors discussed, such as the factorization of energy and geometry at midrapidity (Fig. 4) and the similar factorization of the distributions in (Fig. 6), should be considered independent phenomena. Already, the scaling shown in Fig. 7 suggests that modifications to particle production at forward rapidities are strongly correlated with compensating changes at mid-rapidity. If, in fact, the pseudorapidity distribution at each energy deviates from the limiting curve at around by flattening out, and this deviation is centrality independent (a statement which is broadly consistent with the available data, except perhaps at the lowest RHIC energy), then the factorization of energy and geometry at mid-rapidity follows naturally as a consequence of the centrality dependence of the energy-independent limiting curve. The same condition also relates the approximately logarithmic energy dependence (Fig. 3) to the shape of the limiting curve in central events. Of course, empirical observations like this do not explain why these relationships between the various regions of phase space hold, but rather point to issues that need to be addressed in the global understanding of heavy ion collisions.
In summary, the charged-particle pseudorapidity density has been measured by PHOBOS for Au+Au collisions at = 62.4 GeV, matching the top ISR energy. As a function of collision energy, the pseudorapidity distribution grows systematically both in height and width. The mid-rapidity density is found to grow approximately logarithmically between AGS energies and the top RHIC energy. As a function of centrality, there is an approximate factorization of the centrality dependence of the mid-rapidity yields and the energy-dependent overall multiplicity scale. The phenomenon of “extended longitudinal scaling” (also known as “limiting fragmentation”) is clearly present in the 62.4 GeV data. Finally, a relatively-small extrapolation of the measured yields to 4 allows the extraction of the total charged-particle multiplicity. As at the other RHIC energies, is found to scale approximately linearly with the number of participants over the range of collision centralities studied.
This work was partially supported by U.S. DOE grants DE-AC02-98CH10886, DE-FG02-93ER40802, DE-FC02-94ER40818, DE-FG02-94ER40865, DE-FG02-99ER41099, and W-31-109-ENG-38, by U.S. NSF grants 9603486, 0072204, and 0245011, by Polish KBN grant 1-P03B-062-27(2004-2007), by NSC of Taiwan Contract NSC 89-2112-M-008-024, and by Hungarian OTKA grant (F 049823).
References
- (1) B. B. Back et al., Phys. Rev. Lett. 85, 3100 (2000).
- (2) B. B. Back et al., Phys. Rev. Lett. 88, 022302 (2002).
- (3) B. B. Back et al., Phys. Rev. Lett. 87, 102303 (2001).
- (4) B. B. Back et al., Phys. Rev. C 65, 031901 (2002).
- (5) B. B. Back et al., Phys. Rev. C 65, 061901 (2002).
- (6) B. B. Back et al., Phys. Rev. Lett. 91, 052303 (2003).
- (7) B. B. Back et al., Phys. Rev. C 70, 021902(R) (2004).
- (8) B. B. Back et al., arXiv:nucl-ex/0301017.
- (9) B. B. Back et al., Nucl. Instrum. Meth. A 499, 603 (2003).
- (10) M. Gyulassy and X. N. Wang, Comput. Phys. Commun. 83, 307 (1994).
- (11) B. B. Back et al., Nucl. Phys. A. 757, 28 (2005).
- (12) G. J. Alner et al., Z. Phys. C 33, 1 (1986).
- (13) H. Heiselberg, Phys. Rept. 351, 161 (2001).
- (14) F. Abe et al., Phys. Rev. D 41, 2330 (1990).
- (15) B. B. Back et al., nucl-ex/0409021, submitted to Phys. Rev. C (in press, 2005).
- (16) B. B. Back et al., Phys. Rev. Lett. 94, 122303 (2005).
- (17) B. B. Back et al., Phys. Rev. Lett. 94, 082304 (2005).
- (18) W. Busza, Nucl. Phys. A 544, 49 (1992).
- (19) J. E. Elias et al. Phys. Rev. Lett. 41, 285 (1978).
- (20) A. Białas, B. Bleszyński and W. Czyż, Nucl. Phys. B111, 461 (1976).