Energy dependence of
transverse mass spectra of hyperons
produced in p+p
and p+ interactions.
A compilation.
Abstract
The results on transverse mass spectra of hyperons produced in all inelastic p+p and p+ interactions in the energy range GeV are compiled and analyzed. The energy dependence of the mean transverse mass and the inverse slope parameter of the spectra is presented and discussed. These results should be used as a reference in the study of hyperon production in nuclear collisions.
a Institut für Kernphysik, Universität Frankfurt, Germany
b Świȩtokrzyska Academy, Kielce, Poland
1 Introduction
Recently observed anomalies in the energy dependence of hadron production in central Pb+Pb collisions [1] suggest that the onset of deconfinement may be located at the low CERN SPS energies GeV [2, 3]. In the identification of the effects possibly related to the onset of deconfinement in heavy ion collisions a comparison with the corresponding results obtained in nucleon-nucleon interactions plays a special role. In case of the study of energy dependence of pion and kaon multiplicities this comparison was done based on the existing compilations of the data on all inelastic proton-proton (p+p), proton-neutron and proton-antiproton (p+) interactions [4].
A recently found
[3]
anomaly in the energy
dependence of the shape of transverse
mass () spectra of hadrons
produced in central Pb+Pb collisions raised significant interest
[5-8].
It motivates an effort to compile the corresponding results in p+p() interactions.
The first compilation of the transverse mass spectra of kaons was already published
[9].
In this paper the compilation of the spectra of hyperons is presented and discussed.
The paper is organized as follows.
In section 2 the existing data are reviewed and analyzed.
The energy dependence of the spectra is presented
and discussed
in section 3. The paper is closed by the summary,
section 4.
2 A compilation of p+p() data
We start from review of the data on hyperon transverse momentum () and transverse mass spectra in all inelastic p+p() interactions.
In most cases the original experimental papers present spectra in the form or . From these results the transverse mass (, where is the particle rest mass) spectra can be easily obtained ().
Our compilation and analysis is limited to the low region, GeV/c. First, it is because in this region the spectra of hyperons were measured by many experiments and therefore a systematic study is possible. Second, this is the region where the shape of the spectra in A+A collisions is determined by the hydrodynamical expansion of the matter and thus it is sensitive to the change of the equation of state due to the onset of deconfinement. In this region an exponential parameterization of the p+p() data:
| (1) |
is approximately valid111 At high the spectra obey a power law behavior, , which is interpreted as due to hard (parton) scattering.. In Eq. 1 the inverse slope parameter and the normalization parameter are free parameters and their values are extracted from the least square fits to the experimental spectra.
Most of the compiled spectra are measured either close to mid-rapidity (y) or they are integrated over forward or backward hemispheres.
Transverse momentum spectra of hyperons produced in all inelastic p+p interactions are measured in fixed target [10-23] mostly bubble chamber experiments, at energies below GeV. At higher energies, GeV, the data on the spectra are taken in collider experiments at ISR [24, 25] and RHIC [26] . The measurements for p+ interactions are performed at the SpS and Fermilab colliders [27, 28] at GeV. All results come from the analysis of charged decays of hyperons, .
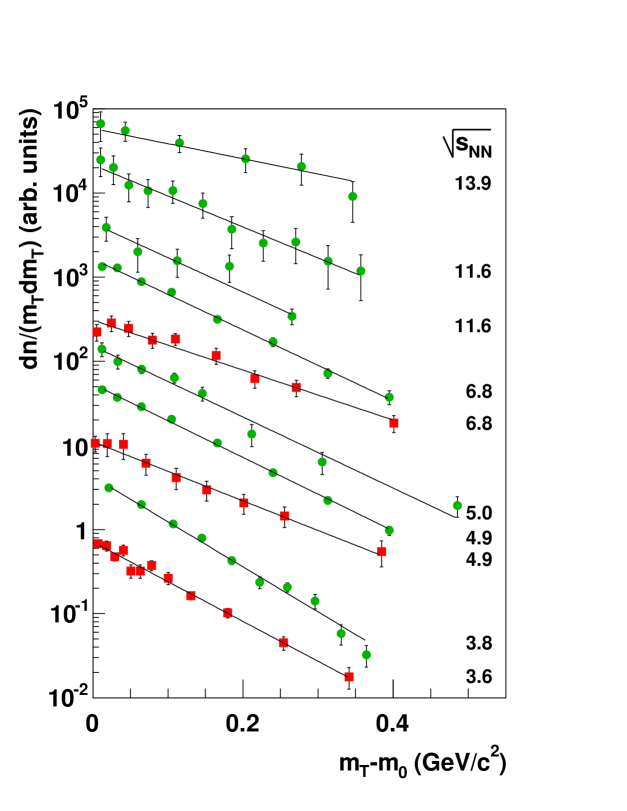
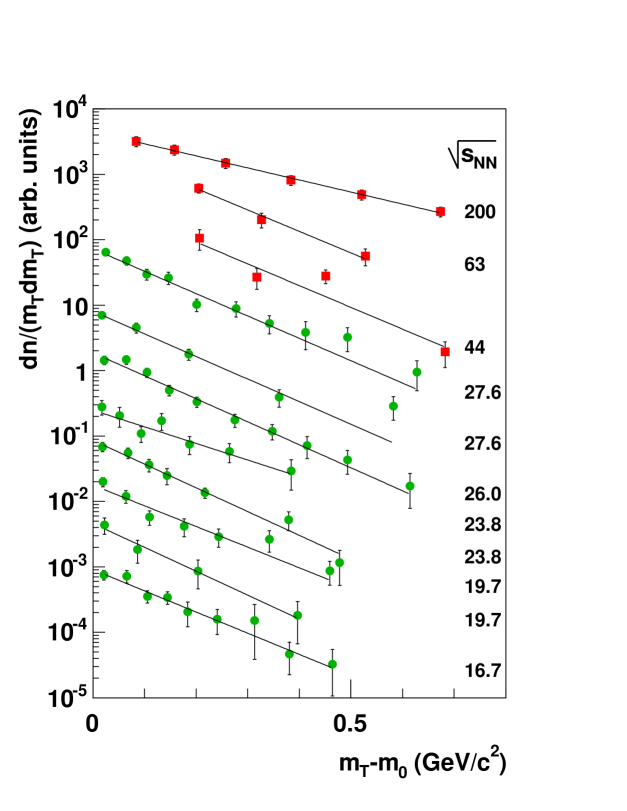
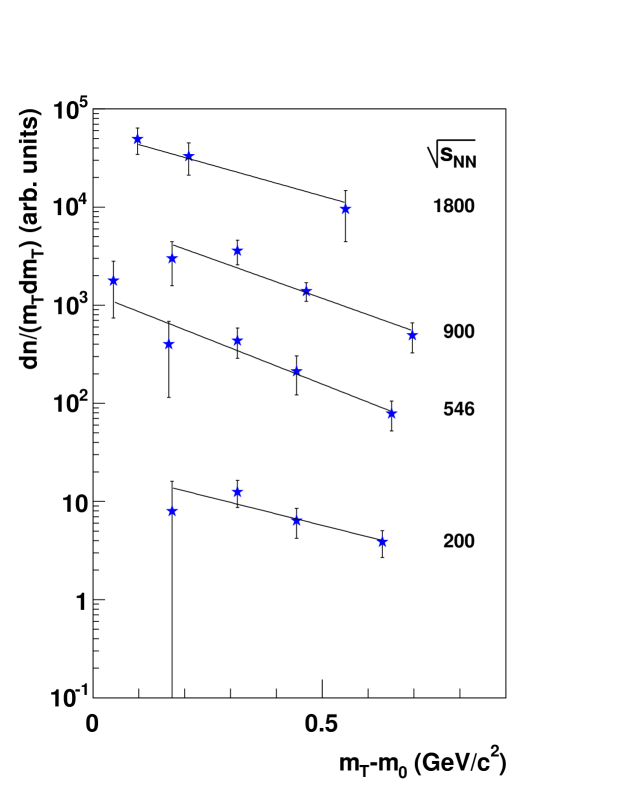
The summary of the data on spectra of hyperons is given in Tables 1 and 2, where , the range selected for the analysis, the longitudinal acceptance in which the measurement was done and the reference to the original experimental papers are given. The spectra are plotted as a function of () in Figs. 1-3. The normalization of the spectra is arbitrary. They are ordered from bottom to top according to increasing energy.
The spectra displayed in Figs. 1-3 are fitted by an exponential function, Eq. 1,
in the whole range (( GeV/c2).
The inverse slope parameter and resulting from the fits are given in Tables 1 and 2.
The corresponding functions are plotted in Figs. 1-3 by solid lines.
It is seen that the used parametrization (Eq. 1),
reasonably well describes spectra in the
studied range at all energies
( GeV), both
for p+p and p+ interactions.
The mean in the range GeV/c2 was calculated using measured data.
If necessary, the results were corrected for the unmeasured tails of the distributions by use of the exponential function.
The resulting values of () are also given in Tables 1 and 2.
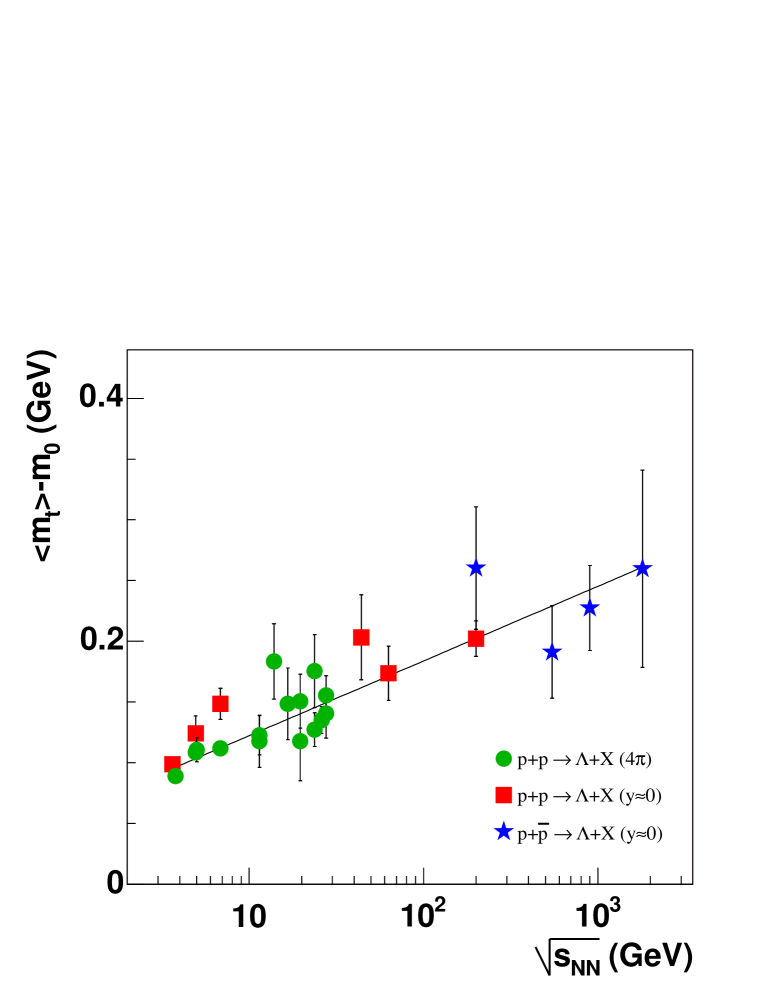
3 The energy dependence
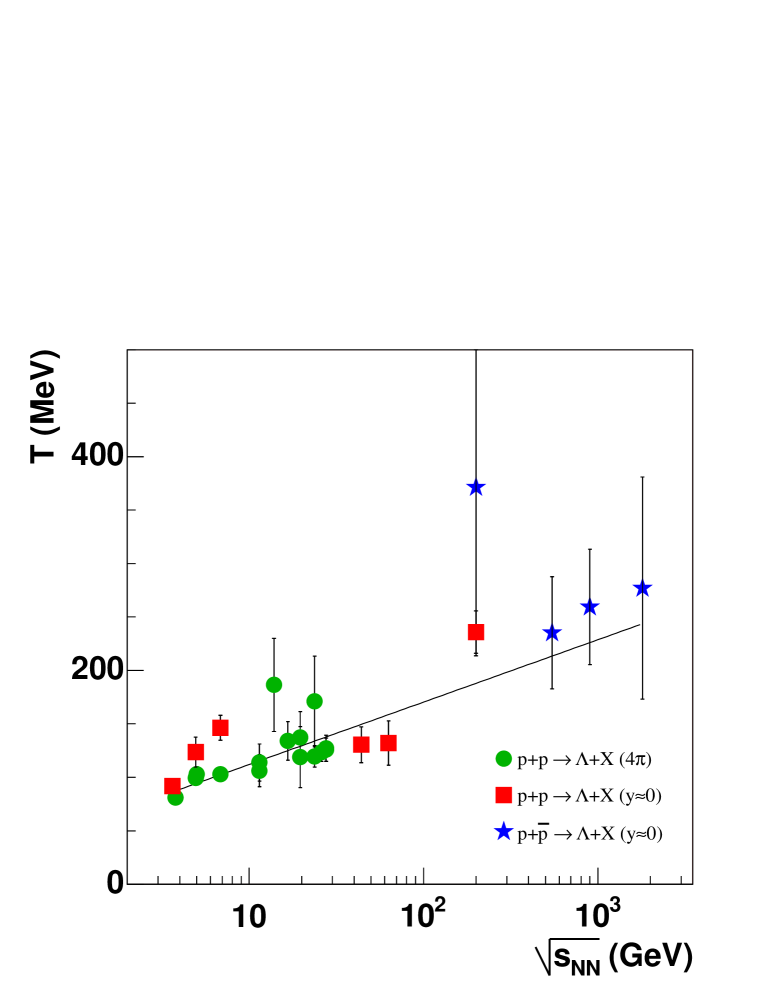
The energy dependence of the and () parameters calculated in the interval ( GeV/c2 to the spectra of hyperons produced in all inelastic p+p() interactions are shown in Figs. 4 and 5. The results were parametrized by an expression:
| (2) |
where or (), and are fit parameters and is given in units of GeV. The best fit to the inverse slope parameter data presented in Fig. 4 yields MeV, MeV and . The parameters fitted to the mean transverse mass data are MeV, MeV and .
In both cases the observed deviations of points from the parameterizations are mostly consistent with ones expected from the experimental errors.
The compiled results indicate that and () increase monotonically with the collision energy from MeV and ( MeV at GeV to MeV and ( MeV at GeV. No significant differences are seen between data for p+p and p+ interactions and between mid-rapidity and integrated data. Note that in general one expects flatter spectra for mid-rapidity results, this trend is suggested by several low energy points.
Data of higher statistical precision are needed to draw firm conclusions on the details of energy dependence of the shape of spectra in p+p() interactions. The measurements of the spectra in nucleus-nucleus collisions are still sparse, but the new results at SPS and RHIC energies are expected soon. The measured values of the parameter in central Pb+Pb (Au+Au) collisions are in the range MeV at GeV [29-34]. They are significantly larger than the corresponding p+p() results.
4 Summary
We compiled and analyzed data on spectra of hyperons produced in all inelastic p+p and p+ interactions. The spectra can be reasonably well described by a simple exponential parametrization in the whole analyzed interval ( 0.7 ). We do not observe any significant difference between data from p+p and p+ interactions and results obtained in different rapidity or acceptances. The and () parameters increase monotonically with from MeV and ( MeV at GeV to MeV and ( MeV at GeV. This dependence can be parametrized as MeV + MeV GeV) and ( MeV + MeV GeV), where is given in units of GeV.
These results should serve as a reference in the study of hyperon production in nuclear collisions.
Acknowledgments
We thank Christoph Blume for discussion and help and our
colleagues at IKF, especially Benjamin Lungwitz and Michael Kliemant.
This work was supported by the Virtual Institute VI-SIM (VI-146) of Helmholtz Gemeinschaft, Germany.
References
- [1] S. V. Afanasiev et al. [The NA49 Collaboration], Phys. Rev. C 66 (2002) 054902 ; M. Gazdzicki et al. [NA49 Collaboration], J. Phys. G 30 (2004) S701.
- [2] M. Gazdzicki and M. I. Gorenstein, Acta Phys. Polon. B 30, 2705 (1999).
- [3] M. I. Gorenstein, M. Gazdzicki and K. A. Bugaev, Phys. Lett. B 567, 175 (2003).
- [4] M. Gazdzicki and D. Roehrich, Z. Phys. C 65, 215 (1995) and Z. Phys. C 71, 55 (1996).
- [5] B. Mohanty, J. e. Alam, S. Sarkar, T. K. Nayak and B. K. Nandi, Phys. Rev. C 68, 021901 (2003).
- [6] E. L. Bratkovskaya, S. Soff, H. Stoecker, M. van Leeuwen and W. Cassing, Phys. Rev. Lett. 92 (2004) 032302.
- [7] M. Gazdzicki, M. I. Gorenstein, F. Grassi, Y. Hama, T. Kodama and O. . J. Socolowski, Braz. J. Phys. 34 (2004) 322.
- [8] F. Grassi, Y. Hama, T. Kodama and O. J. Socolowski, J. Phys. G 30 (2004) 853.
- [9] M. Kliemant, B. Lungwitz and M. Gazdzicki, Phys. Rev. C 69 (2004) 044903.
- [10] R.L. Eisener et al., Phys. Rev. B 123, 361 (1977).
- [11] V. Blobel et al. [Bonn-Hamburg-Munich Collaboration], Nucl. Phys. B 69 (1974) 454.
- [12] V. Blobel, H. Fesefeldt, H. Franz, W. M. Geist, K. Von Holt, U. Idschok and N. Schmitz [BONN-HAMBURG-MUNICH COLLABORATION Collaboration], Nucl. Phys. B 135 (1978) 379.
- [13] H. Blumenfeld et al., Phys. Lett. B 45 (1973) 528.
- [14] K. Jaeger, D. Colley, L. Hyman and J. Rest, Phys. Rev. D 11, 2405 (1975).
- [15] K. Jaeger et al., Phys. Rev. D 11 (1975) 1756.
- [16] V. V. Ammosov et al., Nucl. Phys. B 115 (1976) 269.
- [17] J. W. Chapman et al., Phys. Lett. B 47 (1973) 465.
- [18] D. Brick et al., Nucl. Phys. B 164 (1980) 1.
- [19] F. Lopinto et al., Phys. Rev. D 22 (1980) 573.
- [20] A. Sheng et al., Phys. Rev. D 11 (1975) 1733.
- [21] M. Asai et al. [EHS-RCBC Collaboration], Z. Phys. C 27, 11 (1985).
- [22] H. Kichimi et al., Phys. Lett. B 72 (1978) 411.
- [23] H. Kichimi et al., Phys. Rev. D 20 (1979) 37.
- [24] F. W. Busser et al., Phys. Lett. B 61, 309 (1976).
- [25] D. Drijard et al. [CERN-Dortmund-Heidelberg-Warsaw Collaboration], Z. Phys. C 12, 217 (1982).
- [26] J. Adams and M. Heinz [STAR collaboration], arXiv:nucl-ex/0403020.
- [27] R. E. Ansorge et al. [UA5 Collaboration], Nucl. Phys. B 328 (1989) 36.
- [28] S. Banerjee et al. [E735 Collaboration], Phys. Rev. Lett. 62 (1989) 12.
- [29] S. Ahmad et al., Phys. Lett. B 382 (1996) 35.
- [30] B. A. Cole et al. [E802 Collaboration], Nucl. Phys. A 590 (1995) 179C.
- [31] S. Albergo et al., Phys. Rev. Lett. 88 (2002) 062301.
- [32] A. Richard [NA49 Collaboration], J. Phys. G 31 (2005) S155.
- [33] T. Anticic et al. [NA49 Collaboration], Phys. Rev. Lett. 93 (2004) 022302.
- [34] C. Adler et al. [STAR Collaboration], Phys. Rev. Lett. 89 (2002) 092301.
| pt-range | longitudinal | -m0 | ||||
|---|---|---|---|---|---|---|
| (GeV) | (GeV/c) | acceptance | (MeV) | (MeV) | ref. | |
| 3.63 | 0-0.94 | -0.25 0.25 | 91.8 4.5 | 8.1/10 | 99.1 5.9 | [10] |
| 3.78 | 0-0.97 | 01.5 | 81.1 2.0 | 10.5/8 | 89.3 3.1 | [11] |
| 4.93 | 0-1.00 | =0 | 123.6 14.1 | 0.9/7 | 127.4 14.9 | [12] |
| 4.93 | 0-1.02 | 01.5 | 99.5 2.3 | 2.4/6 | 109.1 3.6 | [11] |
| 5.01 | 0-1.15 | -1.60 | 102.8 7.1 | 6.1/6 | 111.4 10.0 | [14] |
| 6.84 | 0-1.03 | =0 | 146.4 11.6 | 5.1/7 | 155.9 13.4 | [12] |
| 6.84 | 0-1.02 | 01.9 | 103.0 3.6 | 4.2/6 | 112.6 4.7 | [11] |
| 11.56 | 0-0.81 | 02.4 | 106.2 15.0 | 1.8/3 | 118.8 21.7 | [13] |
| 11.56 | 0-0.92 | -2.50 | 114.0 17.3 | 2.1/9 | 124.2 16.4 | [16] |
| 13.90 | 0-0.94 | -2.20 | 186.5 43.6 | 0.6/4 | 205.5 34.7 | [17] |
| 16.66 | 0-1.12 | 00.6 | 134.1 18.0 | 2.5/7 | 152.4 30.4 | [18] |
| 19.66 | 0-1.02 | 03.0 | 118.9 28.7 | 0.5/2 | 118.5 32.8 | [11] |
| 19.66 | 0-1.11 | -3.00 | 137.4 24.1 | 6.8/5 | 115.1 22.8 | [15] |
| 23.76 | 0-1.13 | 03.0 | 119.6 10.1 | 2.1/5 | 129.6 14.2 | [19] |
| 23.76 | 0-1.00 | -3.10 | 171.1 42.5 | 3.6/5 | 185.9 31.8 | [20] |
| 26.03 | 0-1.32 | -3.20 | 123.5 8.7 | 5.5/8 | 137.1 11.1 | [21] |
| 27.60 | 0-1.28 | -3.40 | 125.8 10.9 | 4.1/3 | 141.4 20.3 | [22] |
| 27.60 | 0-1.34 | 03.0 | 127.0 12.2 | 9.0/8 | 157.2 16.5 | [23] |
| 44.00 | 0.71-1.41 | 0 | 130.5 16.8 | 6.4/2 | 206.3 35.5 | [24] |
| 63.00 | 0.71-1.21 | =0 | 132.2 20.7 | 0.6/1 | 176.4 22.6 | [25] |
| 200.00 | 0.44-1.40 | -0.50.5 | 235.9 19.9 | 0.3/4 | 244.6 17.7 | [26] |
| pt-range | longitudinal | -m0 | ||||
|---|---|---|---|---|---|---|
| (GeV) | (GeV/c) | acceptance | (MeV) | (MeV) | ref. | |
| 200 | 0.64-1.34 | 02 | 371.5 157.8 | 1.2/2 | 404.2 78.5 | [27] |
| 546 | 0.32-1.37 | 02 | 235.3 52.5 | 1.6/3 | 229.7 45.7 | [27] |
| 900 | 0.64-1.43 | 02 | 259.5 53.9 | 2.2/2 | 271.9 41.8 | [27] |
| 1800 | 0.47-1.24 | -0.361.0 | 277.0 103.8 | 0.0/1 | 345.8 108.0 | [28] |