NA49 ENERGY SCAN RESULTS FOR CENTRAL LEAD-LEAD COLLISIONS AT THE CERN SPS
The energy dependence of hadron production in central Pb-Pb collisions at SPS energies is presented and compared with data at lower and higher energies and with results from p-p interactions. It is observed that there is little change in transverse activity in the SPS energy range, that there is a steepening rate of increase of pion production and that the ratio exhibits a sharp peak located at about 30 . The ratio also shows a pronounced maximum which is weaker in and absent in .
1 Introduction
The NA49 collaboration has recently completed the energy scan program at the SPS providing data on (central) Pb-Pb collisions at 20, 30, 40, 80 and 158 beam energy. The aim of this program is to search for the onset of a phase transition to the Quark Gluon Plasma. That such a transition may indeed occur at the SPS follows from the energy density estimate of about 3 GeV/fm3 which is well above the critical density of about 1 GeV/fm3 calculated in Lattice QCD. Assuming that a phase transition takes place at about 30 the Statistical Model of the Early stage (SMES) predicts anomalies in the energy dependence of particle production at the SPS. In this paper we present a selection of results from the energy scan; we refer to and references therein for a more complete overview of recent NA49 results.
2 Experiment
The NA49 detector is a large acceptance fixed-target hadron spectrometer. Tracking is performed by four large-volume TPC’s. Two of these are placed one behind the other inside two super-conducting dipole magnets (vertex TPC’s). The two other (main) TPC’s are placed downstream of the magnets left and right of the beam line. These main TPC’s are optimized for particle identification through a measurement of the specific energy loss () with a relative resolution of about 4%. The combined TPC’s provide an accurate measurement of the particle momenta with a resolution in the range of (GeV/)-1. A measurement of the time-of-flight with a resolution of about 60 ps provides particle identification at mid-rapidity. Centrality selection is based on a measurement of the energy deposited by the projectile spectator nucleons in a forward calorimeter.
In the years 1996 and 2000 two samples (0.8M and 3M events) of central Pb-Pb collisions were collected at 158 beam energy with a centrality selection of, respectively, 10% and 20% of the inelastic cross-section. In addition, Pb-Pb data (all with 7% centrality selection) were taken in the years 1999–2002 at beam energies of 80 (0.3M events), 40 (0.7M), 30 (0.4M) and 20 (0.3M). Results of the 158, 80 and 40 runs are published in while those of 30 and 20 are still preliminary.
3 Transverse mass spectra
In the left-hand plots of Fig. 1
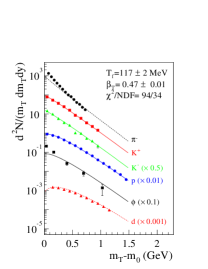
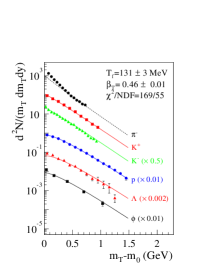
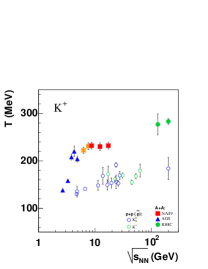
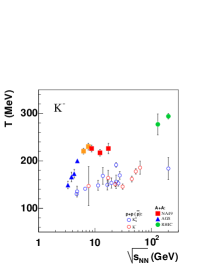
are shown the transverse mass () spectra of hadrons measured at 20 and 30 . The spectra are reasonably well described by a blast-wave parameterization with a freeze-out temperature 120 MeV and a transverse flow velocity . Similar values were found from the spectra at higher energies indicating that there is little change in transverse activity in the SPS energy range. A similar conclusion can be drawn from the right-hand plots of Fig. 1 where we show the inverse slope parameters obtained from exponential fits to the and transverse mass spectra measured at AGS, SPS and RHIC. It is seen from this figure that for both and the inverse slope parameter increases strongly with energy at the AGS, remains approximately constant at the SPS and shows a tendency to increase further above SPS energies. Such an energy dependence is in qualitative agreement with a softening of the equation of state due to a phase transition at the SPS. The stationary value of the apparent temperature would then indicate that the early stage temperature and pressure remain constant due to the coexistence of partonic and hadronic phases. The p-p() data (open circles in Fig. 1) show an increasing trend but are not accurate enough to reveal any structure.
4 Energy dependence of particle yields
The rapidity distributions of , and measured at all energies are shown in the left-hand plot of Fig. 2.
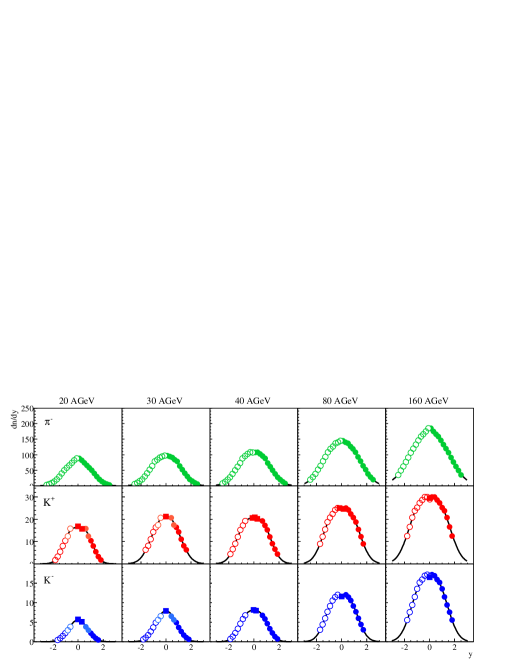
Because the pion momenta are too low for identification their yields were determined from the negative hadron spectra corrected for contributions from kaon and weak decays. To determine the total yields the spectra were extrapolated using the fitted double Gaussians shown by the curves in the figure.
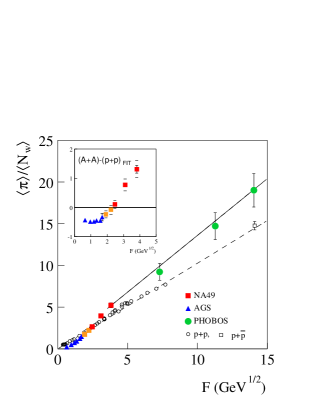
The energy dependence of the total pion yield (taken to be 1.5 times the measured charged pion yield) per wounded nucleon () is shown in the right-hand plot of Fig. 2 for A-A and p-p() collisions. It is seen that in both colliding systems increases with energy but that for A-A collisions the rate of increase becomes larger at the SPS. In the SMES this steepening is explained by an increase of the effective number of internal degree’s of freedom due to the onset of de-confinement (assumed, in the model, to occur at about 30 ).
The ratio’s , and (here denotes the average of the and yields) are shown in Fig. 3 as a function of collision energy. The ratio increases monotonically with energy while the ratio shows a pronounced peak at about 30 ; this characteristic energy dependence seems to be a unique feature of A-A collisions because it is absent in elementary p-p collisions (open circles in Fig. 3). There appears to be little energy dependence of the ratio between SPS and RHIC. The peak in the energy dependence of is qualitatively understood as a threshold effect at AGS energies followed by a suppression at larger energies because the baryo-chemical potential decreases with energy. The behavior of is reflected in by associated production.
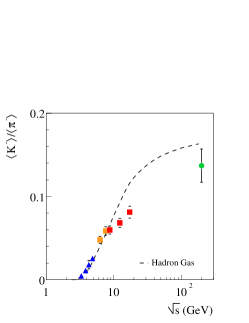
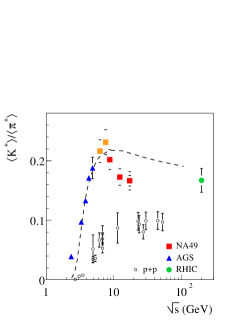
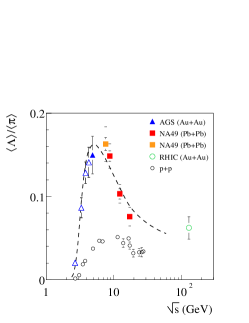
The curves in Fig. 3 show the prediction from a statistical hadron gas model. In such models it is assumed that hadron species are populated according to the available phase space. Particle ratio’s are then described by two parameters only: a chemical freeze-out temperature and a baryo-chemical potential . The model incorporates an energy dependence by smooth interpolation of and obtained from fits to data at different energies. It is seen from Fig. 3 that the model gives a fair description of , captures the trend of but fails to describe the sharp peak in . Microscopic string models like UrQMD and HSD also fail to give a satisfactory description of the data (not shown); for detailed comparisons we refer to a recent study by the authors of these models.
Hyperon yields (, and ), normalized to , are shown as a function of energy in the left-hand plot of Fig. 4.
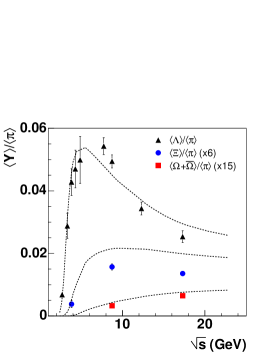
The maximum in (see also Fig. 3) is less pronounced in the ratio and seems to be absent in . The curves in this plot correspond to the hadron-gas model of which gives a fair description of the data.
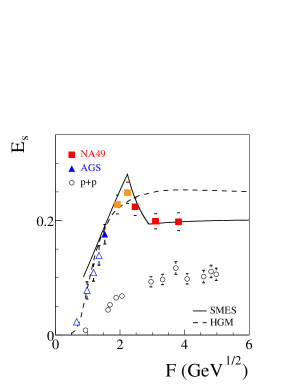
The ratio versus the Fermi energy measure is shown in the right-hand plot of Fig. 4. The full curve shows the prediction from the SMES model which agrees well with the data. In the SMES is a measure of the strangeness to entropy ratio and its energy behavior is a direct consequence of the onset of de-confinement taking place at about 30 .
5 Summary and outlook
The data presented here show that rapid changes of hadron production properties occur in the SPS energy range. These results can be understood by assuming that a de-confinement transition takes place at these energies but it is not clear, at present, if they cannot also be explained in a purely hadronic scenario. To make progress it is of interest to measure the energy dependence of particle yields in collisions of lighter nuclei as well as in elementary p-p and p-A interactions. Such data would significantly constrain the models of particle production in heavy-ion collisions.
References
References
- [1] NA49 Collab., S. Margetis et al, Phys. Rev. Lett. 75, 3814 (1995).
- [2] K. Rajagopal, Nucl. Phys. A661, 150 (1999).
- [3] M. Gaździcki and M.I. Gorenstein, Acta Phys. Polon. B30, 2705 (1999).
- [4] NA49 Collab., presented by M. Gaździcki at QM2004, Oakland, CA (nucl-ex/0403023).
- [5] NA49 Collab., S. Afanasiev et al, Nucl. Instrum. Methods A430, 210 (1999).
- [6] NA49 Collab., S. Afanasiev et al, Phys. Rev. C66, 054902 (2002).
- [7] E. Schnedermann and U.W. Heinz, Phys. Rev. C50, 1675 (1994).
- [8] NA49 Collab., M. van Leeuwen et al, Nucl. Phys. A715, 161c (2003).
- [9] L. van Hove, Phys. Lett. B118, 138 (1982).
- [10] M.I. Gorenstein, M. Gaździcki and K.A. Bugaev, Phys. Lett. B567, 175 (2003).
- [11] J. Cleymans and K. Redlich, Phys. Rev. C60, 054908 (1999).
- [12] E.L. Bratkovskaya et al, Phys. Rev. C69, 054907 (2004).
- [13] P. Braun-Munziger et al, Nucl. Phys. A697, 902 (2002).