STAR Collaboration
Measurements of transverse energy distributions in Au+Au collisions at GeV
Abstract
Transverse energy () distributions have been measured for Au+Au collisions at GeV by the STAR collaboration at RHIC. is constructed from its hadronic and electromagnetic components, which have been measured separately. production for the most central collisions is well described by several theoretical models whose common feature is large energy density achieved early in the fireball evolution. The magnitude and centrality dependence of per charged particle agrees well with measurements at lower collision energy, indicating that the growth in for larger collision energy results from the growth in particle production. The electromagnetic fraction of the total is consistent with a final state dominated by mesons and independent of centrality.
pacs:
25.75.DwI Introduction
High energy nuclear collisions at the Relativistic Heavy Ion Collider (RHIC) refRHIC have opened a new domain in the exploration of strongly interacting matter at very high energy density. High temperatures and densities may be generated in the most central (head-on) nuclear collisions, perhaps creating the conditions in which a phase of deconfined quarks and gluons exists refBlaizot ; refJacbWang . The fireball produced in such collisions undergoes a complex dynamical evolution, and understanding of the conditions at the hot, dense early phase of the collision requires understanding of the full reaction dynamics.
Transverse energy is generated by the initial scattering of the partonic constituents of the incoming nuclei and possibly also by reinteractions among the produced partons and hadrons refJacob ; refWang . If the fireball of produced quanta breaks apart quickly without significant reinteraction, the observed transverse energy per unit rapidity will be the same as that generated by the initial scatterings. At the other extreme, if the system reinteracts strongly, achieving local equilibrium early and maintaining it throughout the expansion, will decrease significantly during the fireball evolution due to the longitudinal work performed by the hydrodynamic pressure refMatsui ; refEskola . This decrease will however be moderated by the buildup of transverse hydrodynamic flow, which increases refKolb . Finally, gluon saturation in the wave function of the colliding heavy nuclei can delay the onset of hydrodynamic flow, reducing the effective pressure and thereby also reducing the difference between initially generated and observed refDumitru .
production in nuclear collisions has been studied at lower at the AGS and CERN refYoung ; refWA80 ; refBarrete2 ; refNA49 ; refWA98 and at RHIC refPHENIX . Within the framework of boost-invariant hydrodynamics refBjorken , these measurements suggest that energy densities have been achieved at the SPS refNA49 that exceed the deconfinement energy density predicted by Lattice QCD refKarsch . However, from the foregoing discussion it is seen that several competing dynamical effects can contribute to the observed . While the measurement of alone cannot disentangle these effects, a systematic study of together with other global event properties, in particular charged multiplicity and mean transverse momentum , may impose significant constraints on the collision dynamics refKolb .
In this paper we report the measurement of distributions from Au+Au collisions at GeV per nucleon-nucleon pair, measured by the STAR detector at RHIC. is measured using a patch of the STAR Electromagentic Calorimeter, with acceptance and , together with the STAR Time Projection Chamber. is separated into its hadronic and electromagnetic components, with the latter dominated by and decays. The centrality dependence of and per charged particle are studied, and comparisons are made to models and to measurements at lower energy.
A high temperature deconfined phase could be a significant source of low to intermediate photons refThermalPhotons . An excess of photons above those expected from hadronic decays has been observed at the SPS for GeV/c refWA98eta . We investigate this effect through the study of the electromagnetic component of .
Section II describes the experimental setup used for the analysis. Section III presents the analysis of the hadronic component of the transverse energy. In section IV, the analysis of the electromagnetic transverse energy is presented. In section V we discuss the scaling of with the energy of the colliding system and the number of participants and binary collisions refNpartNbin , together with theoretical expectations for this scaling. We also discuss the behavior of the electromagnetic component of the transverse energy with the collision energy and centrality. Section VI is a summary and discussion of the main results.
II STAR experiment
This analysis is based on 150K minimum bias Au+Au collisions measured by the STAR detector in the 2001 RHIC run. STAR refSTAR is a large acceptance, multi purpose experiment comprising several detector systems inside a large solenoidal magnet. In the following, we describe the detectors which are relevant to the present analysis.
The barrel Electromagnetic Calorimeter (EMC) refEMC is a lead-scintillator sampling electromagnetic calorimeter with equal volumes of lead and scintillator. It has a radius of 2.3 m and is situated just inside the coils of the STAR solenoidal magnet. The electromagnetic energy resolution of the detector is . The results presented in this work used the first EMC patch installed for the 2001 RHIC run consisting of 12 modules, % of the full planned detector, with coverage and . Each EMC module is composed of 40 towers (20 towers in by 2 towers in ) constructed to project to the center of the STAR detector. The transverse dimensions of a tower are approximately 10 x 10 cm2, which at the radius of the front face of the detector correspond to a phase space interval of ()=(0.05, 0.05). The tower depth is 21 radiation lengths (), corresponding to approximately one hadronic interaction length. When fully installed, the complete barrel will consist of 120 modules with pseudorapidity coverage and full azimuthal coverage.
The Time Projection Chamber (TPC) refTPC has a pseudorapidity coverage of for collisions in the center of STAR, with full azimuthal coverage. In this work, the acceptance of the measurement was limited by the acceptance of the EMC. For charged tracks in the acceptance, the TPC provides up to 45 independent spatial and specific ionization measurements. The measurement in combination with the momentum measurement determines the particle mass within limited kinematic regions.
The magnetic field was 0.5 Tesla. TPC track quality cuts included -coordinate (longitudinal axis) selection of the collision vertex within 20 cm of the TPC center and a minimum TPC track space point cut of 10. Typical TPC momentum resolution for the data in this work is characterized by (GeV/) refTPC in which is the track curvature, proportional to . Typical resolution of measurement is %. Additional discussion of TPC analysis is given in the following sections and a more detailed description of the TPC itself can be found in Ref. refTPC .
The event trigger consisted of the coincidence of signals from the two Zero Degree Calorimeters (ZDC) refZDC , located at mrad about the beam downstream of the first accelerator dipole magnet and sensitive to spectator neutrons. These calorimeters provide a minimum bias trigger which, after collision vertex reconstruction, corresponds to of the geometric cross section . The events were analysed in centrality bins based on the charged particle multiplicity in .
The procedures used in the analysis provide independent measurement of electromagnetic transverse energy and the transverse energy carried by charged hadrons. This latter quantity, corrected to take into account the contribution of the long-lived neutral hadrons, is designated the hadronic transverse energy. The hadronic component of the transverse energy is obtained from momentum analyzed tracks in the TPC while the electromagnetic fraction is derived from the Electromagnetic Calorimeter data corrected for hadronic contamination using TPC tracking. In the following sections we describe how each of these contributions were analyzed to obtain the total transverse energy measurement.
III Hadronic Transverse Energy ()
The hadronic transverse energy is defined as
| (1) |
where the sum runs over all hadrons produced in the collision, except and . is the polar angle relative to the beam axis and the collision vertex position. is defined for nucleons as kinetic energy, for antinucleons as kinetic energy plus twice the rest mass, and for all other particles as the total energy. is measured using charged particle tracks in the TPC via:
| (2) |
The sum includes all tracks from the primary vertex in the ranges and . is a correction factor defined as:
| (3) |
that includes the effective acceptance , the correction , for long lived neutral hadrons not measured by the TPC, and , for the TPC low momentum cutoff. is the energy associated with the particular track, either total or kinetic, as described above, computed from the measured momentum and particle identity (ID) as described below. The factor is defined as:
| (4) |
which includes the corrections for the uncertainty in the particle ID determination, , momentum dependent tracking efficiency, , and momentum dependent backgrounds, . Next, we describe the corrections included in these two factors.
Particle identification was carried out using the measurements of momentum and truncated mean specific ionization in the TPC. For GeV/, assignment was made to the most probable particle type relative to the Bethe-Bloch expectation. Particles were assumed to be pions if differed from this expectation by more than three standard deviations, or if GeV/. The uncertainty in this procedure was gauged by calculating for GeV/ both with the correct particle assignments and with all particles assumed to be pions. The ratio of these values for is applied as a correction for particles that can not be identified, yielding an overall correction factor to of . Because this correction was calculated from low momentum particles it does not account for the centrality variations in the particle ratios with GeV/c refParticlePhenix . On the other hand, particles at GeV/c account for about 20% of the total number of particles. Taking into account the centrality-dependence increases in the p/ and K/ ratios at higher generates a change in the estimated hadronic on the order of 2%, which is within the systematic error of .
Only tracks with a transverse momentum GeV/ were accepted because the tracking efficiency drops rapidly below this value. GEANT refGEANT detector simulations of HIJING refHIJING events demonstrate that this cut excludes 5% of the total . A correction for this effect is included in . Taking all simulated tracks for GeV/ and calculating the energy assuming pions in two extreme cases, one with momentum and other with GeV/ resulted in a variation of 3% in , which was assigned as the systematic uncertainty due to this correction.
Since only primary charged tracks measured by the TPC are used in this analysis, we need to correct to include the contribution from long-lived neutral hadrons, principally (), , and (). The correction factor applied to the data, defined as , can be estimated using measurements by STAR at 130 GeV refSTARpBar ; refSTARpBarpErr ; refSTARNegChHad ; refSTARKaon ; refSTARLambda . We assume, based on HIJING simulations, that does not change significantly from 130 GeV to 200 GeV. We assume that the spectrum shape and yield for are the same as for . The same approximation was applied in the case of (), after subtraction of the contribution from decays from the measured yield, and the measured STAR ratio refSTARpBar . Using this procedure we obtained a value of . The uncertainty on this correction was estimated from the uncertainties in the measured STAR spectra. A cross check of these correction factors utilizing 200 GeV measurements refSTAR200GeV generates variations well within the assigned systematic uncertainties.
The correction for background, consisting of electrons, weak-decays and secondary tracks that are misidentified as primary, depends on the type of the track and is divided into two separate corrections. The first is for the electrons which are misidentified as hadrons. This correction was estimated using the shape of the electron spectrum obtained from HIJING and GEANT simulations and the absolute yield from STAR data in the region where electrons are identified with high purity using the TPC measurements (essentially below 300 MeV). The second term is due to weak decays, which have been included in and therefore must be excluded from the primary track population to avoid double counting of their energy. In this case, the correction factor was calculated by embedding simulated particles into real events. By comparison between the simulated particles and the reconstructed ones, the fraction of secondary tracks assigned as primary was evaluated. and were simulated using the experimental yield and spectral shape measured by STAR refSTARLambda ; refSTARKaon .
The TPC reconstruction efficiency, , was also determined by embedding simulated tracks into real events and comparing the simulated input and the final reconstructed event. In order to evaluate the effect of different particle species in the reconstruction efficiency, pions, kaons and protons were embedded in the real events. In this work, the charged track efficiency correction is the average, weighted by the relative populations of each of these species. The track reconstruction efficiency depends on the transverse momentum of the tracks and the total track density. For central events the efficiency is about 0.7 for tracks with GeV/ and reaches a plateau at about 0.8 for GeV/. This efficiency correction includes the efficiency for track reconstruction, the probability for track splitting, ghost tracks and dead regions of the TPC.
The resulting systematic uncertainties, taking into account all corrections, combine in quadrature to a systematic uncertainty estimate of 6.1% on . In Table 1 we summarize all individual corrections and the corresponding systematic uncertainties.
| Description | Correction |
|---|---|
| 0.95 0.03 | |
| 0.81 0.02 | |
| 0.96 0.02 | |
| 0.84 0.02 (0.25 GeV/) | |
| 0.94 0.02 (1.0 GeV/) | |
| 0.70 0.04 (0.25 GeV/) | |
| 0.80 0.04 (1.0 GeV/) |
HIJING and GEANT simulations of measured in the acceptance of this study generate event-wise fluctuations of about 10%. Simulations utilizing a substantially larger acceptance (, ) generate event-wise fluctuations of about 4%, with this latter resolution resulting mainly from tracking efficiency and neutral hadron corrections.
The final distribution is corrected for vertex reconstruction efficiency. Peripheral events have lower vertex reconstruction efficiency which suppresses the the transverse energy distributions with respect to more central events. The vertex reconstruction efficiency depends on the number of tracks measured in the TPC and varies from 70% to 97%.
IV Electromagnetic Transverse Energy ()
The electromagnetic transverse energy is the sum of the measured transverse energy of electrons, positrons and photons. The largest fraction of this energy comes from decays. Electrons (and positrons) are included because more than 90% of them are produced in the conversion of photons in detector materials. The energy of photons and electrons is fully measured by the calorimeter. There is also a contribution from charged and neutral hadrons produced in the collision that is significant and must be subtracted to permit a measurement of . In order to remove the hadronic contribution from the measurement, we studied the full spatial profiles of energy deposition by identified hadrons in the EMC. An extensive experimental library of hadronic shower clusters in the calorimeter has been obtained which, in conjunction with TPC tracking, allow a correction for the hadronic background in the calorimeter.
Section IV.A discusses the calibration of the EMC using minimum ionizing particles and electrons, while section IV.B discusses the correction for hadronic energy deposition in the EMC and section IV.C discusses the determination of .
IV.1 Calibration of EMC
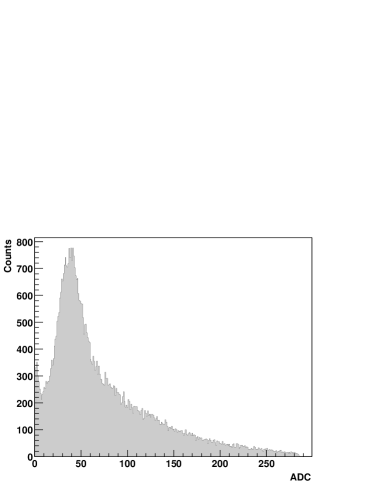
Hadrons striking the EMC deposit a widely fluctuating fraction of their incident energy through hadronic showers. In addition, % of all high energy charged hadrons penetrate the entire depth of the EMC without hadronic interaction. If such a non-showering primary charged hadron has sufficient momentum, it will behave like a minimum ionizing particle (MIP) as it transits each of the scintillator layers, resulting in uniform total energy deposition which will be nearly independent of the incident momentum but will vary linearly with the total thickness of scintillator traversed. Due to the projective nature of the detector the total length of the scintillator increases with increasing . The MIP peak therefore varies from 250 MeV at small to 350 MeV at large . The absolute energy of the MIP peak and its dependence was determined from cosmic rays and test beam measurements refEMCcalib .
The use of MIP particles to calibrate the EMC in situ is convenient and provides a precision tool to track the calibration of the detector over time. In a procedure to minimize systematic uncertainties in the calibration, tracks with GeV/ in the TPC from relatively low multiplicity events are extrapolated to the EMC towers where they are required to be isolated from neighboring charged tracks in a 3x3 tower patch ( x x 0.15) which has a minimum size of 30 cm x 30 cm (). Fig. 1 shows a typical MIP spectrum measured under these conditions using minimum bias Au+Au events. This example shows the pseudorapidity interval . Similar spectra are observed in all bins and provide an absolute calibration in the energy range less than GeV, with an estimated systematic uncertainty of % refEMCcalib .
An absolute calibration over a much wider energy range is obtained using identified electrons tracked with the TPC. This was done by selecting high momentum ( GeV/) electrons reconstructed in the TPC. Electron candidates are selected by measurement in the TPC. Although the purity of the electron candidates sample in this momentum range is poorer than for low momentum, the hadronic rejection factor obtained from the TPC provides a clear electron signal in the calorimeter. Bethe-Bloch predictions for of electrons and heavy particles show that the main background in this momentum range comes from deuterons and heavier particles as well as the tails of the distributions of protons and lower mass particles. In order to minimize systematic uncertainties in this procedure, only tracks having number of space points greater than 25 were used, as such “long tracks” exhibit better resolution. It was also required that the track should be isolated in a 3x3 tower patch in the calorimeter.
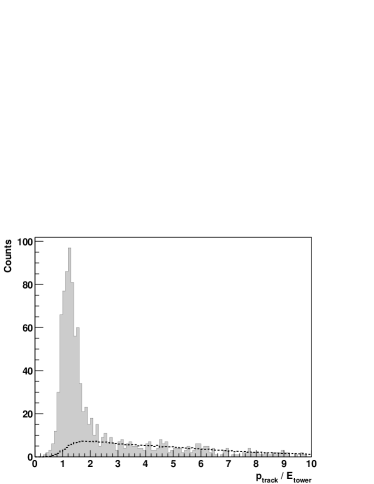
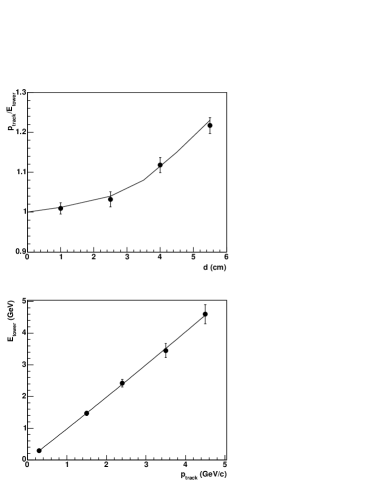
As the final electron identifier, the energy, , deposited in the tower hit by the track is compared to the momentum, , of the track in the range GeV/. Fig. 2 shows the spectrum for the electron candidates in which it is possible to see a well defined electron peak. The residual hadronic background in this figure can be evaluated by shifting the selection window toward the pion region. The resulting estimate of the hadronic background is shown as a dashed line in the figure. After hadronic background subtraction, the peak position is still not centered at 1 due to the energy leakage to neighboring towers that is not taken into account in this procedure. The amount of leakage depends on the distance to the center of the tower hit by the electron and will shift the peak position to higher values as this distance increases. As shown in Fig. 3, this effect is reproduced well by the full GEANT simulations of the detector response when it is hit by electrons in the momentum range used in this calibration procedure. The upper plot of Fig. 3 shows the position of the electron peak as a function of this distance. The solid line is a prediction from GEANT simulations. The measurements are in good agreement with the simulations. Fig. 3 lower plot shows the energy deposited in the calorimeter tower as a function of its momentum for electrons in the case where the distance to the center of the tower is smaller than 2.0 cm (A distance of 5 cm corresponds to the border of a tower at . The border of the tower at is located 7.5 cm from its center). The first point is the electron equivalent energy of the minimum ionizing particles. A fit to the data using the second order polynomial of type is represented by the solid line. The coefficients are GeV, and (GeV/)-1. The values of and are consistent with zero within errors. The small magnitude of these errors indicates that the detector response to electrons is very linear up to GeV/.
By combining the MIP calibration and the electron calibration of the EMC we obtain an overall estimated systematic uncertainty of less than 2% on the total energy measured by the calorimeter. The stability of the detector response was evaluated by monitoring the time dependence of the shape of the raw ADC spectra for each tower, which is the tower response for all particles that reach the calorimeter. In order to have enough statistics, each time interval is larger than one day of data taking but smaller than 2 days, depending on the beam intensity during that period. The overall gain variation of the detector was less than 5% for the entire RHIC run. The results reported in this paper were obtained from 3 consecutive days of data taking, in order to minimize any uncorrected effect due to gain variations in the detector.
IV.2 Energy Deposited by Hadrons in the EMC
As discussed above, for the purposes of measuring electromagnetic energy production it is essential to subtract the hadronic energy deposition in the calorimeter. For charged hadrons, the hit locations on the calorimeter are well determined and if isolated, a cluster of energy is readily identified. In the dense environment of Au+Au collisions, however, it is difficult to uniquely identify the energy deposition associated with a specific hadron track. In this limit, which is relevant for the present measurement, we subtract an average energy deposition based on the measured momentum of the impinging track. Because we are interested in the cumulative distribution averaged over many events and because each event contains many tracks, this averaged correction results in a negligible contribution to the uncertainty in the measured electromagnetic energy.
We have studied hadron shower spatial and energy distributions in the calorimeter both experimentally, using well tracked and identified hadrons in sparse events in STAR, and in detailed GEANT simulations.
A library of separate profiles for pions, kaons, protons and antiprotons was obtained from GEANT simulations of detector response in the STAR environment (GSTAR). The input events had a uniform momentum distribution in the range GeV/ and an emission vertex limited by cm. The constraint on the longitudinal coordinate of the vertex insures that the trajectory of particles will extrapolate through only one tower of the EMC. Because the EMC is a projective detector, this constraint on the extrapolated track is strongly related to the vertex constraint. We projected the simulated tracks on the EMC using a helix model for the particle trajectory in a magnetic field and obtained the energy distributions and the corresponding mean values as a function of the momentum, the pseudorapidity of the EMC towers and the distance of the incident hit point to the center of the tower (). The distributions were binned in intervals of . For all particles, the total mean deposited hadronic energy in a particular tower increases approximately linearly with the momentum, shows very little dependence on pseudorapidity and decreases with increasing distance from the hit point to the center of the tower. Experimental hadronic shower profiles were obtained from Au+Au minimum bias data by projecting tracks on the EMC, accepting only those that were isolated in a 5x5 tower patch to ensure that the energy in the towers was from only one particle, and calculating the energy distributions and mean values. Profiles for all particles, except electrons and positrons, for both positive and negative tracks were recorded with good statistics up to momentum GeV/.
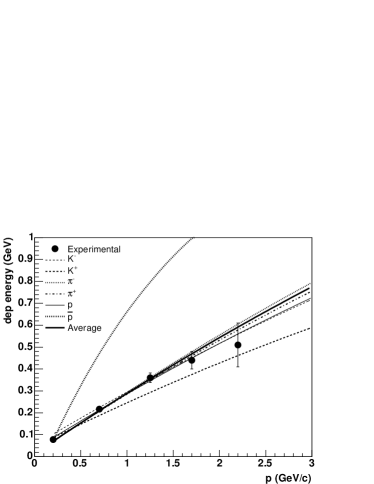
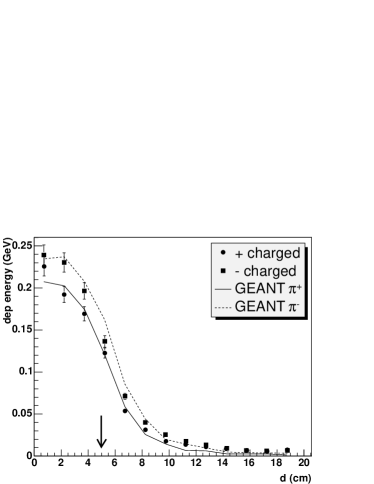
In Fig. 4 we present the deposited energy for different particles from GEANT simulations as a function of momentum, for a fixed pseudorapidity and distance to the center of the tower. An average curve, based on the relative yield of the different particles is also presented. Small differences are observed for most particles, except for the antiproton for which the additional annihilation energy is apparent. The solid points are deposited energy obtained from experimental data for charged hadrons. The experimental profiles for charged hadrons agree quite well with the averaged profile. Because of the limited statistics, it was not possible to obtain the experimental profiles for identified hadrons. In Fig. 5 we present the simulated profiles for and and the experimental profiles for all positively and negatively charged tracks in the momentum range GeV/, as a function of the distance to the center of a tower. The experimental profiles are well described by the simulation, except for a normalization factor on the order of 20% for GeV/ and 5% for GeV/ , as seen in Fig. 5. After renormalization all experimental profiles up to momentum GeV/ are in good agreement with simulation and we therefore use the renormalized simulated profiles to allow smooth interpolation in the data analysis and for extrapolation to allow corrections for higher momentum tracks. However, since the interval GeV/ contains 98% of all tracks, the magnitude of this extrapolation is small for the measurement.
IV.3 measurement
The electromagnetic transverse energy is defined as:
| (5) |
where is the electromagnetic energy measured in an EMC tower and is the polar angle of the center of the tower relative to the beam axis and the collision vertex position. Experimentally, is given by:
| (6) |
The sum over EMC towers corresponds to and . is the correction for the acceptance, is the energy measured by an EMC tower, is the total correction for each tower to exclude the contribution from hadrons . The correction is given by:
| (7) |
where is the energy deposited by a track projected on an EMC tower as a function of its momentum , pseudorapidity and distance to the center of the tower from the track hit point. is a correction to exclude electrons that are misidentified as hadrons and, therefore, should not be added to . This correction was estimated using the same procedure described in the previous section to exclude real electrons from the measurement. is the track efficiency, also discussed previously and is the correction to exclude the long-lived neutral hadron contribution. As in the case for , was estimated from the published STAR data at 130 GeV refSTARpBar ; refSTARpBarpErr ; refSTARNegChHad ; refSTARKaon . In this case, is defined as the energy deposited by all long lived neutral hadrons. The correction factor is .
The systematic uncertainty due to the track efficiency correction, as previously discussed, is 4%. The hadronic correction for charged tracks, , is based primarily on measured hadronic shower profiles with GEANT simulations used for interpolation between measurements and extrapolation beyond GeV/. The systematic uncertainty for this correction to is estimated from the observed uncertainties in the calculation of the hadronic profile at points in the shower library where full measurements were made. A 5% systematic uncertainty is consistent with the comparison of the measured and calculated shower profiles after normalization. Different from the hadronic component of transverse energy, there is no correction for cutoff in the hadronic background subtraction in the electromagentic energy. Such low tracks will not reach the calorimeter because of the strength of the magnetic field and, therefore, will not deposit energy in the detector.
As discussed earlier, the systematic uncertainty due to calibration of the detector is of the order of 2% and clearly this uncertainty contributes directly to the uncertainty in . The systematic uncertainty due to the electron background track correction is negligible ().
The cumulative effect of all uncertainties discussed in this section, which are assumed to be uncorrelated, is an overall systematic uncertainty estimate for of 8.0%. All corrections and the corresponding systematic uncertainties are summarized in Table 2.
| Description | Correction |
|---|---|
| 0.86 0.03 | |
| 0.96 (0.25 GeV/) | |
| 1.00 (1 GeV/) | |
| 0.70 0.04 (0.25 GeV/) | |
| 0.80 0.04 (1 GeV/) |
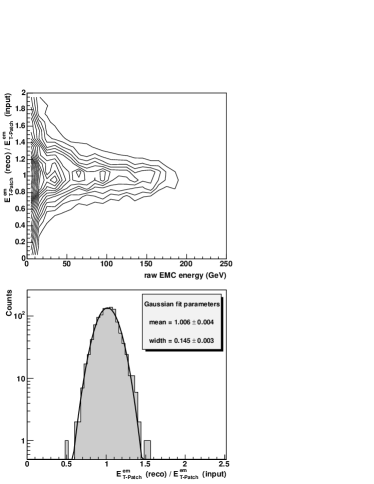
In order to evaluate the hadronic background subtraction procedure and estimate the event-by-event resolution of the reconstructed electromagnetic energy we have performed simulations in which we compare the reconstructed energy and the input from the event generator (HIJING). Fig. 6 (upper panel) shows the ratio, event by event, of the reconstructed to the input electromagnetic transverse energy as a function of the raw energy measured by the calorimeter in the same acceptance used in this analysis. The smaller the raw EMC energy, the larger the impact parameter of the collision. The reconstructed energy, on average, is the same as the input from the event generator. Edge effects due to the limited acceptance of the detector were also studied and the effect on the reconstructed values, on average, are negligible. The event-by-event resolution, however, improves as the event becomes more central. Fig 6 (lower panel) shows the ratio distribution for the most central events. The solid line is a gaussian fit, from which we estimate that the event-by-event resolution of the reconstructed electromagnetic energy to be 14.5% for central events. The main factors that determine this resolution are the hadronic energy subtraction and the corrections for track efficiency and long-lived neutral hadrons. The effect on the global measurement due to the tower energy resolution, considering the EMC patch available, was estimated to be 0.5% and that due to calibration fluctuations is 0.5%. The fluctuations due to the hadronic background subtraction procedure alone were estimated to be 12%, strongly dependent on the number of tracks used to correct the energy (for larger acceptances this resolution improves). The final distribution is also corrected for vertex reconstruction efficiency.
V Total Transverse Energy
The sum of and is the total transverse energy of the events. In Fig. 7 we present the distribution for minimum bias events, corrected for vertex reconstruction efficiency mainly in the low region. The scale of the upper horizontal axis corresponds to the measurement for the actual acceptance of and . The bottom axis is scaled to correspond to the for full azimuthal coverage.
In Fig. 7 we also present the distributions for different centrality bins defined by the percentages of the total cross section, selected on charged multiplicity with . The centrality bin defined as 0-5% (shaded area in Fig. 7) corresponds to the most central collisions amounting to 5% of the total cross section. The data for these centrality ranges are given in Table 3. The centrality bins are determined by the uncorrected number of charged tracks with and number of fit points larger than 10. The phase space overlap between the and centrality measurements is small so that there is negligible correlation between them beyond that due to the collision geometry.
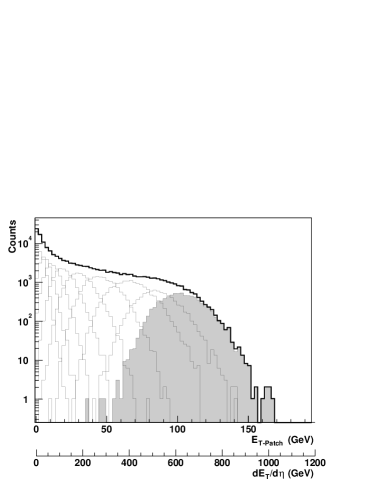
At the low energy edge, the distribution exhibits a peak, corresponding to the most peripheral collisions. For the largest values of the shape of the distribution is determined largely by statistical fluctuations and depends greatly on the experimental acceptance refAcc . For larger acceptances, the decrease with increasing is very sharp. For this measurement, the fall off of the distribution at large is strongly dominated by the limited acceptance which, at this point, obscures any possible physics fluctuation. Combining the two contributions (hadronic and electromagnetic energies) to the total transverse energy and properly taking into account the correlated uncertainties, we estimate a combined systematic uncertainty in of 7% and an event-by-event resolution of 17%. We obtained for the 5% most central collisions GeV, scaled for full azimuthal acceptance and one unit of pseudorapidity.
| Centrality (%) | (GeV) | (GeV) | (GeV) | (GeV) | |||
|---|---|---|---|---|---|---|---|
The upper panel of Fig. 8 shows per participant pair as a function of (obtained using Monte Carlo Glauber calculations refNpartNbin ). Data from Au+Au collisions at = 200 GeV from this analysis are shown together with similar measurements from Pb+Pb collisions at =17.2 GeV from WA98 refWA98 and Au+Au collisions at 130 GeV from PHENIX refPHENIX . These comparison measurements are at =0, whereas the measurement reported here is at . The grey bands for all three datasets show the overall systematic uncertainty of the data independent of , while the error bars show the quadratic sum of the statistical errors, which are typically negligible, and the systematic uncertainties in and refNpartNbin , with the latter dominating at low .
A model based on final state gluon saturation (EKRT refEskola ) predicts a decrease in more central nuclear collisions for both the charged particle multiplicity per participant and . Hydrodynamic work during expansion may reduce the observed relative to the initially generated ,perhaps by a factor at RHIC energies, refEskola , though this effect will be offset somewhat by the buildup of transverse radial flow refEskola ; refKolb . The dependence of observed in and system size in the EKRT model is:
| (8) |
The centrality dependence can be approximated by replacing by /2 refEskola , shown by the dotted line in Fig 8. The upper panel shows comparison to measured per participant pair, incorporating a Monte Carlo Glauber calculation for . The EKRT model is seen not to agree with the data in this panel, missing significantly both the centrality dependence and the normalization for central collisions. A similar comparison is made in the lower panel of Fig. 8, which differs from the upper panel only in the use of an Optical Glauber calculation for refNpartNbin . The centrality dependence of the data in this case is reproduced well by the model, though disagreement in normalization for central collisions remains. More precise comparison of the system size dependence of predicted by EKRT model to RHIC data requires either further refinement of the Glauber model calculations or measurements for central collisions with varying mass .
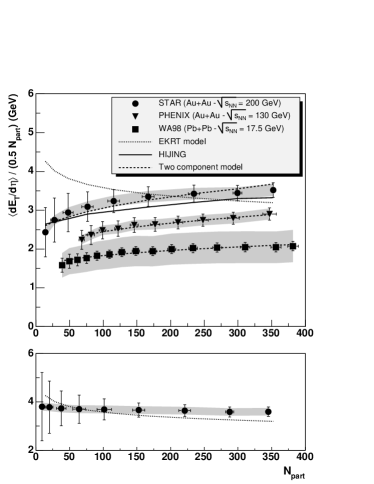
The HIJING model predicts an increase in /(0.5), as shown in Fig 8 upper panel. HIJING incorporates hard processes via the generation of multiple minijets together with soft production via string fragmentation. Effects of the nuclear geometry in HIJING are calculated using the Monte Carlo Glauber approach. Agreement of HIJING with the data is seen to be good in the upper panel.
We also study a simple two-component approach where . Using this model it is possible to estimate the fraction of hard collisions in the production. In this case, a simple fit function:
| (9) |
is applied to our data at 200 GeV and the published PHENIX and WA98 results including points with number of participants larger than 100. The results from the fits are shown in Table 4. The simple scaling ansatz does a good job describing the overall shape of the dependence at all energies. In this picture, the ratio estimates the fraction of the transverse energy that scales like hard processes. As seen in the third column in Table 4 this ratio for the most central events is constant within errors despite the expectation that the cross section for hard processes grows by a large factor from 17 to 200 GeV.
| (Gev) | |||
|---|---|---|---|
| STAR | |||
| PHENIX | |||
| WA98 |
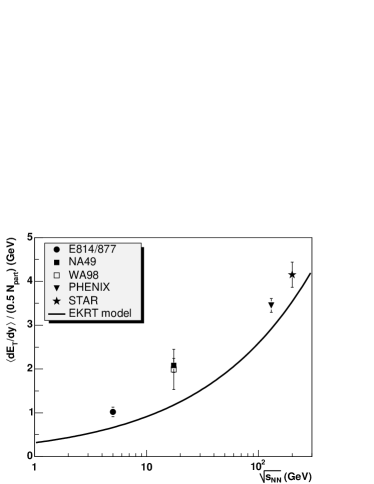
We observe an overall increase in the transverse energy of at 200 GeV relative to 130 GeV. In Fig. 9 we present our result for per participant pair for central collisions, together with results from other experiments at various collision energies from AGS to RHIC refBarrete2 ; refWA98 ; refPHENIX ; refNA49 . For the purposes of this comparison, we calculated from for our measurements using a factor of 1.18 obtained from HIJING simulations to convert from to phase-space. Our result is consistent with an overall logarithmic growth of with . The solid line is the prediction using the EKRT model refEskola for central Au+Au collisions. As one can see, EKRT model underestimates the final transverse energy by .
We have also estimated the spatial energy density produced in the collision using reported above, converted from pseudorapidity to rapidity density using the factor of 1.18 discussed above. Based on a scaling solution to the relativistic hydrodynamic equations, Bjorken refBjorken estimated the spatial energy density of the system in terms of the primordial transverse energy rapidity density , the transverse system size, , and a formation time .
| (10) |
We assumed fm/c which is the usual value taken in many analysis at SPS energies. For Au+Au at GeV we obtained GeV/fm3. The uncertainty includes only the uncertainty on . This energy density is significantly in excess of the energy density GeV/fm3 predicted by Lattice QCD for the transition to a deconfined Quark Gluon Plasma refKarsch . The estimate is based however upon the assumption that local equilibrium has been achieved at fm/c and that the system then expands hydrodynamically. Comparison of other RHIC data, in particular elliptic flow, to hydrodynamic calculations refSTARv2 ; refKolb2 indicates that this picture may indeed be valid.
In order to understand the systematic growth in transverse energy with collision energy shown in Fig. 9 we investigate the centrality dependence of /, the scaling of transverse energy relative to the number of charged particles produced in the collision. The centrality dependence of this ratio may indicate effects of hydrodynamic flow refKolb : if the expansion is isentropic then will remain constant, whereas will decrease due to the performance of longitudinal work.
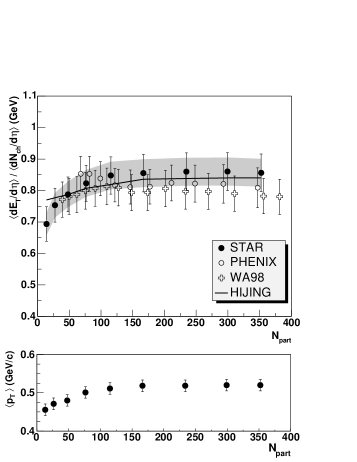
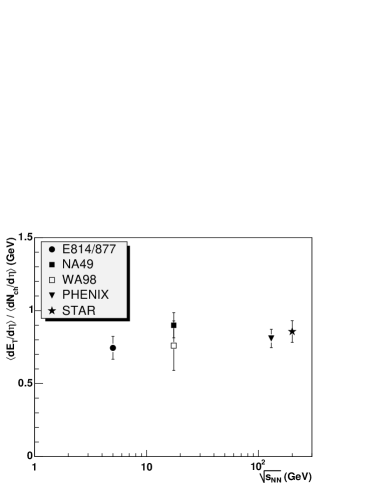
Fig. 10, upper panel, shows the centrality dependence of / from STAR measurements at GeV, compared to similar measurements at 17 and 130 GeV. Data at all energies fall on a common curve within uncertainties, with modest increase from the most peripheral collisions to =100, reaching a roughly constant value of /. Fig. 10, lower panel, shows the for 200 GeV Au+Au collisions measured by STAR refMeanPt200 , showing a dependence on centrality similar to that of the transverse energy per charged particle: modest increase with for , with constant value for more central collisions. The systematic behavior of , multiplicity and are similar, indicating that the growth of is due to increased particle production. Quantitative comparison of theoretical models of particle production with the measured centrality dependences of / and of charged particles will constrain the profile of initial energy deposition and the role of hydrodynamic work during the expansion.
In Fig. 11 we show, for central collisions, that this constant transverse energy production per charged particle is observed down to and including AGS measurements at GeV. A single value of MeV per charged particle or at most a slow logarithmic increase amounting to % characterizes all measurements within errors over a range in which the per participant grows by a factor of four. HIJING predicts that per charged particle should increase from SPS to RHIC energies due to the enhancement of minijet production at RHIC. However, the predicted increase is rather small and the systematic uncertainties on the measurement do not provide enough precision to significantly test this assumption.
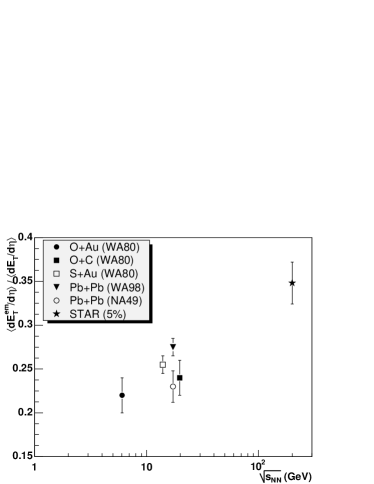
The procedures adopted in this analysis permit an independent measurement of the electromagnetic and hadronic transverse energy. This allows additional exploration of the collision dynamics and particle production. In Fig. 12 we show the ratio of the electromagentic to the total energy for the most central events as a function of the energy from lower SPS energies refWA982 ; refWA80 to our results at full RHIC energy. The observed electromagnetic fraction of the total transverse energy will be strongly influenced by the baryon to meson ratio. At very high energy it is expected that virtually all the will be carried by mesons and the fraction should approximate , whereas at low energy, baryon dominance of the transverse energy will result in a much smaller electromagnetic fraction.
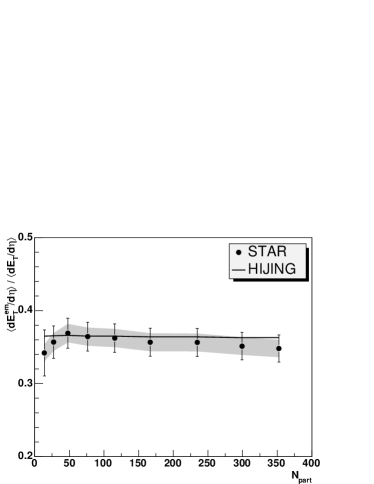
While the energy dependence seen in Fig. 12 is presumably dominated by the total meson content of the final state, the centrality dependence may provide additional detail about the reaction mechanisms. The centrality dependence of the electromagnetic fraction of our total measured energy is shown in Fig. 13. An excess photon yield may result from the formation of a long-lived deconfined phase, as suggested in Ref. refDIRPH . The predictions from HIJING simulations are also presented. We observe no significant dependence of the electromagnetic fraction with the collision centrality.
VI Summary
We have reported the measurement of transverse energy within , for centrality-selected Au+Au collisions at GeV. For the 5% most central events we measured GeV, corresponding to an increase of (247)% with respect to measurements at 130 GeV Au+Au collisions at RHIC refPHENIX .
We investigated the energy scaling with the number of participant nucleons and with the number of charged particles produced in the collision. We obtained, for the 5% most central events, GeV and MeV, respectively. We also compared the results of this work with measurements from AGS and SPS energies. It was found that the increase in the production from AGS up to RHIC energies comes mostly from the increase in the particle production. A final state gluon saturation model (EKRT), HIJING and a simple two component (hard/soft) model were compared to the data. Although the EKRT model predicts a different centrality behavior of energy production the uncertainties in the determination does not allow us to discard this model. The simple two component ansatz suggests that, despite the large uncertainties, the fraction of energy arising from hard processes which is still visible in the final state does not increase significantly from SPS to RHIC energies.
Other measurements at RHIC and comparison to theoretical calculations suggest that a dense, equilibrated system has been generated in the collision and that it expands as an ideal hydrodynamic fluid. The good agreement between hydrodynamic calculations and measurements of particle-identified inclusive spectra and elliptic flow refSTARv2 are consistent with the onset of hydrodynamic evolution at a time fm/c after the collision refKolb2 . The strong suppression phenomena observed for high hadrons refSTARHighpt1 ; refSTARHighpt2 ; refSTARHighpt3 suggest that the system early in its evolution is extremely dense. Estimates based on these measurements yield an initial energy density in the vicinity of 50-100 times cold nuclear matter density. Within the framework of boost-invariant scaling hydrodynamics refBjorken , from the measurement presented here we estimate an initial energy density of about 5 GeV/fm3. This should be understood as a lower bound refMatsui ; refDumitru , due to the strong reduction in the observed relative to the initially produced from longitudinal hydrodynamic work during the expansion. These three quite different approaches produce rough agreement for the estimated initial energy density, with a value well in excess of that predicted by Latice QCD for the deconfinement phase transition refKarsch .
The method used in this analysis permitted an independent measurement of the electromagnetic and hadronic components of the total energy. The electromagnetic fraction of the transverse energy for the 5% most central events obtained in this work is , consistent with a final state dominated by mesons. Some models refDIRPH expect that the formation of a long lived deconfined phase in central events may increase the yield of direct photon production and, therefore, an increase in the electromagnetic fraction of the transverse energy. We, however, observe that the electromagnetic fraction of the transverse energy is constant, within errors, as a function of centrality. Measurements with larger acceptances would have systematic uncertainties significantly reduced and therefore would be able to show smaller effects that can not be observed with the precision of the present measurement.
We thank the RHIC Operations Group and RCF at BNL, and the NERSC Center at LBNL for their support. This work was supported in part by the HENP Divisions of the Office of Science of the U.S. DOE; the U.S. NSF; the BMBF of Germany; IN2P3, RA, RPL, and EMN of France; EPSRC of the United Kingdom; FAPESP of Brazil; the Russian Ministry of Science and Technology; the Ministry of Education and the NNSFC of China; Grant Agency of the Czech Republic, FOM and UU of the Netherlands, DAE, DST, and CSIR of the Government of India; Swiss NSF; and the Polish State Committee for Scientific Research.
References
- (1) T. Roser, Nucl. Phys. A698, 23c (2002).
- (2) J. P. Blaizot, Nucl. Phys. A661, 3c (1999).
- (3) P. Jacobs and X.N. Wang, hep-ph/0450125 (2004).
- (4) M. Jacob, P.V. Landshoff, Mod. Phys. Lett. A1, 657 (1986).
- (5) X.N. Wang, Phys. Repts. 280, 287 (1997).
- (6) M. Gyulassy and T. Matsui, Phys. Rev. D29, 419 (1984).
- (7) K. J. Eskola, K. Kajantie, P. V. Ruuskanen and K. Tuominen, Nucl. Phys. B570, 379 (2000).
- (8) P.F. Kolb, U. Heinz, P. Huovinen, K. J. Eskola and K. Tuominen, Nucl. Phys. A696, 197 (2001).
- (9) A. Dumitru and M. Gyulassy, Phys. Lett. B494, 215 (2000).
- (10) G. R. Young, Annu. Rev. Nucl. Part. Sci. 42, 237 (1992).
- (11) WA80 Collaboration, R. Albrecht et al., Phys. Rev. C44, 2736 (1991).
- (12) J. Barrette et al., Phys. Rev. Lett. 70, 2996 (1993).
- (13) T. Alber et al., Phys. Rev. Lett. 75, 3814 (1995).
- (14) WA98 Collaboration, M. M. Aggarwal et al., Eur. Phys. Journal C 18, 651 (2001).
- (15) PHENIX Collaboration, K. Adcox et al., Phys. Rev. Lett. 87, 052301 (2001).
- (16) J. D. Bjorken, Phys. Rev. D27, 140 (1983).
- (17) F. Karsch, Nucl. Phys. A698, 199c (2002).
- (18) S. Turbide, R. Rapp and C. Gale, Phys. Rev. C69, 014903 (2004).
- (19) WA98 Collaboration, M. M. Aggarwal et al., nucl-ex/0006007 (2000).
- (20) STAR Collaboration, J. Adams et al., nucl-ex/0311017 (2003).
- (21) STAR Collaboration, K. H. Ackermann et al., Nucl. Instrum. Methods Phys. Res., Sect. A 499, 624 (2003).
- (22) M. Beddo et al., Nucl. Instrum. Methods Phys. Res., Sect. A 499, 725 (2003).
- (23) M. Anderson et al., Nucl. Instrum. Methods Phys. Res., Sect. A 499, 659 (2003).
- (24) C. Adler et al., Nucl. Instrum. Methods Phys. Res., Sect. A 470, 488 (2001).
- (25) PHENIX Collaboration, S. S. Adler et al., Phys. Rev. C69, 034909 (2004).
- (26) P. Nevski, Proceedings of the International Conference on Computing in High Energy and Nuclear Physics, Padova, Italy (2000).
- (27) X. N. Wang and M. Gyulassy, Phys. Rev. D44, 3501 (1991).
- (28) STAR Collaboration, C. Adler et al., Phys. Rev. Lett. 87, 262302 (2001).
- (29) STAR Collaboration, C. Adler et al., Phys. Rev. Lett. 90, 119903 (2003).
- (30) STAR Collaboration, C. Adler et al., Phys. Rev. Lett. 87, 112303 (2001).
- (31) STAR Collaboration, C. Adler et al., nucl-ex/0206008 (2002).
- (32) STAR Collaboration, C. Adler et al., Phys. Rev. Lett. 89, 092301 (2002).
- (33) STAR Collaboration, J. Adams et al., Phys. Rev. Lett. 92, 112301 (2004).
- (34) T. M. Cormier et al., Nucl. Instrum. Methods Phys. Res., Sect. A 483, 734 (2002).
- (35) T. Abbott et al., Phys. Rev. C63, 064602 (2001).
- (36) D. Kharzeev and M. Nardi, Phys. Lett. B507, 121 (2001).
- (37) STAR Collaboration, J. Adams et al., Phys. Rev. Lett. 91, 172302 (2003).
- (38) WA98 Collaboration, Systematic of Transverse Energy Production In 208Pb Induced Collisions at 158GeV/nucleon, UT/ORNL WA98 Preprint (1996).
- (39) F. Halzen and H. C. Liu, Phys. Rev. D25, 1842 (1982).
- (40) STAR Collaboration, C. Adler et al., Phys. Rev. Lett. 89, 202301 (2002).
- (41) T. S. Ullrich, Nucl. Phys. A715, 399c (2003).
- (42) STAR Collaboration, J. Adams et al., Phys. Rev. Lett. 92, 052302 (2004).
- (43) P. F. Kolb and U. Heinz, nucl-th/0305084 (2003).
- (44) STAR Collaboration, J. Adams et al.,Phys. Rev. Lett. 91, 072304 (2003).
- (45) STAR Collaboration, C. Adler et al., Phys. Rev. Lett. 90, 082302 (2003).