Neutron and proton energy spectra from the non-mesonic weak decays of He and C
Abstract
We have simultaneously measured the energy spectra of neutrons and protons emitted in the non-mesonic weak decays of He and C hypernuclei produced via the (,) reaction with much higher statistics over those of previous experiments. The neutron-to-proton yield ratios for both hypernuclei at a high energy threshold (60 MeV) were approximately equal to two, which suggests that the ratio of the neutron- and proton-induced decay channels, ()/(), is about 0.5. In the neutron energy spectra, we found that the yield of the low-energy component is unexpectedly large, even for He.
keywords:
hypernuclei , non-mesonic weak decay , nucleon energy spectrumPACS:
21.80.+a , 13.30.Eg , 13.75.Ev, , , , , , , , , , , , , , , , , , , , , , , , , , , , , , , ,
1 Introduction
In free space, a particle decays dominantly associated with a pion in the final state as . In the case of bound in a nucleus, a hypernucleus, is not only possible to decay as in the free space (mesonic weak decay), but is also able to stimulate a nucleon in the nucleus as “” (non-mesonic weak decay, NMWD). The NMWD gives a unique opportunity to study the weak interaction between baryons, because this strangeness non-conserving process is purely attributed to the weak interaction.
In the NMWD of a hypernucleus, there are two decay channels, () and (). The ratio of those decay widths, /, is an important observable used to study the isospin structure of the NMWD mechanism. For the past 40 years, there has been a longstanding puzzle that the experimental / ratio disagrees with that of theoretical calculations based on the most natural and simplest model, the One-Pion Exchange model (OPE). In this model, the reaction is expressed as a pion absorption process after the decay inside the nucleus. Since the OPE process is tensor-dominant and the tenser transition of the initial pair in the -state requires the final pair to have isospin zero, the ratio in OPE process becomes close to 0. However, previous experimental results have indicated a large ratio (1) [1, 2].
This large discrepancy between the OPE-model predictions and the experimental results has stimulated many theoretical studies: the heavy meson exchange model [3, 4, 5], the Direct Quark model [6, 7, 8, 9, 10] and the two-nucleon (2) induced model () [11]. After K. Sasaki et al. pointed out an error about the sign of the Kaon exchange amplitudes in 2000 [10], those theoretical values of the ratio have increased to the level of 0.40.7 [12].
On the other hand, the experimental data still have large errors ( = 0.93 0.55 for He [1]), and it is hard to draw a definite conclusion on the ratio. So far, several nucleon energy spectra from hypernuclear decay have been reported. Most of the experiments measured only the proton energy spectra, because of the difficulty in detecting neutrons. The ratio has been estimated through a comparison of the measured proton spectrum with that of the intra-nuclear cascade calculation by changing the ratio [13]. In this method, there are large uncertainties due to the indirect evaluation of neutrons.
Recently, the neutron energy spectra from C and Y were measured with high statistics [14]. For C, the ratio was extracted from the neuron-to-proton yield ratio, , estimated by the neutron energy spectrum combined with a proton energy spectrum measured in another experiment [13]. The energy loss of protons in the target, however, was not able to be corrected for. Since there were ambiguities coming from different detection energy thresholds in the two measurements, the value might be affected by a large systematic error. We therefore simultaneously measured the neutron and proton spectra from the decay of hypernuclei with a proton energy loss correction, and with much higher statistics over those of previous experiments.
When we compare the “measured” ratio with that obtained in theoretical calculations, the most serious technical problem was a treatment of the re-scattering effect in the residual nucleus, the so-called Final State Interaction (FSI). The nucleon energy spectrum emitted from the two-body NMWD process, , must originally have a broad peak at half of the Q-value ( 76 MeV). The FSI effect distorts the nucleon spectra enhancing the low energy region, in which the strength of the effect depends on the mass number of the hypernuclei. In order to minimize the FSI effect, we selected a light -shell hypernucleus, He. In the -shell hypernucleus, initial relative states must be states, whereas in a -shell hypernucleus it is possible to be states. According to Ref. [15], the transitions coming from the states were predicted to be small, though we need experimental confirmation for that. In order to investigate the -wave effect, we also performed the same experiment for a typical light -shell hypernucleus, C. In this paper, we show those energy spectra for both hypernuclei and present the neuron-to-proton yield ratios, , with a high energy threshold (60 MeV) in order to get rid of the contribution from the FSI effect.
On the other hand, the nucleon yields in the low energy region should be sensitive to the strength of the FSI effect. In the proton measurement there is a cutoff energy, typically at 30 40 MeV, due to the energy loss inside the target and the detector, whereas in the neutron measurement we have experienced sensitivity in the whole energy region. In this paper, we also show the mass number dependence of the “neutron” energy spectra for A = 5 and 12, with that for A = 89 [14], which provides valuable information to investigate the FSI effect. The possible existence of a multi-nucleon induced process in which the Q-value can be distributed over three or more nucleons in the final state has been discussed theoretically (such as 2-induced process), though there has been no experimental evidence so far; the nucleons emitted from this process should also distribute in the low energy region. Thus, the whole shape of the neutron energy spectrum also brings useful knowledge on the multi-nucleon induced NMWD mechanism.
2 Experimental method
The present experiments (KEK-PS E462/E508) were carried out at the 12-GeV proton synchrotron (PS) in the High Energy Accelerator Research Organization (KEK). Hypernuclei, He and C, were produced via the (,) reaction at 1.05 GeV/ on 6Li and 12C targets, respectively. Since the ground state (g.s.) of Li is above the threshold of He , the g.s. promptly decays into He emitting a low-energy proton. The 6Li (,) Li reaction was therefore employed to produce He. The hypernuclear mass spectra were calculated by reconstructing the momenta of incoming and outgoing using a beam-line spectrometer composed of the QQDQQ system and the superconducting kaon spectrometer (SKS) [16], respectively.
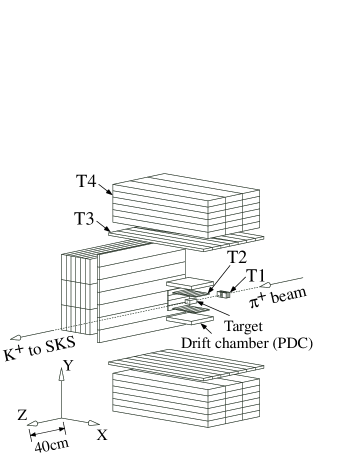
Particles emitted from the decays of hypernuclei were detected by the decay-particle detection system, as shown in Fig. 2. It was composed of plastic scintillation counters (T1, T2, T3 and T4) and a multi-wire drift chamber (PDC). The neutral particles, neutrons and gammas, were identified by means of the time-of-flight (TOF) technique between T1 and T4; in addition, T3 was used as a veto counter in order to reject charged particles. The charged particles, protons and charged pions, were identified by utilizing on T2, total energy deposit on sequentially fired counters (T2, T3 and T4), and the TOF between T2 and T3. Their trajectories were measured by PDC.
3 Analysis
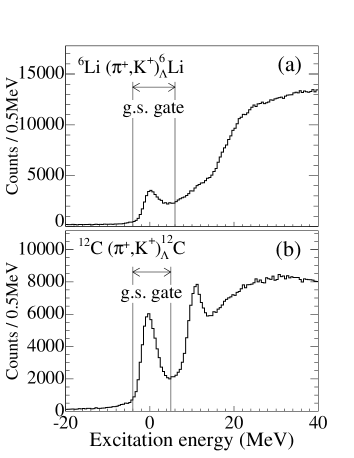
Figure 3 shows the inclusive excitation-energy spectra of Li and C. The g.s. peak is clearly seen in our excitation spectra for both hypernuclei. We selected events from the hypernuclear production by gating the g.s. peak, as shown in the figure.
The yields of He and C are, respectively, about 4.6 104 and 6.2 104, which were one order-of-magnitude higher than those of previous experiments. There is a constant background below the g.s. peak; the background for He and C within the g.s. gate were estimated to be as small as 8% and 3%, respectively. We estimated the contribution from this constant background in the nucleon spectra and subtracted it from the g.s. gated nucleon spectra.
In the neutral decay particle analysis, the TOF between the reaction vertex and the T4 counter, , is expressed as , where and are the timings of T4 and T1 (time zero), respectively; means the flight time of the beam pion; corresponds to the time delay due to the hypernuclear lifetime. Since cannot be determined for each event individually, we replaced with the mean lifetime of the hypernuclei to avoid a systematic energy shift in the neutron energy spectra. Here, we used the lifetimes of ps for He and ps for C, improved through the lifetime analysis of the present experiment [17].
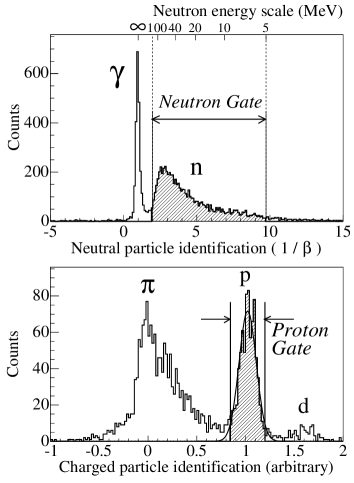
The inverse of the neutron velocity, 1/, was calculated as 1/ = / , where is the flight length and is the light velocity. The top of Fig. 3 shows the measured 1/ spectra with a light-output threshold of 2 MeVee (MeV electron equivalent) for C. The energy scale is displayed on the upper horizontal axis. The gate region of the neutron was defined as 1.97 9.73, which corresponds to 5 150 MeV of neutron energy. The spectrum shows good /neutron separation. The extremely low background level of the 0 region in the spectrum indicates that the accidental background is negligibly small. The neutron energy resolutions for He and C were estimated from the width of the -ray peak. They were, respectively, about 10 MeV and 7 MeV in full width at half maximum (FWHM) at 75 MeV.
The bottom of Fig. 3 shows the particle identification (PID) of the charged particles emitted from the decay of He. This plot was made by the PID function derived from the , the total energy and the particle velocity. The charged particles (charged pions, protons and deuterons) were separated well. It is noteworthy that deuterons were separated from the protons for the first time in such counter experiments for the NMWD. The proton peak was fitted by a Gaussian function, and the proton gate was set at the 2 region of the Gaussian, as shown in the figure. The loss of protons (4.6%) by this tight cut was taken into account in the analysis efficiency. The proton kinetic energy was determined by the TOF between T2 and T3, which must be affected by the energy losses inside the target and in the T2 counter. Those energy losses were estimated event-by-event from the path length inside the target and the T2 counter, which was calculated from the reaction vertex and the trajectory.
The numbers of the neutron and proton per NMWD at energy , and , are expressed as
| (1) |
where is the number of g.s. formations in the inclusive spectrum; and are the numbers of detected neutrons and protons from the decay.
The acceptances for the neutron and proton detection system, and , were estimated respectively to be 26.6 0.8% and 10.0 0.3% by a Monte-Carlo simulation. Only for the proton analysis, we selected the central parts of the segmented T2 and T3 counters of the top and bottom coincidence arms in order to suppress ambiguity of the acceptance estimation due to escape from the side edge of the T4 counter. The difference between and is attributed to this selection.
The non-mesonic decay branching ratios of He and C, , were evaluated as 0.429 0.012(stat) 0.005(sys) and 0.768 0.005(stat) 0.012(sys), respectively, by and branching-ratio analyses of the present experiment [17, 18].
The energy-dependent detection efficiency for the neutron, , was estimated by the Monte-Carlo simulation code DEMONS [19], which is based on CECIL [20] and is applicable to multi-element neutron detectors. We compared the calculated efficiencies with those of various existing experimental data [14], and found that the systematic error does not exceed 6% for integrated yields above 10, 20, 30 and 40 MeV. According to a Monte-Carlo simulation for the proton, there is no experimental sensitivity to a proton below about 30 MeV, due to the energy loss, and the detection efficiency was gradually reduced from 50 MeV to 30 MeV. The energy-dependent detection efficiency for the proton, , was calculated using the simulation.
There is a non-negligible nucleon background due to the pion absorption process in which ’s from the mesonic decay of hypernucleus are absorbed by the materials around the target. The background was estimated by assuming that the shape of the nucleon spectra from this absorption process is the same as that from the decay of ( ) formed via the quasi-free formation process. Here, we regarded the branching ratio of the quasi-free decay as that of in the free space, and estimated the contribution using the branching ratios, 0.359 0.009 for He [17] and 0.099 0.011(stat) 0.004(sys) for C [13].
4 Results and Discussion
The top and middle of Fig. 4 show the neutron/proton energy spectra from the decay of He and C, respectively. They were normalized per NMWD. It seems that the neutron spectra for both hypernuclei have a similar shape to those of protons above the proton energy threshold of 30 MeV, and the neutron yields were about twice higher than those of protons. Thanks to the event-by-event energy-loss correction for proton, we can directly compare the neutron energy spectra with those of the protons at the same energy threshold.
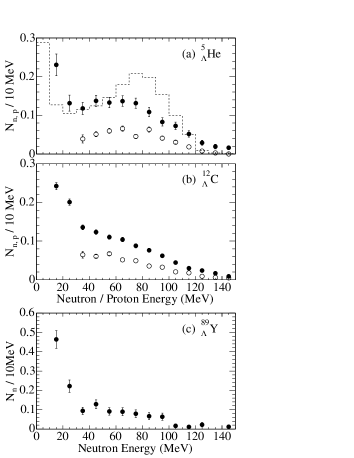
It should be noted that the partial decay rate of the He process, which emits a monochromatic high-energy neutron ( 135 MeV), is not negligible. The decay rate was reported as 0.049 0.01 [21], where is the decay width of He. Though it is hard to observe the corresponding peak due to the limited resolution, MeV (FWHM) at such a high-energy region, one can see an appreciable neutron yield at the high-energy region (120 150 MeV) in the neutron spectra of He, which can be considered to be the events from this process.
The FSI process and the possible multi-nucleon induced process (such as the 2-induced process) tend to enhance the low-energy region in the nucleon energy spectra. In order to reduce the effects from those processes, we set the energy threshold to be as high as 60 MeV, which is near to half of the Q-value ( 76 MeV) of the decay process. The ratios of the yields between neutrons and protons, , for He and C above 60 MeV, were obtained respectively as follows:
| (2) | |||||
| (3) |
where we set the upper energy limit of 110 MeV only for He in order to avoid the contamination from the He process. Systematic errors are predominantly coming from an ambiguity of the absolute neutron detection efficiency (6%). Due to the similar spectrum shape for neutrons and protons, the ratios of both hypernuclei are quite stable for a change of the energy thresholds. Recently, an independent experimental result of the on C was reported as [14], which agrees with our result within the errors. If the FSI effect and the contribution of the 2-induced process can be neglected, the relation between the and the for decay process is approximately expressed as
| (4) |
When we applied the above relation to the obtained , the ratios for both hypernuclei were obtained as about 0.50.6. The result excludes earlier experimental results that the is close to unity [1, 2]. It also rules out a theoretical calculation based on the OPE model, which predicts that the value should be as small as 0.1. Our result supports recent calculations based on short-range interactions, such as the heavy-meson exchange and the direct quark exchange. Moreover, we could not observe significant difference of the ratio between the -shell and -shell hypernuclei. It is suggested small contribution from the -wave in this process.
The bottom of Fig. 4 shows the neutron spectrum per NMWD of Y obtained in a previous experiment [14]. With this spectrum, the mass-number dependence of the neutron energy spectra for A = 5, 12 and 89 is shown. The integrated numbers of neutrons per NMWD of He, C and Y are listed in Table 1 for energy thresholds of 10, 20, 30 and 40 MeV. The high-energy region is suppressed with the increase of mass number while enhancing the low-energy component. This tendency can be naturally interpreted as being the FSI effect.
| Total number of neutrons per non-mesonic decay | |||
|---|---|---|---|
| He | C | Y [14] | |
| 10 MeV | 1.3980.0520.096 | 1.2660.0200.090 | 1.360.080.09 |
| 20 MeV | 1.1680.0440.080 | 1.0240.0180.072 | 0.890.060.06 |
| 30 MeV | 1.0360.0390.071 | 0.8230.0160.058 | 0.670.060.04 |
| 40 MeV | 0.9180.0360.063 | 0.6870.0150.048 | 0.580.050.04 |
If the 1-induced process () dominates the NMWD and the FSI effect is negligible, the neutron energy spectrum should have a broadened peak, due to the Fermi motion, at about one half of the Q-value of the process (75 MeV). We simply expected that this would be the case for He due to its small mass number. Garbarino et al. reported a calculated nucleon energy spectrum for He with the FSI effect and assuming that and , where and denote the decay widths of the 1- and 2-induced processes [22]. It is overlaid on the top of Fig. 4 (dashed histogram) on the same scale. The observed spectrum was significantly different from the calculated energy spectrum. The calculated spectrum still has its maximum at about Q/2, whereas the experimental spectrum levels off in the region from 20 to 80 MeV.
It should be noticed that there are so far two types of the 2-induced NMWD models. One is a three-body reaction in which the Q-value can be distributed over three nucleons in the final state. The other is based on the correlated two-nucleon absorption of a virtual pion emitted from the weak vertex of , in which the energy of the emitted nucleon is small, since the virtual pion is close to on-shell [22]. Since most of the Q-value in this 2-induced process is distributed to two nucleons, the shape of the energy spectra should be close to that in the 1-induced process (). Thus, the latter model adopted in the calculated spectra has a much smaller effect to enhance the low-energy region than the former model. This suggests the importance of the former 2-induced model. Another speculation could be that the FSI effect is much stronger than that in the calculation by Garbarino et al.
5 Conclusion
We measured the energy spectra of neutrons and protons emitted from the non-mesonic decays of He and C with high statistics. Both the neutron and proton spectra show a similar shape. The obtained neutron-to-proton yield ratios, , for both hypernuclei are approximately equal to two with high energy thresholds, which are consistent with a simple estimation assuming 0.5. This result rules out a theoretical calculation based on the OPE model, and supports recent calculations based on short-range interactions. In the present experiment, the high statistics of the observed nucleons has enabled us to carry out a coincidence analysis of the two nucleons, and , which is now in progress. The analysis will provide a definitive ratio. In the obtained neutron spectrum for He, the spectral shape was not consistent with the simple expectation that there is a broad peak at one half of the Q-value. This indicates the importance of the multi-nucleon induced process in the NMWD or/and a large FSI effect, even for He. This result calls for more detailed studies concerning the 2-induced NMWD process and the FSI effect.
Acknowledgments
We are grateful to Prof. K. Nakamura and the KEK-PS staff for support of the present experiment. We also acknowledge the staff members of the cryogenic group at KEK. This work was supported in part under the Korea-Japan collaborative research program of KOSEF(R01-2000-000-00019-0) and KRF(2003-070-C00015).
References
- [1] J. J. Szymanski et al., Phys. Rev. C 43 849 (1991).
- [2] H. Noumi et al., Phys. Rev. C 52 2936 (1995).
-
[3]
J. F. Dubach et al.,
Nucl. Phys. A 450, 71c (1986);
J. F. Dubach, G. B. Feldman, B. R. Holstein, Ann. Phys. 249 146 (1996). - [4] A. Parreño, A. Ramos and C. Bennhold, Phys. Rev. C 56, 339 (1997).
- [5] A. Parreño and A. Ramos, Phys. Rev. C 65, 015204 (2002).
- [6] C. Y. Cheung, D. P. Heddle and L. S. Kisslinger, Phys. Rev. C 27, 335 (1983).
- [7] D. P. Heddle and L. S. Kisslinger, Phys. Rev. C 33, 608 (1986).
- [8] T. Inoue, S. Takeuchi and M. Oka, Nucl. Phys. A 597, 563 (1996).
- [9] T. Inoue, M. Oka, T. Motoba, and K. Itonaga, Nucl. Phys. A 633, 312 (1998).
- [10] K. Sasaki, T. Inoue and M. Oka, Nucl. Phys. A 669, 331 (2000); Nucl. Phys. A 678, 455 (2000) (E).
- [11] W. M. Alberico, A. De Pace, M. Ericson, and A. Molinari, Phys. Lett. B 256, 134 (1991).
- [12] For a review, see W. M. Alberico and G. Garbarino, Phys. Rept. 369, 1 (2002).
-
[13]
O. Hashimoto et al.,
Phys. Rev. Lett. 88, 042503 (2002);
Y. Sato et al., submitted to Phys. Rev. C. - [14] J. H. Kim et al., Phys. Rev. C 68, 065201 (2003).
- [15] C. Bennhold and A. Ramos, Phys. Rev. C 45, 3017 (1992).
- [16] T. Fukuda et al., Nucl. Instrum. and Meth. A 361, 485 (1995).
- [17] S. Kameoka et al., to appear in Nucl. Phys. A, nucl-ex/0402023 (2004).
- [18] S. Okada et al., to appear in Nucl. Phys. A, nucl-ex/0402022 (2004).
- [19] R. C. Byrd et al., Nucl. Instrum. Meth. A 313, 437 (1992).
- [20] R. A. Cecil, B. D. Anderson and R. Madey, Nucl. Instrum. Meth. 161, 439 (1979).
- [21] G. Coremans et al., Nucl. Phys. B 16, 209 (1970).
- [22] G. Garbarino, A. Parreño and A. Ramos, Phys. Rev. C 69, 054603 (2004).