The 8B Neutrino Spectrum
Abstract
Knowledge of the energy spectrum of 8B neutrinos is an important ingredient for interpreting experiments that detect energetic neutrinos from the Sun. The neutrino spectrum deviates from the allowed approximation because of the broad alpha-unstable 8Be final state and recoil order corrections to the beta decay. We have measured the total energy of the alpha particles emitted following the beta decay of 8B. The measured spectrum is inconsistent with some previous measurements, in particular with a recent experiment of comparable precision. The beta decay strength function for the transition from 8B to the accessible excitation energies in 8Be is fit to the alpha energy spectrum using the R-matrix approach. Both the positron and neutrino energy spectra, corrected for recoil order effects, are constructed from the strength function. The positron spectrum is in good agreement with a previous direct measurement. The neutrino spectrum disagrees with previous experiments, particularly for neutrino energies above 12 MeV.
pacs:
23.40.Bw, 23.60.+e, 26.65.+t, 27.20.+nI Introduction
The most carefully studied component of the solar neutrino flux is due to neutrinos from the decay of 8B. The 8B neutrinos account for most of the signal in the Homestake 37Cl neutrino capture experiment Cleveland et al. (1998) and nearly all of the solar neutrino events in the Kamiokande Kamiokande collaboration et al. (1996), Super-Kamiokande Super-Kamiokande collaboration et al. (2001), and the Sudbury Neutrino Observatory (SNO) The SNO collaboration et al. (2003) water-Cherenkov experiments. Results from the SNO heavy water detector demonstrate the existence of a component of the solar neutrino flux The SNO collaboration et al. (2003). The solar neutrino data is explained by flavor oscillations and non-zero neutrino mass Maltoni et al. (2003). The recent results of the KamLAND reactor disappearance experiment Eguchi et al. (2003) support the oscillation interpretation Maltoni et al. (2003). The neutrino oscillation solution implies that the solar 8B energy spectrum is distorted. Knowledge of the primary 8B neutrino spectrum is a necessary ingredient for the proper interpretation of the solar neutrino data.
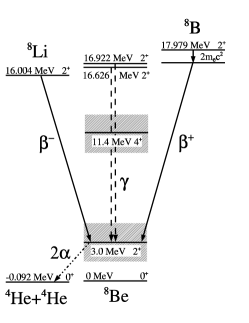
A diagram illustrating the 8B decay chain is shown in Fig. 1. The 8B ground state (Jπ=2+) undergoes an allowed transition to a broad range of excitation energies in the unstable 8Be daughter. We define the 8B decay strength function as the probability that a given excitation energy in 8Be will be populated. The strength function is determined by measurements of the particle energy spectrum following the breakup of the daughter 8Be nucleus, and is necessary to construct the neutrino spectrum.
Transitions from 8B to the 8Be ground state (Jπ=0+) or the broad state at 11.4 MeV (Jπ=4+) are second forbidden and highly suppressed. States in 8Be with Jπ=1+,3+ are not energetically accessible. The 8B decay thus proceeds exclusively through the resonance 2+ structure in 8Be, described in the R-matrix formalism as a series of interfering 2+ states. We have measured the total energy of the particles emitted following 8B decay in a recent experiment Winter et al. (2003), reviewed in Sec. II. The data are analyzed in the framework of the many-level R-matrix approximation to fit the decay strength function, which is presented in a table and compared with the results of the previous precision measurement Ortiz et al. (2000) in Sec. III. The R-matrix approach employed here is not essential for obtaining the neutrino spectrum, but provides a convenient way to characterize the experimental data.
The 8B neutrino spectrum is subject to corrections due to recoil order matrix elements. Measurements involving the () decay of 8B(8Li) and the radiative decays of the 2+ doublet in 8Be with excitation energies near 16 MeV, shown in Fig. 1, are used to extract the recoil order matrix elements which contribute to 8B decay. A review of past recoil order measurements is presented in Sec. IV.
Both the 8B positron and neutrino energy spectra are deduced, using the strength function and applying recoil order and radiative corrections, in Sec. V. The agreement between this work and the previous direct measurement of the positron spectrum Napolitano et al. (1987) is discussed, and the neutrino spectrum is presented in a table.
II The Alpha Spectrum Measurement
A description of the -spectrum measurement discussed here has been presented previously Winter et al. (2003). In this section we briefly recount the experimental technique, focusing on the experimental uncertainties.
II.1 Experimental Technique
A beam of 8B ions was implanted near the midplane of a 91 m thick planar Si detector. An implanted source eliminates the possibility of energy loss outside the sensitive region of the detector, a systematic effect in all previous experiments. The detector thickness was just sufficient to stop particles emitted with the highest possible energy (about 8.5 MeV). Thus the full energy of both particles was detected while the positrons, usually close to minimum ionizing, deposited only a small amount of energy. The systematic effect of positron energy was further reduced with a coincidence detector, selecting events where the positron trajectories were close to normal to the Si detector surface. The system was calibrated using a beam of 20Na which was also implanted near the detector midplane. The 20Na decays with 20% probability to unstable levels in 20Ne, providing calibration lines of well-known energy Ajzenberg-Selove (1988). An external 228Th source was used to provide additional calibration lines.
The experiment used the ATLAS superconducting linear accelerator at the Argonne National Laboratory. The 8B (t1/2=7703 ms) beam was produced by the In-Flight Technique Harss et al. (2000) using the 3He(6Li,8B)n reaction. The primary 6Li beam, with energy 36.4 MeV, bombarded a 3.5 cm long gas cell filled with 700 mbar 3He and cooled to 82 K. The gas cell was separated from the beam-line vacuum by titanium windows. The pressure and temperature in the cell were held constant to 1%.
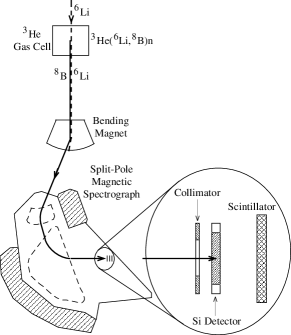
Fully stripped 8B products were separated from the primary beam with a 22∘ bending magnet, and transported through an Enge Split Pole spectrograph. A gas-filled detector located in the focal plane of the spectrograph Rehm and Wolfs (1988) identified the 8B products by mass, nuclear charge, and energy. The spectrograph was then adjusted so that 8B ions with energies of 27.30.2 MeV were incident on the planar Si detector with a 150 mm2 active area (13.8 mm diameter), located adjacent to the focal plane detector. An 11 mm diameter Ta collimator masked the edges of the detector. The beam was cycled (1.5 sec on/1.5 sec off) and data taken only during the beam-off cycles. The average implantation rate was 3 8B ions/sec, and 4.5105 decays were observed over six days.
Using the gas-filled focal plane detector, the 8B beam purity was measured to be about 10-3. A portion of the low-energy tail of the primary 6Li beam, as well as particles, deuterons, and protons with the proper magnetic rigidity to traverse the spectrograph, accounted for the remainder of ions incident on the detector. A 6Li beam incident on 3He cannot produce any delayed particle emitters other than 8B, which could create a background during the beam-off data acquisition cycles. No products resulting from possible interactions between 6Li and the titanium windows of the gas-cell were observed with the proper rigidity to be incident on the Si detector.
The particle detector, located 12 mm behind the Si detector, was a 25 mm diameter 2 mm thick plastic scintillator coupled by a lightguide to a Hamamatsu R647 photomultiplier tube. The detector identified a subset of events where the positron from the 8B decay exited the Si detector with a trajectory within 30∘ to normal. Roughly 16% of the observed events occurred in coincidence with a count in the detector, consistent with expectations from detector geometry. The Si/scintillator detector system was cooled to -5∘C. A schematic representation of the apparatus is shown in Fig. 2.
The calibration using implanted 20Na was performed immediately before the 8B run. The 20Na delayed alpha particles provided three calibration lines near the region of the 8B spectrum peak, with energy releases of 2691.91.2, 3099.02.2, and 5544.02.8 keV Ajzenberg-Selove (1988). The 20Na (t1/2=4483 ms) beam was produced by using the 19F(3He,2n)20Na reaction and separating fully stripped 20Na ions with energies of 170.01.5 MeV. A mylar degrader foil of thickness 854 m in front of the detector slowed the ions prior to implantation. As in the 8B runs, the beam was cycled (1.0 sec on/1.0 sec off). An average implantation rate of 7 20Na ions/min was achieved, and over one day 1.0104 decays were observed. The raw energy spectra from the 8B and 20Na runs are displayed in Fig. 3.
The integrated incident flux on the Si detector, monitored by the spectrograph focal plane detector, was an order of magnitude below threshold for detector damage ORT , and no gain variation from damage was expected. The gain was monitored with the centroid of the 8B spectrum and was found to fluctuate within 0.25%, corresponding to 7 keV at the spectrum peak. The fluctuations are about two times larger than the statistics. External particle sources were not reliable for monitoring gain shifts because of the accretion of residual gas onto the cooled Si detector, degrading the particle energies by 10-20 keV over the course of the seven day run. The accreted gas was not sufficient to appreciably degrade the 8B and 20Na beams incident on the detector, and did not affect implantation depth.
The electrostatic sweeper used to stop the beam was not perfectly efficient, allowing a weak beam during the counting cycles. Protons with energies near 8.7 MeV, produced in reactions from the primary beams, had the right rigidity to traverse the spectrograph and hit the Si detector. The 8.7 MeV protons passed through the Si detector and into the detector, producing a peak near 800 keV in the coincidence data. These protons were rejected based on the large pulses observed in the detector, which were much larger than the pulses from minimum ionizing positrons. Any ions heavier than protons with the proper rigidity to reach the Si detector were stopped Ziegler and rejected by the coincidence requirement.
The analysis provided here is slightly improved over Ref. Winter et al. (2003). Proton events were removed by cuts, as noted above. Random coincidences were removed with cuts on the time spectrum recorded between the detector start and Si detector stop signal. Additional cuts on the time spectrum eliminated a small amount of background from external decay activity.

II.2 Experimental Uncertainties
The largest sources of experimental uncertainties in the spectrum measurement, affecting the 8B neutrino spectrum, are: (1) The temporal gain variation observed over the seven days of data collection. (2) The uncertainty in correcting the energy deposited by positrons, which includes the uncertainty in implantation depth of the 8B and 20Na ions. (3) The uncertainty in the energy scale calibration.
As noted, the nonstatistical gain variation over the seven day run was of magnitude 0.25% which corresponds to a 7 keV uncertainty at the peak of the spectrum. A gain correction was not applied, instead an uncertainty is included in the energy scale. This is the dominant source of uncertainty in the measurement.
The depth and distribution of the implanted ions was estimated using the TRIM Monte Carlo simulation Ziegler . The uncertainty is taken as 4.6%, the average deviation of TRIM estimates from measured stopping power Ziegler . For 8B ions of incident energy 27.30.2 MeV, TRIM predicts an average implantation depth is 42.22.0 m. The full-width half maximum of the implantation depth is 0.7 m. For 20Na ions of energy 170.01.5 MeV, first passing through the mylar degrading foil of thickness 854 m, TRIM predicts an average implantation depth of 486 m for 20Na ions, with a full width half maximum of 1.3 m.
Uncertainties in ion implantation depth correspond to uncertainties in energy deposited by positrons. On average, minimum ionizing positrons deposit 0.6 keV/m in Si, so that in the case of 8B (20Na) the uncertainty in implantation depth corresponds to an energy uncertainty of 1.2 keV (3.6 keV).
The positron energy loss in the Si detector was estimated using the EGSnrc simulation EGS . Simulations account for detector geometry and positron energy spectra and assume the ranges of ion implantation depths discussed previously. Probability distributions for energy loss by positrons were obtained for the subset of data associated with a coincidence count in the detector, and for the total data set. The uncertainty associated with these simulations was estimated by comparing the total 8B data set to the coincidence data set. The effect of the positron correction lowered the -spectrum peak of the total data set by 55 keV, and the peak of the coincidence data set by 24 keV. After the correction, the peaks of the two data sets agreed to within 2 keV. The uncertainty associated with the simulation is thus assigned as 2 keV. The use of the total data set to estimate uncertainty in positron energy loss was not compromised by the beam leakage background, since beam particles with the proper rigidity to hit the detector had energies far from the 8B spectrum peak.
The average pulse height defect of the recoil 16O nuclei, which carry one fifth of the energy of the disintegrations following 20Na decay, has been directly measured for 16O nuclei in the energy range of interest Lennard et al. (1986). The correction is 40-50 keV for the various 20Na alpha lines, with an uncertainty of 5 keV. The TRIM Monte Carlo simulation Ziegler was used to model the ionization energy loss of 16O in silicon, and agreed within 2 keV with the average values of ionization loss observed in Lennard et al. (1986). We have applied the TRIM results, scaled by 2 keV to agree with the experimental results, to approximate the pulse height spectrum of 16O nuclei in a silicon detector.

The energy spectrum from the 20Na decay was used to calibrate the energy scale. The calibration lines were fit to the pulse height spectrum predicted by TRIM, convoluted with the positron energy loss distributions and a Gaussian component to approximate detector noise. The position and amplitude of the lines were free parameters, as well as the Gaussian width. Results of the fit to two of the lines, resulting from 20Na decays which led to energy releases of 2691.91.2 and 3099.02.2 keV, are shown in Fig. 4 for both the total and coincidence data sets.

Pulser tests performed before and during the data collection period indicate a negligible quadratic component in the relationship between pulse height and ADC bin, so the 20Na calibration was performed using a two parameter linear fit to the three dominant lines along with the zero energy ADC channel precisely determined by pulser tests. The external 228Th source emitted particles at six distinct energies, 5.341, 5.423, 5.686, 6.288, 6.779, and 8.784 MeV Ajzenberg-Selove (1988) and was used to perform an independent calibration. Data used for the 228Th calibration was taken immediately after the detector was placed in vacuum and cooled, before an appreciable amount of residual gas condensed on the detector surface. The particle energies were corrected for energy loss in the source and the measured 274 g/cm2 detector dead layer. The magnitude of the corrections for the various lines was 31-38 keV, with a characteristic uncertainty of 4-5 keV. A comparison of the residuals from the two calibrations is shown in Fig. 5. The figure also shows the total uncertainty in the energy scale, dominated by the temporal gain variation.
III R-matrix Representation of the Alpha Spectrum
The many-level R-matrix formalism has previously been used to parametrize data from nuclear processes involving 8Be, in particular the alpha spectrum following 8B decay Barker (1969); Warburton (1986); Barker (1989); Ortiz et al. (2000); Bhattacharya and Adelberger (2002). The application of the R-matrix to decay is an approximation, and the physical significance of R-matrix fit parameters is not clear.
In principle, it is possible to deduce the 8B decay strength function directly from the measured spectrum without resorting to R-matrix formalism. The R-matrix approach, however, gives a good fit to the observed spectrum and provides a convenient method for propagating systematic uncertainties in the spectrum to the neutrino spectrum. Systematic uncertainties in the spectrum dominate the statistical uncertainties, justifying the representation of the data by a smooth function.
III.1 Energy Levels in 8Be
In the R-matrix approximation, the decay of 8B proceeds with varying strength through a region of interfering nuclear states in 8Be which immediately decay into particles. Each state is characterized by an excitation energy, , a reduced width, , and a decay strength quantified by Fermi and Gamow-Teller matrix elements, and .
As discussed in Sec. I, only 2+ states in 8Be are considered. A numerically accurate R-matrix fit to the observed spectrum requires the three 2+ states in 8Be shown in Fig. 1, as well as one phenomenological background state approximating the combined effect of all higher-lying 2+ states. It has been shown Warburton (1986); Bhattacharya and Adelberger (2002) that R-matrix fits using only these four states were sufficient to describe previous experimental data. We have repeated the analysis discussed in Ref. Warburton (1986), which explicitly included a greater number of 2+ states, and have verified that the four state R-matrix approximation is sufficient to describe the spectrum reported here.
The state labeled (j=1), with excitation energy near 3 MeV and width of about 1.5 MeV, is responsible for the peak of the observed spectrum. The excitation energy, , and reduced width, , are considered free fit parameters. Shell-model considerations Barker (1966) indicate no significant Fermi decay strength to this level, as discussed in Ref. McKeown et al. (1980) which reports measurements of the -- correlations in 8B and 8Li consistent with a pure Gamow-Teller decay. We take the Fermi decay strength to vanish, =0, while the Gamow-Teller matrix element, , is a free parameter.
The next two states (j=2,3) form a nearly degenerate doublet with excitation energies 16.626(3) and 16.922(3) MeV Ajzenberg-Selove (1988) which are well known to be almost maximally mixed in isospin. We describe the isospin mixing of the doublet using the standard formulation Barker (1969) and consider the energy eigenstates and in terms of the isospin eigenstates (T=0) and (T=1),
| (1) |
where and are mixing parameters with . Since decays from a T=1 state are forbidden, the parameters and may be approximated from the level widths,
| (2) |
An accurate R-matrix description of the alpha spectrum requires ,0. The energies, and , and reduced widths, and , of the doublet are well constrained by - scattering experiments Hinterberger et al. (1978) and are held constant.
The decomposition of the doublet into its component isospin eigenstates allows a simplified description of the Fermi and Gamow-Teller strengths. The T=0 state, , has a Gamow-Teller strength treated as a free parameter, . The T=1 state, , is the isospin analog of the 8B and 8Li ground states and is populated by Fermi decay with a strength given by the superallowed Fermi matrix element, =. The Gamow-Teller decay to the T=1 component, or Fermi decay to the T=0 component, may be nonzero due to isospin breaking but has been estimated to be negligible Cohen and Kurath (1965) in this context, as discussed in Ref. Warburton (1986). Hence we take =0 and =0. The matrix elements of the isospin eigenstates are then related to the matrix elements of the energy eigenstates by Eq. 1,
| (3) |
and
| (4) |
The background state labeled (j=4) has an excitation energy held fixed to a value near that used in recent works Ortiz et al. (2000); Bhattacharya and Adelberger (2002); Warburton (1986), =37.0. The parameter could be allowed to float, but the quality of the fit is very weakly dependent on its value. The reduced width, , and the Gamow-Teller matrix element, , are free parameters. The Fermi strength is taken to be negligible, =0.
III.2 Form of the R-matrix Function
The R-matrix approach gives a parametrization of the 8B decay strength function, indicating the probability that 8Be is populated at a given excitation energy, Ex. The function takes the form Barker (1969)
| (5) |
Here N is the total number of observed decays,
| (6) |
The lifetime of 8B, t1/2, is 7703 msec Ajzenberg-Selove (1988). The unitless integrated phase space available to the decay leptons, (Ex), including the Fermi function and “outer” radiative corrections, has been evaluated according to the parametrization given by Wilkinson and Macefield Wilkinson and Macefield (1974). The Fermi and Gamow-Teller matrix elements, a(Ex) and c(Ex), are parametrized by
| (7) |
and
| (8) |
The P(Ex) and S(Ex) are the penetrability and shift factor arising from the regular and irregular solutions of the Coulomb equation of L=2 particles, defined in Ref. Lane and Thomas (1958). As in previous works Warburton (1986); Ortiz et al. (2000); Bhattacharya and Adelberger (2002), we evaluate the Coulomb functions at matching radius rc=4.5 fm, and choose the boundary condition, B, to be S().
III.3 Application to Data Set

In cases where the 8B decays at rest, the recoil of the daughter 8Be nucleus will cause the total energy spectrum of the emitted particles to deviate from the decay strength function given in Eq. 5. For a given excitation energy of 8Be, the recoil energy distribution is exactly calculable and takes an average value of 7 keV at the most probable excitation energy near 3.0 MeV.
In addition to accounting for the 8Be recoil, the strength function (Eq. 5) must be convoluted with the probability distribution of energies deposited by the positron, discussed in Sec. II. The detector line shape, approximated as a Gaussian with width 25 keV, determined by fits to the 20Na data sets, was also included but had a negligible impact on the fit due to the large width of the spectrum.
| Parameter | Value |
|---|---|
| 3.043 MeV | |
| 16.626 MeV111These parameters were held constant during the fitting procedure. | |
| 16.922 MeV111These parameters were held constant during the fitting procedure. | |
| 37.0 MeV111These parameters were held constant during the fitting procedure. | |
| 1.087 MeV | |
| 10.96 keV111These parameters were held constant during the fitting procedure. | |
| 7.42 keV111These parameters were held constant during the fitting procedure. | |
| 5.619 MeV | |
| -0.1462 | |
| 2.423 | |
| -0.1320 | |
| 111These parameters were held constant during the fitting procedure. | |
| , , , | 0111These parameters were held constant during the fitting procedure. |
The spectrum data was fit using the log-likelihood minimization function Baker and Cousins (1984). The best fit gave /dof=3249.7/3376, indicating a satisfactory fit. The best fit parameters are given in Table 1, and the best fit is compared to the data in Fig. 6. The strength function is presented in numerical form in Table 2.
| Ex | dN/dEx | Ex | dN/dEx | Ex | dN/dEx | Ex | dN/dEx | Ex | dN/dEx | Ex | dN/dEx | Ex | dN/dEx | Ex | dN/dEx |
|---|---|---|---|---|---|---|---|---|---|---|---|---|---|---|---|
| 0.00 | 0.000 | 1.90 | 67.991 | 2.60 | 362.922 | 3.06 | 462.243 | 3.52 | 315.256 | 4.70 | 117.714 | 8.00 | 24.113 | 12.60 | 2.349 |
| 0.10 | 0.000 | 1.95 | 78.048 | 2.62 | 374.309 | 3.08 | 457.936 | 3.54 | 309.037 | 4.80 | 110.362 | 8.20 | 22.147 | 12.80 | 2.054 |
| 0.20 | 0.004 | 2.00 | 89.464 | 2.64 | 385.390 | 3.10 | 453.156 | 3.56 | 302.941 | 4.90 | 103.693 | 8.40 | 20.333 | 13.00 | 1.788 |
| 0.30 | 0.024 | 2.05 | 102.397 | 2.66 | 396.095 | 3.12 | 447.953 | 3.58 | 296.971 | 5.00 | 97.622 | 8.60 | 18.655 | 13.20 | 1.548 |
| 0.40 | 0.081 | 2.10 | 117.004 | 2.68 | 406.353 | 3.14 | 442.380 | 3.60 | 291.129 | 5.10 | 92.074 | 8.80 | 17.103 | 13.40 | 1.333 |
| 0.50 | 0.207 | 2.15 | 133.440 | 2.70 | 416.096 | 3.16 | 436.485 | 3.62 | 285.417 | 5.20 | 86.986 | 9.00 | 15.667 | 13.60 | 1.141 |
| 0.60 | 0.440 | 2.20 | 151.844 | 2.72 | 425.257 | 3.18 | 430.314 | 3.64 | 279.834 | 5.30 | 82.305 | 9.20 | 14.334 | 13.80 | 0.970 |
| 0.70 | 0.832 | 2.25 | 172.320 | 2.74 | 433.776 | 3.20 | 423.911 | 3.66 | 274.380 | 5.40 | 77.984 | 9.40 | 13.100 | 14.00 | 0.818 |
| 0.80 | 1.443 | 2.30 | 194.916 | 2.76 | 441.597 | 3.22 | 417.319 | 3.68 | 269.056 | 5.50 | 73.984 | 9.60 | 11.956 | 14.20 | 0.685 |
| 0.90 | 2.348 | 2.32 | 204.543 | 2.78 | 448.671 | 3.24 | 410.576 | 3.70 | 263.859 | 5.60 | 70.270 | 9.80 | 10.896 | 14.40 | 0.568 |
| 1.00 | 3.640 | 2.34 | 214.498 | 2.80 | 454.958 | 3.26 | 403.717 | 3.72 | 258.789 | 5.70 | 66.814 | 10.00 | 9.915 | 14.60 | 0.466 |
| 1.10 | 5.435 | 2.36 | 224.770 | 2.82 | 460.423 | 3.28 | 396.777 | 3.74 | 253.845 | 5.80 | 63.588 | 10.20 | 9.006 | 14.80 | 0.378 |
| 1.20 | 7.878 | 2.38 | 235.344 | 2.84 | 465.045 | 3.30 | 389.783 | 3.76 | 249.024 | 5.90 | 60.572 | 10.40 | 8.166 | 15.00 | 0.302 |
| 1.30 | 11.155 | 2.40 | 246.203 | 2.86 | 468.808 | 3.32 | 382.763 | 3.78 | 244.323 | 6.00 | 57.744 | 10.60 | 7.389 | 15.20 | 0.238 |
| 1.40 | 15.507 | 2.42 | 257.323 | 2.88 | 471.708 | 3.34 | 375.742 | 3.80 | 239.742 | 6.20 | 52.589 | 10.80 | 6.672 | 15.40 | 0.185 |
| 1.50 | 21.242 | 2.44 | 268.676 | 2.90 | 473.750 | 3.36 | 368.740 | 3.90 | 218.531 | 6.40 | 48.008 | 11.00 | 6.011 | 15.60 | 0.140 |
| 1.55 | 24.750 | 2.46 | 280.230 | 2.92 | 474.946 | 3.38 | 361.778 | 4.00 | 199.905 | 6.60 | 43.909 | 11.20 | 5.402 | 15.80 | 0.104 |
| 1.60 | 28.761 | 2.48 | 291.947 | 2.94 | 475.318 | 3.40 | 354.870 | 4.10 | 183.532 | 6.80 | 40.221 | 11.40 | 4.842 | 16.00 | 0.076 |
| 1.65 | 33.347 | 2.50 | 303.785 | 2.96 | 474.895 | 3.42 | 348.031 | 4.20 | 169.102 | 7.00 | 36.886 | 11.60 | 4.328 | 16.20 | 0.056 |
| 1.70 | 38.584 | 2.52 | 315.694 | 2.98 | 473.712 | 3.44 | 341.275 | 4.30 | 156.340 | 7.20 | 33.856 | 11.80 | 3.857 | 16.40 | 0.044 |
| 1.75 | 44.561 | 2.54 | 327.623 | 3.00 | 471.809 | 3.46 | 334.611 | 4.40 | 145.009 | 7.40 | 31.093 | 12.00 | 3.426 | 16.60 | 0.097 |
| 1.80 | 51.378 | 2.56 | 339.512 | 3.02 | 469.230 | 3.48 | 328.049 | 4.50 | 134.904 | 7.60 | 28.566 | 12.20 | 3.033 | 16.80 | 0.001 |
| 1.85 | 59.146 | 2.58 | 351.300 | 3.04 | 466.025 | 3.50 | 321.595 | 4.60 | 125.854 | 7.80 | 26.246 | 12.40 | 2.674 | 17.00 | 0.000 |
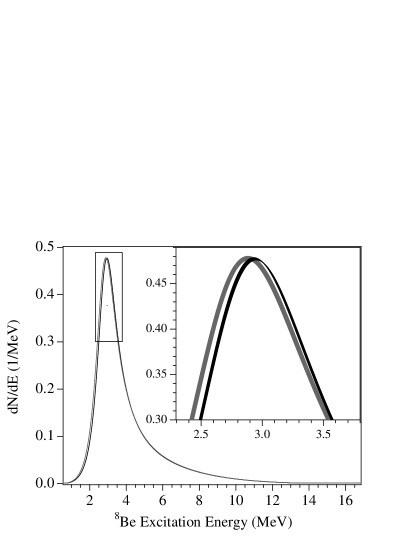
The strength function reported here disagrees with the result of Ortiz et al. Ortiz et al. (2000). For both measurements, the uncertainty in the inferred neutrino spectrum is dominated by systematic effects. Smooth R-matrix fits to the alpha spectra thus provide a convenient way to compare the two results. Fig. 7 shows a comparison of the present results and a fit to the data of Ortiz et al. Ortiz et al. (2000). Uncertainties in the Ortiz et al. curve are taken directly from Ref. Ortiz et al. (2000).
III.4 Propagation of Systematic Uncertainties
The R-matrix approach was used to propagate the systematic uncertainties in the spectrum measurement to the neutrino spectrum. As discussed in Sec. II, the 1 uncertainty in the energy scale is characterized by a multiplicative factor of 1(0.275%), corresponding to about 8 keV at the spectrum peak, added in quadrature with a constant offset of 3 keV. R-matrix fits were performed to the spectrum using the 1 energy scales, and the resulting 1 strength functions were used to produce 1 neutrino spectra.
An additional uncertainty was imposed to account for the rapid drop off of the spectrum at low energies, where statistics are not sufficient to determine the spectrum shape. The penetrability factor, P(Ex), is responsible for the drop off. The best R-matrix fit used P(Ex) calculated for a matching radius of 4.5 fm. We approximate the uncertainty at low energies by calculating P(Ex) at 4.0 and 5.0 fm, the 1 matching radii recommended in Ref. Warburton (1986), and perform fits under these conditions. There is a strong dependence Warburton (1986) between the energy of the background state, and matching radius, rc, so the parameter was allowed to float for these fits. We note that the variation of matching radius is a significant source of uncertainty only for neutrinos at very high (E15 MeV) and low (E0.5 MeV) energies.
IV Recoil Order Corrections to the Neutrino Spectrum
IV.1 Background
A proper description of 8B decay includes recoil order effects which cause, for example, the energy spectra and angular correlations of decay particles to deviate from the allowed approximation. Deviations are of order E0/mn, where E0 is the positron endpoint energy and mn is the nucleon mass. The 8B decay has a particularly large endpoint energy (most probable E13 MeV) and a small Gamow-Teller strength (log ft = 5.6) for an allowed decay. Recoil order effects in 8B are thus large compared to other nuclear systems.
Measurements of the radiative decay of the 8B isospin analog state in 8Be Nathan et al. (1975); Paul et al. (1977); Bowles and Garvey (1978); DeBraeckeleer et al. (1995), and of the angular correlation between and particles emitted in the decays of 8B and 8Li Tribble and Garvey (1974, 1975); McKeown et al. (1980), determine the recoil order matrix elements. These results were first explicitly applied to the neutrino spectrum in Bahcall and Holstein (1986); Napolitano et al. (1987), where they were found to contribute at the 5% level. A more recent determination of the neutrino spectrum by Bahcall et al. Bahcall et al. (1996) employed the same recoil order treatment as in Ref. Bahcall and Holstein (1986). Bahcall et al. provided a conservative estimate of the uncertainty associated with the recoil order correction on the neutrino spectrum by setting the 3 uncertainty equal to size of the correction itself. A more recent determination of the neutrino spectrum by Ortiz et al. Ortiz et al. (2000), applied recoil order corrections very similar to those in Ref. Bahcall and Holstein (1986).
The two most recent spectrum measurements, by Ortiz et al. Ortiz et al. (2000) and the one reported here, involved determinations of the energy scale significantly more precise than the measurements used by Bahcall et al. Bahcall et al. (1996). Also, a recent precision measurement of radiative decay in 8Be DeBraeckeleer et al. (1995) provides additional information on recoil order effects, but has not yet been applied to the 8B neutrino spectrum. In light of these recent experiments, recoil order effects are considered here with careful attention to the assignment of realistic uncertainties.
The Fermi matrix element plays a small role in the decay of 8B, contributing only to decays proceeding through the highest excitation energies in 8Be, as explicitly discussed in Ref. Warburton (1986). These low energy decays have suppressed recoil order corrections, and produce neutrinos which have no impact on solar neutrino experiments. Consideration of the Fermi matrix element is thus omitted.
A model independent treatment of recoil order effects is given by Holstein Holstein (1974), whose notation we adopt here. Matrix elements contributing to the decays of 8B and 8Li are denoted by (Gamow-Teller), (weak magnetism), (induced tensor), , (vector second-forbidden), , (axial second-forbidden), and (induced pseudoscalar). Since the decays proceed to the broad continuum in 8Be, the matrix elements should be considered as functions of the 8Be excitation energy, Ex. Previous determinations of the 8B neutrino spectrum Bahcall and Holstein (1986); Napolitano et al. (1987); Bahcall et al. (1996); Ortiz et al. (2000) neglected this energy dependence.
IV.2 Beta and Neutrino Energy Spectra
The positron energy spectrum from an allowed decay proceeding between two energetically sharp nuclear states is given by
| (9) |
Here pβ and Eβ are the momentum and total energy of the positron, and E0 is the positron endpoint energy. F(-Z,Eβ) is the Fermi function, which depends on the charge, Z, of the daughter nucleus and is negative for positron decays. The radiative corrections are contained in R(Eβ,E0), which will be discussed in Sec. V. The recoil order effects are contained in C(Eβ,E0), which has the form
| (10) |
where A=8 is the mass number. In the case of 8B the recoil order matrix elements are dependent on the 8Be excitation energy Ex (Ex=-E0), where =17.468 MeV is the total energy released in the 8B - decay chain. (This discussion of positron and neutrino energy spectra ignores, for the sake of simplicity, the kinetic recoil of the daughter nucleus. This effect is included in the numerical calculations.) The positron spectrum is calculated by integrating Eq. 9 over all excitation energies in 8Be, weighted by the strength function determined in Sec. III. The neutrino spectrum is obtained by the simple substitution Eν=E0-Eβ, and the application of different radiative corrections, discussed in Sec. V.
IV.3 Radiative Decay Measurements in 8Be
The weak magnetism matrix element, , exerts the greatest influence on the neutrino energy spectrum. Its value is best determined under the strong conserved vector current (CVC) hypothesis by measurements of the radiative decays of the 8B isospin analog state in 8Be which, as discussed in Sec. III, is mixed between the two states of an energy doublet. The radiative decay is shown schematically in Fig. 1.
In previous experiments Nathan et al. (1975); Paul et al. (1977); Bowles and Garvey (1978); DeBraeckeleer et al. (1995), a 4He beam was directed at a 4He gas cell to excite the doublet in 8Be. The 4He(4He,)8Be cross section was measured as a function of beam energy and angle of emission of the ray. These measurements determine the widths of the isovector M1 and E2 transitions, and =/, as well as the widths of the isoscalar transitions, =/ and =/. The radiative widths are considered as functions of Ex.
CVC relates the isovector radiative widths in 8Be to the vector recoil matrix elements contributing to 8B decay, , , and ,
| (11) |
| (12) |
| (13) |
The isoscalar radiative widths are not related to decay from factors by CVC.
| Observable | Experiment | Value |
|---|---|---|
| Ref. Nathan et al. (1975) (1975) | 0.0450.027 | |
| Ref. Bowles and Garvey (1978) (1978) | 0.140.03111These values are based on a reanalysis of the original data, performed in Ref. DeBraeckeleer et al. (1995). The original analysis contained an error in the kinematic treatment of the decay photon. See Ref. DeBraeckeleer et al. (1995) for details. | |
| Ref. DeBraeckeleer et al. (1995) (1995) | 0.010.03 | |
| Ref. Bowles and Garvey (1978) (1978) | 0.260.03111These values are based on a reanalysis of the original data, performed in Ref. DeBraeckeleer et al. (1995). The original analysis contained an error in the kinematic treatment of the decay photon. See Ref. DeBraeckeleer et al. (1995) for details. | |
| Ref. DeBraeckeleer et al. (1995) (1995) | 0.220.04 | |
| Ref. Bowles and Garvey (1978) (1978) | 0.000.03111These values are based on a reanalysis of the original data, performed in Ref. DeBraeckeleer et al. (1995). The original analysis contained an error in the kinematic treatment of the decay photon. See Ref. DeBraeckeleer et al. (1995) for details. | |
| Ref. DeBraeckeleer et al. (1995) (1995) | 0.040.02 | |
| Ref. Paul et al. (1977) (1977) | 4.10.6 eV222The values for M1 width are based on a reanalysis of the original data, performed in Ref. DeBraeckeleer et al. (1995), using the values of and obtained experimentally in Ref. DeBraeckeleer et al. (1995). | |
| Ref. Bowles and Garvey (1978) (1978) | 3.60.3 eV222The values for M1 width are based on a reanalysis of the original data, performed in Ref. DeBraeckeleer et al. (1995), using the values of and obtained experimentally in Ref. DeBraeckeleer et al. (1995). | |
| Ref. DeBraeckeleer et al. (1995) (1996) | 2.800.18 eV |
A summary of the experimental results is given in Table 3. The experimental results for the isoscalar contributions to the decay, and , agree with each other and are of the same order as various shell model predictions compiled in Ref. DeBraeckeleer et al. (1995). The experimental values for from two of the experiments Nathan et al. (1975); DeBraeckeleer et al. (1995) are in agreement, but differ from the results in Bowles and Garvey (1978) by about 3. The present work will use the more recent value of DeBraeckeleer et al. (1995) which indicates a negligible second-forbidden contribution to the decay, in agreement with shell model predictions. The early experimental determinations of Paul et al. (1977); Bowles and Garvey (1978) disagree with the recent and most precise result DeBraeckeleer et al. (1995) by about 2. The recent result DeBraeckeleer et al. (1995) is in best agreement with - angular correlation experiments, as will be discussed later, and is adopted in this work.

The matrix elements (Ex) and (Ex) have different functional dependences. This was first observed Nathan et al. (1975); Bowles and Garvey (1978) through a comparison of the shapes of the final state distributions in 8Be following the and decays. The form of (Ex) was later described DeBraeckeleer et al. (1995) using the R-matrix approach, which parametrized (Ex) as an interfering sum of three different matrix elements, , to the three 2+ levels in 8B shown in Fig. 1,
| (14) |
The notations used here are identical to those in Sec. III. We use the parameters reported in Ref. DeBraeckeleer et al. (1995) to determine (Ex). The form of (Ex) was given in Eq. 8, and determined by fits to the spectrum. We note that the R-matrix parameters appearing in both Eqs. 8 and 14 may take different values in the two expressions. The forms of (Ex) and (Ex) are shown in Fig. 8.
IV.4 - Angular Correlations
The - angular correlations in the mirror decays of 8Li and 8B have been measured several times as a function of particle energy Tribble and Garvey (1974, 1975); McKeown et al. (1980). Such measurements constrain the weak magnetism matrix element, , as well as the induced tensor, . The angular correlations take the form
| (15) |
where the -(+) subscript refers to the 8Li(8B) decay, is the angle between the and particles, and the factor v/c for the particle has been set equal to 1. The a∓ coefficients are dominated by kinematic considerations, while the p∓ coefficients are strongly dependent on recoil order contributions,
| (16) |
where =17.468 MeV is the total energy released in the 8B - decay chain.
Assuming isospin symmetry, taking the sum and difference of p- and p+ produces cancellation between many of the mirror matrix elements of the 8B and 8Li decays. Corrections due to isospin breaking will be considered later. Defining = pp+, dropping the vector matrix elements and , integrating over excitation energy Ex gives as a function of particle energy,
| (17) |
| (18) |
where the second class contribution to the induced tensor has been omitted. This is consistent with existing data in the A=8 nuclear system DeBraeckeleer et al. (1995), and with theoretical models which predict a second class current to contribute at a level below the current experimental sensitivity.
The matrix elements (Ex) and (Ex), determined previously, were applied to Eq. 17 to predict the observed in - angular correlation measurements Tribble and Garvey (1974, 1975); McKeown et al. (1980). The predictions are compared to the experimental data graphically in Fig. 9.

The level of agreement between the Eq. 17 prediction, based on the radiative decay and alpha spectrum data, and the - data sets was quantified by allowing the magnitude of to float by a multiplicative constant, , in Eq. 17. The experimental data from the - correlation measurements was then used to determine the best fit value of . A value of different than unity would indicate a disagreement between the radiative width data and the - angular correlation data. This approach was previously applied McKeown et al. (1980); Bowles and Garvey (1978); Nathan et al. (1975); DeBraeckeleer et al. (1995) with the motivation of testing CVC and searching for second-class currents. Here, the validity of CVC and the absence of second-class currents are assumed, and the test is performed to gauge the level of agreement between the two types of recoil order measurements.
The best fit to the angular correlation data from Ref. Tribble and Garvey (1975) gave =1.06(4) with /dof=7.7/8. The best fit to the data from Ref. McKeown et al. (1980) gave =0.99(3) with /dof=24.8/15, where the large value may be the result of the large point-to-point scatter of the data. The uncertainties in the data from Ref. McKeown et al. (1980) were expanded by to account for this effect, and both data sets were fit simultaneously, yielding =1.014(26) with /dof=24.6/24. The values of obtained, consistent with unity, indicate agreement between the radiative width measurement DeBraeckeleer et al. (1995) and the - angular correlation measurements Tribble and Garvey (1975); McKeown et al. (1980), and provide confidence in the extracted weak magnetism matrix element.
The experimental (Eβ) data is sensitive to the induced tensor matrix element, . The effect of on the neutrino spectrum is much milder than that of . The energy dependences of (Ex) and (Ex) were inferred directly from and spectrum measurements, respectively, but for (Ex) there is no such experimental signal. The determination of the induced tensor is further complicated by the presence of the axial second-forbidden terms, and , which appear in the expression for , Eq. 18. Fortunately, the influence of on the neutrino spectrum is sufficiently small that very conservative estimates of uncertainty may be imposed on without significantly inflating the total uncertainty of recoil order corrections.
The particle asymmetry from a polarized source of 8Li or 8B is also sensitive to and , and would complement - correlation measurements to allow a more precise determination of the second-forbidden terms. One measurement of the asymmetry has been performed in 8Li Hall et al. (1988), but was systematically skewed by particle scattering and required a sizable phenomenological correction. We do not include the asymmetry measurement in our analysis, but note that future measurements of this type would be helpful in constraining the values of and .
Several models Barker (1966); Boyarkina (1964); Cohen and Kurath (1965) have been employed to estimate the magnitude of the axial second-forbidden terms. The models predict contributions to from and which are comparable to the contributions from the induced tensor, . It has been pointed out Kubodera et al. (1973) that mesonic exchange effects may be significant in A=8 -decays, especially at the second-forbidden level, and that shell model calculations may break down.
To determine of the best value of from the data, second-forbidden contributions are neglected and will be assumed to take the same functional form as the Gamow-Teller matrix element, . The possibility of large second-forbidden contributions to , with magnitude given by the shell model predictions, will then be considered and their effect on the extracted value of will be assigned as an uncertainty. The uncertainty associated with the ambiguity in the functional form of will be estimated by fitting the data with the assumption that takes the same form as the weak magnetism operator, .
Utilizing the above assumptions, and are set equal to zero, is considered to have the same form as , , and Eq. 18 is used to fit the data, with as the only parameter. The best fit to the data from Ref. Tribble and Garvey (1975) gives =10.3(2.3) with /dof=2.7/8. The best fit to the data from Ref. McKeown et al. (1980) gives =10.6(1.4) with /dof=12.2/15. Fitting both data sets simultaneously gives =10.5(1.2) with /dof=15.0/24. The results of the fits are compared to the data in Fig. 10.

IV.5 Recoil Order Effects on the Neutrino Spectrum
The values and uncertainties of the weak magnetism, , and induced tensor, , matrix elements have been deduced from experimental data. A further uncertainty is applied to these values due to imperfect isospin symmetry and electromagnetic effects. The effect of isospin breaking is estimated by comparing the Gamow-Teller matrix elements of the 8B and 8Li mirror decays. Previous comparisons of experimental spectrum following 8B and 8Li decays indicate cLi/c1.07 Warburton (1986); Bhattacharya and Adelberger (2002). As seen from Eqs. 17 and 18, this uncertainty propagates linearly to the extracted values of and . We thus assign to (Ex) and (Ex) a further 7% uncertainty, added in quadrature with previously stated uncertainties. Further electromagnetic effects, such as the difference in decay energies of 8Li and 8B and final state electromagnetic interactions, are discussed in Ref. McKeown et al. (1980) and are proportional to the second forbidden axial terms, and . These effects contribute up to 4%, when the largest shell model values for and are assumed. We thus add, in quadrature, a further 4% uncertainty to (Ex) and (Ex).
Fig. 11 shows the ratio of (Ex) to (Ex) over the range of allowed excitation energies in 8Be. At high excitation energies, (Ex) increases rapidly while (Ex) decreases, as can be seen in Fig. 8. In terms of the R-matrix approach, this is explained by comparing the Gamow-Teller strength of the high-lying doublet to the strength of the first excited state at 3.0 MeV, /=-11.8(8). For the weak magnetism transition, the ratio is much smaller, /=1.4(1.6) DeBraeckeleer et al. (1995), and the doublet transition strength plays a smaller role. At excitation energies above 3.0 MeV, the result is a constructive interference of the and the terms for (Ex). Conversely, for excitation energies below 3 MeV, the terms interfere destructively, causing (Ex) to drop off more rapidly than (Ex) and increasing the ratio (Ex)/(Ex).

The induced pseudoscalar matrix element may be estimated by applying the partially conserved axial current hypothesis, which indicates
| (19) |
The induced pseudoscalar appears only in the last term of 10 which is suppressed by a factor m/M2. The induced pseudoscalar contribution to the and neutrino energy spectra is thus of order m/m, and is ignored.
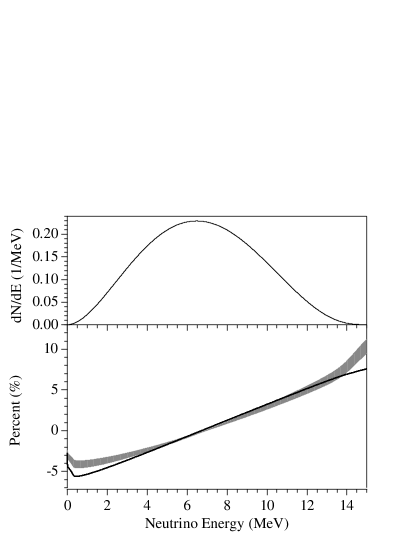
The magnitude of recoil order effects on the 8B neutrino spectrum determined by the present treatment is compared to the previous treatment Bahcall and Holstein (1986) in Fig. 12.
V Determination of the 8B Neutrino and Positron Spectra
Radiative corrections to nuclear decay were first explicitly formulated in Sirlin (1967), and are exact to O(), where is the electromagnetic fine structure constant. Further corrections, dependent on the structure of the nucleus, occur at the O(ln) level. These model dependent corrections are insignificant when compared to the experimental uncertainties in the neutrino spectrum and are not included. Radiative corrections for the case where the neutrino is detected while the positron remains unobserved were calculated explicitly in Ref. Batkin and Sundaresan (1995), and affect the 8B neutrino spectrum at the level of 1%.

The decay strength function determined in Sec. III was applied, using Eq. 10, to determine the positron and neutrino spectra of 8B.
The deduced positron spectrum was compared to the experimental spectrum Napolitano et al. (1987), and a one parameter fit to determine the amplitude gave an agreement of /dof=33.1/31, where only statistical uncertainties were included in the minimization function. The agreement is shown in Fig. 13. The deduced positron spectrum was then allowed to float by an energy offset and marginal improvement (/dof=32.6/31) was found for an offset of -1420 keV. We note that the values quoted here are slightly different than those in Ref. Winter et al. (2003) due to the improved treatment of recoil order effects. The calibration uncertainty of the positron measurement is reported as 25 keV Bahcall et al. (1996), and is not included in the fits.
The neutrino spectrum is presented numerically, with uncertainties, in Table 4.
| Eν | P | P | Eν | P | P | Eν | P | P | Eν | P | P | Eν | P | P |
|---|---|---|---|---|---|---|---|---|---|---|---|---|---|---|
| 0.10 | 0.214 | 0.020 | 3.20 | 77.526 | 0.299 | 6.30 | 130.963 | 0.091 | 9.40 | 92.857 | -0.244 | 12.50 | 19.735 | -0.165 |
| 0.20 | 0.763 | 0.043 | 3.30 | 80.456 | 0.301 | 6.40 | 131.101 | 0.074 | 9.50 | 90.528 | -0.248 | 12.60 | 17.963 | -0.157 |
| 0.30 | 1.513 | 0.013 | 3.40 | 83.337 | 0.301 | 6.50 | 131.134 | 0.057 | 9.60 | 88.161 | -0.252 | 12.70 | 16.266 | -0.149 |
| 0.40 | 2.507 | 0.021 | 3.50 | 86.164 | 0.302 | 6.60 | 131.063 | 0.040 | 9.70 | 85.759 | -0.255 | 12.80 | 14.647 | -0.140 |
| 0.50 | 3.763 | 0.031 | 3.60 | 88.931 | 0.301 | 6.70 | 130.888 | 0.023 | 9.80 | 83.328 | -0.258 | 12.90 | 13.110 | -0.132 |
| 0.60 | 5.239 | 0.041 | 3.70 | 91.635 | 0.300 | 6.80 | 130.611 | 0.007 | 9.90 | 80.869 | -0.261 | 13.00 | 11.655 | -0.123 |
| 0.70 | 6.914 | 0.053 | 3.80 | 94.272 | 0.298 | 6.90 | 130.232 | -0.010 | 10.00 | 78.387 | -0.263 | 13.10 | 10.286 | -0.115 |
| 0.80 | 8.772 | 0.065 | 3.90 | 96.839 | 0.296 | 7.00 | 129.752 | -0.027 | 10.10 | 75.885 | -0.264 | 13.20 | 9.005 | -0.106 |
| 0.90 | 10.798 | 0.077 | 4.00 | 99.331 | 0.292 | 7.10 | 129.174 | -0.039 | 10.20 | 73.368 | -0.265 | 13.30 | 7.813 | -0.097 |
| 1.00 | 12.976 | 0.091 | 4.10 | 101.746 | 0.288 | 7.20 | 128.497 | -0.051 | 10.30 | 70.837 | -0.265 | 13.40 | 6.712 | -0.088 |
| 1.10 | 15.292 | 0.104 | 4.20 | 104.081 | 0.284 | 7.30 | 127.724 | -0.063 | 10.40 | 68.298 | -0.265 | 13.50 | 5.703 | -0.080 |
| 1.20 | 17.735 | 0.118 | 4.30 | 106.332 | 0.278 | 7.40 | 126.856 | -0.075 | 10.50 | 65.754 | -0.264 | 13.60 | 4.787 | -0.071 |
| 1.30 | 20.292 | 0.132 | 4.40 | 108.497 | 0.273 | 7.50 | 125.895 | -0.087 | 10.60 | 63.209 | -0.263 | 13.70 | 3.965 | -0.062 |
| 1.40 | 22.950 | 0.145 | 4.50 | 110.574 | 0.266 | 7.60 | 124.843 | -0.097 | 10.70 | 60.667 | -0.262 | 13.80 | 3.237 | -0.054 |
| 1.50 | 25.699 | 0.158 | 4.60 | 112.560 | 0.259 | 7.70 | 123.701 | -0.108 | 10.80 | 58.131 | -0.259 | 13.90 | 2.602 | -0.046 |
| 1.60 | 28.528 | 0.172 | 4.70 | 114.452 | 0.252 | 7.80 | 122.471 | -0.118 | 10.90 | 55.606 | -0.257 | 14.00 | 2.058 | -0.038 |
| 1.70 | 31.427 | 0.184 | 4.80 | 116.250 | 0.244 | 7.90 | 121.156 | -0.128 | 11.00 | 53.095 | -0.254 | 14.10 | 1.602 | -0.031 |
| 1.80 | 34.386 | 0.197 | 4.90 | 117.951 | 0.236 | 8.00 | 119.758 | -0.138 | 11.10 | 50.602 | -0.251 | 14.20 | 1.228 | -0.024 |
| 1.90 | 37.395 | 0.208 | 5.00 | 119.553 | 0.227 | 8.10 | 118.278 | -0.148 | 11.20 | 48.131 | -0.247 | 14.30 | 0.929 | -0.019 |
| 2.00 | 40.447 | 0.219 | 5.10 | 121.056 | 0.218 | 8.20 | 116.720 | -0.158 | 11.30 | 45.686 | -0.242 | 14.40 | 0.694 | -0.014 |
| 2.10 | 43.531 | 0.230 | 5.20 | 122.457 | 0.209 | 8.30 | 115.086 | -0.166 | 11.40 | 43.271 | -0.238 | 14.50 | 0.513 | -0.011 |
| 2.20 | 46.640 | 0.240 | 5.30 | 123.755 | 0.199 | 8.40 | 113.378 | -0.175 | 11.50 | 40.889 | -0.233 | 14.60 | 0.376 | -0.008 |
| 2.30 | 49.767 | 0.249 | 5.40 | 124.951 | 0.189 | 8.50 | 111.599 | -0.185 | 11.60 | 38.545 | -0.227 | 14.70 | 0.273 | -0.006 |
| 2.40 | 52.903 | 0.258 | 5.50 | 126.042 | 0.179 | 8.60 | 109.751 | -0.193 | 11.70 | 36.242 | -0.222 | 14.80 | 0.196 | -0.004 |
| 2.50 | 56.041 | 0.266 | 5.60 | 127.028 | 0.168 | 8.70 | 107.838 | -0.200 | 11.80 | 33.984 | -0.215 | 14.90 | 0.140 | -0.003 |
| 2.60 | 59.174 | 0.273 | 5.70 | 127.909 | 0.157 | 8.80 | 105.862 | -0.208 | 11.90 | 31.774 | -0.209 | 15.00 | 0.099 | -0.002 |
| 2.70 | 62.296 | 0.279 | 5.80 | 128.683 | 0.146 | 8.90 | 103.827 | -0.215 | 12.00 | 29.616 | -0.202 | 15.10 | 0.069 | -0.002 |
| 2.80 | 65.401 | 0.285 | 5.90 | 129.351 | 0.135 | 9.00 | 101.734 | -0.222 | 12.10 | 27.515 | -0.195 | 15.20 | 0.047 | -0.001 |
| 2.90 | 68.482 | 0.289 | 6.00 | 129.914 | 0.124 | 9.10 | 99.587 | -0.228 | 12.20 | 25.472 | -0.188 | 15.30 | 0.000 | 0.000 |
| 3.00 | 71.533 | 0.293 | 6.10 | 130.369 | 0.113 | 9.20 | 97.390 | -0.234 | 12.30 | 23.493 | -0.181 | 15.40 | 0.000 | 0.000 |
| 3.10 | 74.549 | 0.296 | 6.20 | 130.719 | 0.102 | 9.30 | 95.146 | -0.239 | 12.40 | 21.579 | -0.173 | 15.50 | 0.000 | 0.000 |
VI Conclusions
An accurate determination of the 8B neutrino spectrum is important for the proper analysis of solar neutrino data. Measurements of the energy spectrum following the 8B decay provide the most direct method of inferring the decay strength function, which is used to predict the neutrino spectrum. The spectrum experiment described in this work was designed to eliminate several of the systematic effects common to past measurements, and precisely determines the strength function characterized by the many level R-matrix approximation.
The primary uncertainty in the spectrum measurement arises from the determination of energy scale, which was dominated by the temporal gain shift over the seven day run. Uncertainties in calibration from the implanted 20Na source and the correction for positron energy loss in the detector also contribute. Uncertainty in the energy scale near the spectrum peak was 9 keV. The uncertainties in the spectrum were propagated to the neutrino spectrum using the R-matrix approach.
Recoil order effects provide a significant contribution to the 8B decay, and have been treated in this work using the best available experimental data. The results differ from the previous treatment Bahcall and Holstein (1986) which has been applied in recent determinations of the neutrino spectrum Bahcall and Holstein (1986); Napolitano et al. (1987); Bahcall et al. (1996); Ortiz et al. (2000).
The primary component of the recoil order corrections is the weak magnetism term, . Uncertainties in are due to experimental effects DeBraeckeleer et al. (1995) as well as isospin breaking and electromagnetic effects, and are included as uncertainties in the neutrino spectrum. Uncertainties in the neutrino spectrum from recoil order effects are roughly half as large as the uncertainties from the spectrum measurement.
The spectrum reported here is in substantial disagreement with the previous measurement of comparable precision Ortiz et al. (2000), but is in good agreement with the direct measurement of the positron spectrum Napolitano et al. (1987).
This work was supported by the Department of Energy under Contract Nos. W-31-109-ENG-38 and DE-AC03-76SF00098.
References
- Cleveland et al. (1998) B. T. Cleveland et al., Astophys. J. 496, 505 (1998), gives the final results of the Homestake experiment.
- Kamiokande collaboration et al. (1996) Y. F. Kamiokande collaboration et al., Phys. Rev. Lett. 77, 1683 (1996), gives the final results of the Kamiokande solar neutrino experiment.
- Super-Kamiokande collaboration et al. (2001) S. F. Super-Kamiokande collaboration et al., Phys. Rev. Lett. 86, 5651 (2001), gives the most recent results of the Super-Kamiokande solar neutrino experiment.
- The SNO collaboration et al. (2003) S. N. A. The SNO collaboration et al., Phys. Rev. Lett. 90, 25201 (2003), gives the most recent results from SNO.
- Maltoni et al. (2003) M. Maltoni, T. Schewtz, M. A. Tortolla, and J. W. F. Valle, Phys. Rev. D 68, 113010 (2003), offers a review of the interpretation of solar neutrino data, including the recent SNO data from The SNO collaboration et al. (2003), as well as data from the KamLAND experiment Kamiokande collaboration et al. (1996).
- Eguchi et al. (2003) K. Eguchi et al., Phys. Rev. Lett. 90, 021802 (2003).
- Winter et al. (2003) W. T. Winter, S. J. Freedman, K. E. Rehm, I. Ahmad, J. P. Greene, A. Heinz, D. Henderson, R. V. F. Janssens, C. L. Jiang, E. F. Moore, et al., Phys. Rev. Lett. 91, 252501 (2003).
- Ortiz et al. (2000) C. E. Ortiz, A. Garcia, R. A. Waltz, M. Bhattacharya, and A. K. Komives, Phys. Rev. Lett. 85, 2909 (2000), contains a description of the experiment and presents the results in graphical format. The numerical neutrino and alpha spectrum data is available in tabular form on the website www.nd.edu/ nsl/BeyondSM/boron8/tables. Details concerning the data analysis which are not explicitly discussed in the Letter are available in C. Ortiz, Ph.D. thesis, Notre Dame (2000).
- Napolitano et al. (1987) J. Napolitano, S. J. Freedman, and J. Camp, Phys. Rev. C 36, 298 (1987).
- Ajzenberg-Selove (1988) F. Ajzenberg-Selove, Nucl. Phys. A490, 1 (1988).
- Harss et al. (2000) B. Harss et al., Rev. Sc. Instrum. 71, 380 (2000).
- Rehm and Wolfs (1988) K. E. Rehm and F. L. H. Wolfs, Nucl. Inst. Meth. A 273, 262 (1988).
- (13) http://www.ortec-online.com/detectors/chargedparticle/introduction/radiation.htm.
- (14) J. F. Ziegler, http://www.srim.org.
- (15) http://www.irs.inms.nrc.ca/inms/irs/EGSnrc/EGSnrc.html.
- Lennard et al. (1986) W. N. Lennard et al., Nucl. Inst. Meth. A 248, 454 (1986).
- Barker (1969) F. C. Barker, Aust. Journ. Phys. 22, 293 (1969).
- Warburton (1986) E. K. Warburton, Phys. Rev. C 33, 303 (1986).
- Barker (1989) F. C. Barker, Aust. Jour. Phys. 42, 25 (1989).
- Bhattacharya and Adelberger (2002) M. Bhattacharya and E. G. Adelberger, Phys. Rev. C 65, 055502 (2002).
- Barker (1966) F. C. Barker, Nucl. Phys. 83, 418 (1966).
- McKeown et al. (1980) R. D. McKeown, G. T. Garvey, and C. A. Gagliardi, Phys. Rev. C 22, 738 (1980).
- Hinterberger et al. (1978) F. Hinterberger et al., Nucl. Phys. A299, 397 (1978).
- Cohen and Kurath (1965) S. Cohen and D. Kurath, Nucl. Phys. 73, 1 (1965).
- Wilkinson and Macefield (1974) D. H. Wilkinson and B. E. F. Macefield, Nucl. Phys. A232, 58 (1974).
- Lane and Thomas (1958) A. M. Lane and R. G. Thomas, Rev. Mod. Phys. 30, 257 (1958), offers a comprehensive review of the R-matrix theory.
- Baker and Cousins (1984) S. Baker and R. D. Cousins, Nucl. Inst. Meth. 221, 437 (1984).
- Nathan et al. (1975) A. M. Nathan, G. T. Garvey, P. Paul, and A. K. Warburton, Phys. Rev. Lett. 35, 1137 (1975).
- Paul et al. (1977) P. Paul, M. Suffert, and P. Gorodetzky, Phys. Lett. 71B, 71 (1977).
- Bowles and Garvey (1978) T. J. Bowles and G. T. Garvey, Phys. Rev. C 18, 1447 (1978).
- DeBraeckeleer et al. (1995) L. DeBraeckeleer et al., Phys. Rev. C 51, 2778 (1995).
- Tribble and Garvey (1974) R. E. Tribble and G. T. Garvey, Phys. Rev. Lett. 32, 314 (1974).
- Tribble and Garvey (1975) R. E. Tribble and G. T. Garvey, Phys. Rev. C 12, 967 (1975).
- Bahcall and Holstein (1986) J. N. Bahcall and B. R. Holstein, Phys. Rev. C 33, 2121 (1986).
- Bahcall et al. (1996) J. N. Bahcall, E. Lisi, D. E. Alburger, L. DeBraeckeleer, S. J. Freedman, and J. Napolitano, Phys. Rev. C 54, 411 (1996).
- Holstein (1974) B. R. Holstein, Rev. Mod. Phys. 46, 789 (1974).
- Hall et al. (1988) J. R. Hall, D. L. Clark, S. J. Freedman, and S. S. Hanna, Nucl. Phys. A483, 1 (1988).
- Boyarkina (1964) A. N. Boyarkina, Izv. Akad. Nauk USSR (ser. fiz.) 28, 327 (1964).
- Kubodera et al. (1973) K. Kubodera, J. Delorme, and M. Rho, Nucl. Phys. B66, 253 (1973).
- Sirlin (1967) A. Sirlin, Phys. Rev. Lett. 164, 1767 (1967).
- Batkin and Sundaresan (1995) I. S. Batkin and M. K. Sundaresan, Phys. Rev. D 52, 5362 (1995).