Energy dependence of elliptic flow over a large pseudorapidity range in Au+Au collisions at RHIC
Abstract
This paper describes the measurement of the energy dependence of elliptic flow for charged particles in Au+Au collisions using the PHOBOS detector at the Relativistic Heavy Ion Collider (RHIC). Data taken at collision energies of 19.6, 62.4, 130 and 200 GeV are shown over a wide range in pseudorapidity. These results, when plotted as a function of , scale with approximate linearity throughout , implying no sharp changes in the dynamics of particle production as a function of pseudorapidity or increasing beam energy.
PACS numbers: 25.75.-q
The characterization of collective flow of produced particles by their azimuthal anisotropy has proven to be one of the more fruitful probes of the dynamics of heavy ion collisions at RHIC. The elliptic flow signal () at midrapidity is significant and consistent with expectations from hydrodynamic models at low starpt . It has been interpreted as evidence for the production of a highly thermalized state, and perhaps for partonic matter gyulassy . At high , the observed shape of elliptic flow starjq1 ; starjq2 is consistent with calculations incorporating jet quenching JQ and quark coalescence QC . Interestingly, the fall of with increasing pseudorapidity () phflow has been less amenable to understanding hirano .
Given the wide range of pseudorapidity coverage and energies available in PHOBOS data, it is interesting to examine the extent to which the shape of the flow distributions change with energy in the frame of reference of one of the incoming nuclei. The multiplicity distribution has been examined by PHOBOS as a function of (which is an approximation of the rest frame of one of the nuclei) and found to be energy independent over a wide range of limfrag . Data showing such energy independence is said to be consistent with the concept of “limiting fragmentation” limfragold , which, as used here, may extend well beyond the region of the collision normally thought of as the fragmentation region. This work examines the degree to which the elliptic flow in Au+Au collisions at RHIC exhibits limiting fragmentation.
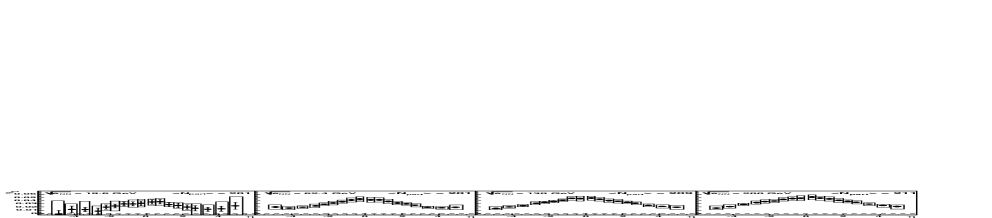
The PHOBOS detector employs silicon pad detectors to perform tracking, vertex detection and multiplicity measurements. Details of the setup and the layout of the silicon sensors can be found elsewhere phobos_det . Detector components relevant for this analysis include the first six layers of both silicon spectrometer arms, the silicon vertex detector (VTX), the silicon octagonal multiplicity detector (OCT), three annular silicon multiplicity detectors on each side of the collision point, and two sets of scintillating paddle counters.
Monte Carlo simulations of the detector performance were based on the Hijing event generator hijing and the GEANT 3.21 geant simulation package, folding in the signal response for scintillator counters and silicon sensors.
The data used in this analysis were recorded in the year 2000 (=130 GeV), 2001 (=19.6 and 200 GeV) and 2004 (=62.4 GeV) runs. Details on the event selection and signal processing can be found elsewhere limfrag ; phflow . The majority of the data was taken with zero magnetic field to simplify the analysis. The exception was at 130 GeV, where field-on data was included to increase statistics. The selected data at each of the four energies correspond to the 40% most central events.
The analysis presented here is very similar to that used in previously published PHOBOS results at =130 GeV phflow . It is based on the anisotropy of the azimuthal distribution of charged particles traversing the detector. At the points where charged tracks pass through an active silicon detector, energy is deposited in the form of ionization. The pad where energy is deposited is said to be a “hit”. This analysis is based on the “subevent” technique where one studies the correlation of hits in one part of the detector with the event plane angle as determined by hits in a different part of the detector pandv .
The strength of the flow is given by the Fourier coefficient of the particle azimuthal angle distribution,
| (1) |
where is the true reaction plane angle defined by the impact parameter and the beam axis. This analysis was confined to , the so-called elliptic flow. and (our best estimate of ) are calculated as in reference pandv .
The analysis presented here differs from that in our previously published elliptic flow results phflow by including only collisions within 10 cm of the nominal vertex position (along the beam axis). This constraint encompasses the bulk of our data at all energies and satisfies centrality determination restraints at 19.6 GeV. Unfortunately, such collisions occur in a region of the detector that is quite non-uniform in azimuth. Above and below and to each side of the nominal collision point are holes in the OCT subdetector amounting to half the azimuthal coverage. Particles passing into the region above or below the collision point traverse the VTX detector. The holes to each side of the nominal collision point prevent shadowing of the spectrometer detectors.
The detector hit map was symmetrized in order to use the subevent technique for the flow analysis. For each of the holes above and below the collision point, this entailed filling the hole by mapping the inner VTX layer hits onto a virtual OCT layer. Because of the limited coverage of the silicon spectrometer, the holes to each side were filled by linearly extrapolating across the hole the hit density adjacent to the hole region in on an event-by-event basis. The latter procedure yielded an expected loss in sensitivity, reducing the raw, measured flow signal by roughly 10% relative to a detector with no hole in that region.
Before analyzing each event for flow, the symmetrized detector hit map was weighted to correct for the relative phase space differences between detector pads due to geometry (acceptance weight), and the dilution of the asymmetries in the hit map due to the occupancy in the pixelized detector (occupancy weight).
The acceptance weights were calculated in each annulus through the use of individual hit weights, w, which are proportional to the inverse of the average number of hits in each pad. These weights were determined separately in bins of centrality and longitudinal vertex position.
The occupancy was determined on an event-by-event basis from the number of occupied () and unoccupied () pads in small sections of the detector. The occupancy weight in a given section, representing the average number of tracks per hit pad, was determined assuming a Poisson statistical distribution as multdists
| (2) |
where =(1 + /) is the average number of tracks per pad. This occupancy was used in concert with the acceptance weight to produce the overall weight for a given hit,
| (3) |
which was used in the determination of .
Using the weighted and symmetrized hit map, the resolution-corrected elliptic flow was calculated with the standard subevent technique used for our earlier results phflow . The subevent regions used in the event plane calculation were for all four energies. The event plane resolution was calculated separately for each centrality bin. The resolution correction ranged from 2 to 3 on average, with the larger correction necessary at 19.6 GeV. For the determination of in the positive (negative) region of the detector, the subevent on the opposite side of midrapidity was used to evaluate .
Monte Carlo simulations showed a residual suppression of the flow signal, thought to be dominated by background particles carrying no flow information and the loss of sensitivity due to the hit map symmetrization and the occupancy correction algorithm. As in our earlier work, this suppression was corrected using simulated data by comparing the output resolution corrected flow signal to the input flow signal for many samples of simulated data with different shapes and magnitudes of input flow.
Numerous sources of systematic error were investigated, including effects due to the hit definition, hit merging, subevent definition, knowledge of the beam orbit relative to the detector, shape of the dN/d distribution, hole filling procedure, vertexing algorithm, transverse vertex cuts, magnetic field configuration and suppression correction determination. The effect of these sources depended both on and centrality. In general, the systematic error arising from each source was determined by varying that specific aspect of the analysis (or several aspects in concert) within reasonable limits and quantifying the change in the final result as a function of and centrality. The individual contributions were added in quadrature to derive the 90% confidence level error shown in the results presented here. The systematic uncertainty was dominated by the suppression correction determination.
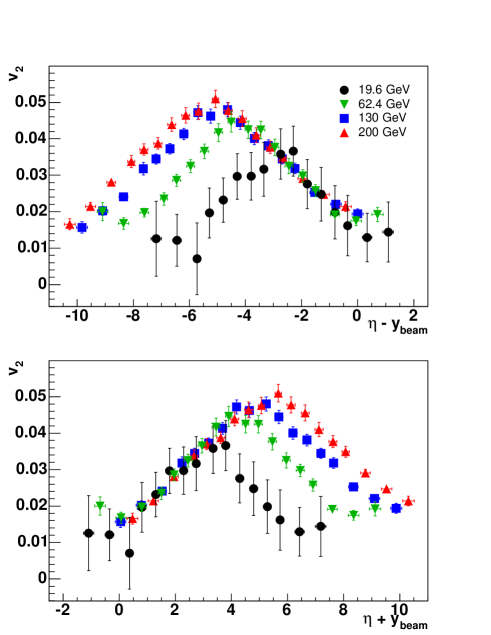
The fully corrected elliptic flow signal is shown for all four energies in Figure 1. The values shown are consistent with previous measurements where there is energy and acceptance overlap phflow ; na49 ; starcumulant . The error bars represent the 1 statistical errors and the boxes give a measure of the systematic error for each point at 90% confidence level. The statistical errors are somewhat correlated point-to-point due to shared event plane and event plane resolution determinations.
Relative to the other energies, the data at 19.6 GeV comprise a smaller set of events with both smaller flow and multiplicity. This leads to the lack of statistical power at 19.6 GeV apparent in Figure 1. This, in turn, contributes to the large systematic errors because of the difficulty in separating statistical and systematic effects.
The PHOBOS 200 GeV -integrated track-based results agree very well with the data shown in Figure 1 in the available range of qm04 . Also, the PHOBOS track-based elliptic flow results are consistent with the STAR 4-particle cumulant results as a function of qm04 ; starcumulant . This agreement, along with the fact that the track-based technique is expected to have a different (and smaller) susceptibility to non-flow correlations, implies the hit-based results shown here do not have a significant contribution from non-flow correlations, at least in the region 2.
All four energies in Figure 1 show a non-boost-invariant, roughly triangular shape peaking at midrapidity. At the lower energies the flow seems to level off (and maybe even rise) at high . This might be due to pronounced directed flow in these regions at the lower energies or an effect due to the presence of participant nucleons. At higher energies, the participants are pushed further out in and the directed flow is smaller qm04 .
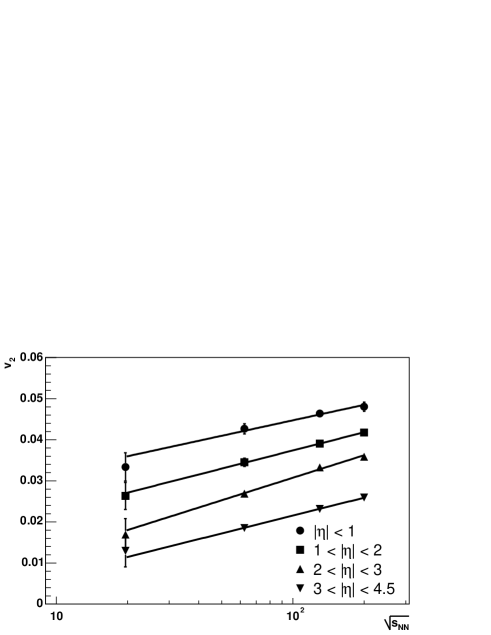
Figure 2 shows that the magnitude of the elliptic flow grows logarithmically with the beam energy for differing regions of . The lines represent fits to the data.
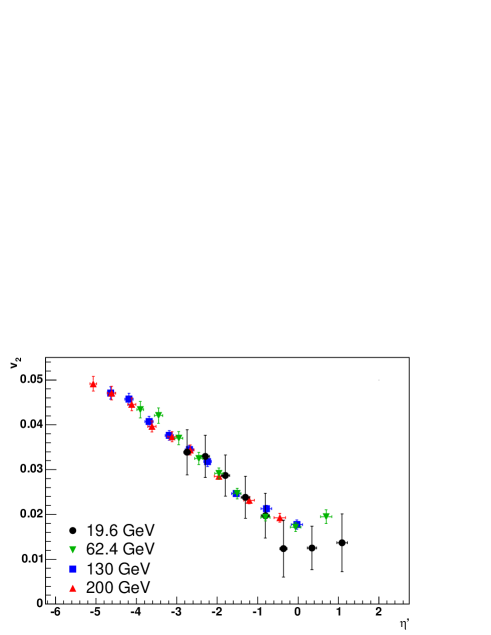
Figure 3 shows the results from Figure 1 plotted in terms of . For clarity, only the statistical errors are shown. For this and the following plot, the highest points in the 19.6 GeV data are not included because they lack significance due to large systematic errors.
For the purpose of examining boost invariance and the limiting fragmentation behavior of the elliptic flow, it would be best to use the rapidity () rather than . Unfortunately, this is not possible with the PHOBOS detector over such a large acceptance range. The effect of working in rather than is estimated by us and others kolb to be small (15%) and is not thought to change the qualitative features of the shapes, though deviations near midrapidity might occur if plotted as a function of .
Figure 4 shows the elliptic flow, as seen in Figure 1, where data from positive and negative are averaged and plotted as a function of for all four energies. The four curves scale throughout the region of overlap through mid- for each energy. This scaling, along with the fact that the shape in is approximately linear, implies the triangular shape of () in Figure 1 and the linear evolution of () shown in Figure 2.
The results in Figure 4 show that elliptic flow exhibits limiting fragmentation in the full range of , reminiscent of what was observed in the multiplicity limfrag . The degree to which the elliptic flow is shown to be independent of energy everywhere in is somewhat surprising given the success of hydrodynamics in describing the flow at the higher energies in the region near mid-.
In summary, these results illustrate the energy-independence of elliptic flow in ultra-relativistic heavy ion collisions over a large region of throughout the energy reach of RHIC. The degree to which the energy independence of the results extends to midrapidity for the elliptic flow is intriguing. It is difficult to reconcile this fact with the common assumption that the particle production at midrapidity differs from that in the fragmentation region, particularly at the higher energies. These results are not obviously compatible with the underlying (Bjorken/Feynman) picture of the nuclear collisions at RHIC, supported by the success of hydrodynamics at midrapidity. They imply the longitudinal degree of freedom is not to be treated trivially in our experimental and theoretical efforts to understand these collisions.
Acknowledgements: This work was partially supported by U.S. DOE grants DE-AC02-98CH10886, DE-FG02-93ER40802, DE-FC02-94ER40818, DE-FG02-94ER40865, DE-FG02-99ER41099, and W-31-109-ENG-38, by U.S. NSF grants 9603486, 0072204, and 0245011, by Polish KBN grant 2-P03B-10323, and by NSC of Taiwan Contract NSC 89-2112-M-008-024.
References
- (1) C. Adler et al., Phys.Rev.Lett. 87, 182301 (2001).
- (2) M. Gyulassy, nucl-th/0403032, presented at the NATO Advanced Study Institute, Kemer, Turkey, September 2003.
- (3) C. Adler et al., Phys. Rev.Lett 90, 032301 (2003).
- (4) C. Adler et al., Phys. Rev.Lett. 92, 052302 (2004).
- (5) M. Gyulassy, I. Vitev and X. Wang, Phys. Rev.Lett. 86, 2537 (2001).
- (6) D. Molnar and S. Voloshin, nucl-th/0302014.
- (7) B.B. Back et al., Phys. Rev. Lett. 89, 222301 (2002).
- (8) T. Hirano, Phys. Rev. C 65 011901 (2002).
- (9) B.B. Back et al., Phys. Rev. Lett. 91, 052303 (2003).
- (10) J. Benecke, T.T. Chou, C-N. Yang, and E. Yen, Phys. Rev. 188, 2159 (1969).
- (11) B.B. Back et al., Nucl. Instrum. Meth. A 499 603 (2003).
- (12) M.Gyulassy and X.N.Wang, Phys. Rev. D44, 3501 (1991). We used standard Hijing v1.35.
- (13) GEANT 3.2.1, CERN Program Library.
- (14) A.M. Poskanzer and S.A. Voloshin, Phys. Rev. C58, 1671 (1998).
- (15) B.Back et al., Phys. Rev. Lett. 87 102303 (2001) .
- (16) C. Alt et al., Phys. Rev. C68, 034903 (2003).
- (17) C. Adler et al., Phys. Rev. C66, 034904 (2002).
- (18) M.Belt Tonjes et al., nucl-ex/0403025, to appear in the Proceedings of the Seventeenth International Conference on Ultra-Relativistic Nucleus-Nucleus Collisions, Oakland, CA, January 2004.
- (19) P. Kolb, Proc. of the 17th Winter Workshop on Nuclear Dynamics 89, eds. G.D. Westfall and W. Bauer, EP Systema, Debrecen, Hungary, 2001.