Exploring QCD with Heavy Ion Collisions
Abstract
After decades of painstaking research, the field of heavy ion physics has reached an exciting new era. Evidence is mounting that we can create a high temperature, high density, strongly interacting “bulk matter” state in the laboratory — perhaps even a quark-gluon plasma. This strongly interacting matter is likely to provide qualitative new information about the fundamental strong interaction, described by Quantum Chromodynamics (QCD). These lectures provide a summary of experimental heavy ion research, with particular emphasis on recent results from RHIC (Relativistic Heavy Ion Collider) at Brookhaven National Laboratory. In addition, we will discuss what has been learned so far and the outstanding puzzles.
1 Introduction
While the universe as we know it is well described by the standard model of particle physics, some important questions remain unanswered. Perturbative Quantum Chromodynamics (pQCD) — a part of the standard model — is a very successful description of hard, or short-distance, phenomena [1], where the “strong interaction” becomes weak due to asymptotic freedom. For example, the production of jets in collisions at 1.8 TeV is well described for jet transverse energies from 10–400 GeV [2]. There is, however, an important set of soft physics phenomena that are not well understood from first principles in QCD: color confinement, chiral symmetry breaking, and the structure of the vacuum. These phenomena are important: almost all of the visible mass of the universe is generated by soft QCD and not by the direct Higgs mechanism. The current masses of the three valence quarks make up only about 1% of the mass of the nucleon [3].
In order to study these phenomenon, we seek to separate color charges by heating matter until a quark-gluon plasma is formed. A conventional electromagnetic plasma occurs at temperatures of about – K, corresponding to the typical ionization energy scale of 1–10 eV. Theoretical studies of QCD on the lattice [4] indicate that the typical energy scales of thermally driven color deconfinement are in the vicinity of 170 MeV, or K. In addition to providing information about the strong interaction, achieving such temperatures would also provide a window back in time. The color confinement phase transition is believed to have occurred within the first few microseconds after the big bang.
In order to achieve such high temperatures under laboratory conditions, it is necessary to use a small, dynamic system. For instance, experimental fusion reactors heat a conventional plasma up to temperatures as high as K over distance scales of meters and lasting for seconds. By colliding gold ions at nearly the speed of light, we expect to achieve temperatures of order K over distance scales of order 10 fm and time scales of order 10–100 ys111Recall that one yoctosecond = s.. Clearly one of the challenges in this endeavor will be to determine whether such small and rapidly evolving systems can elucidate the bulk behavior that we are interested in. Another challenge will be to use some of the rarer products of the collisions to probe the created “bulk” medium.
The focus of these lectures will be on the results coming out of the Relativistic Heavy Ion Collider (RHIC) experiments at Brookhaven National Laboratory (BNL). Earlier experimental results and some theoretical work will be mentioned as needed, but a comprehensive review of heavy ion physics will not be attempted. The RHIC spin physics program using polarized protons will also not be covered.
2 The Machine and Detectors
The RHIC data described in these lectures were taken during the last three years of running at RHIC, starting in the summer of 2000, as summarized in Table 2. The runs were characterized by their species and their , which is the cm collision energy of one nucleon taken from each nucleus. For instance, a collision with GeV on GeV would have GeV. Most of the runs were several weeks in duration, with two exceptions. The 56 GeV run, not intended as a physics run, was only 3 hours long and data is only available from a preliminary subsystem of one experiment (PHOBOS). The 19.6 GeV run was 24 hours long and usable data were taken by three experiments. For the 130 and 200 GeV runs, all four detectors participated: two large detectors/collaborations with 300–400 collaborators each and two small detectors/collaborations with 50–70 collaborators each. These four detectors complement each other and have provided a broad range of physics results. The BRAHMS experiment (Broad RAnge Hadron Magnetic Spectrometer) focuses on tracking and particle ID at high transverse momentum over a broad range of rapidity from 0–3. The PHENIX experiment (Pioneering High Energy Nuclear Interaction eXperiment) provides a window primarily at mid-rapidity, but specializes in high rate and sophisticated triggering along with a capability to measure leptons and photons as well as hadrons. The PHOBOS experiment (descendant of the earlier MARS experiment) provides nearly 4 coverage for charged particle detection, good vertex resolution, and sensitivity to very low particles. The STAR experiment (Solenoidal Tracker At Rhic) provides large solid angle tracking and complete coverage of every event written to tape. More details concerning the capabilities of the accelerator and experiments can be found in NIM journal issue dedicated to the RHIC accelerator and detectors [5].
RHIC running conditions to date. Date Species Year 2000 56, 130 GeV Year 2001 19.6, 200 GeV Jan. 2002 200 GeV Year 2003 , 200 GeV
Some data will also be shown from lower energy heavy ion collisions, particularly from the CERN-SPS (Conseil European pour la Recherché Nuclearie - Super Proton Synchrotron) will also be discussed. The top CERN energy is GeV.
3 Strongly Interacting Bulk Matter
In order to learn anything about QCD from heavy ion collisions, we must first establish that we have created a state of strongly interacting bulk matter under extreme conditions of temperature and pressure.
3.1 How Much Matter?
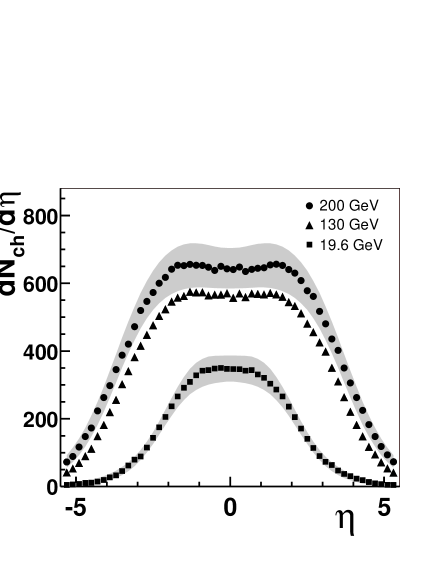
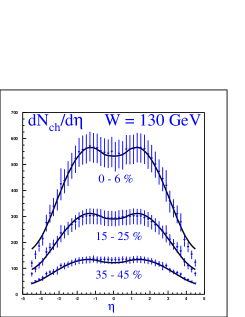
Figure 1 shows the charged particle distribution for central (head-on) collisions in the pseudorapidity variable: . These data imply a total charged multiplicity of for the 19.6 GeV data and for the 200 GeV data [6]. While this number is considerably smaller than Avagadro’s number, it is substantial thermodynamically since small-system corrections to conventional thermodynamics start to become unimportant for systems with about 1000 particles or more [7].
The number of particles produced in a given collision varies widely due to the variable geometry of the collision. Some collisions are nearly head-on with a small impact parameter, while most collisions have a larger impact parameter, with only a partial overlap of the nuclei. These cases can be sorted out experimentally, using both the number of produced particles and the amount of “spectator” neutrons seen at nearly zero degrees along the beam axis. The impact parameter or “centrality” of the collision is characterized by the number of nucleons from the original ions which participate in the heavy ion collision, , or the number of binary NN collisions, . More details can be found in Refs. [8, 9].
3.2 Elliptic Flow: Evidence for Collective Motion
Non-central heavy ion collisions have an inherent azimuthal asymmetry. The overlap region of two nuclei is roughly ellipsoidal in shape. If there is collective motion that develops early in the collision, this spatial anisotropy can be converted to an azimuthal asymmetry in the momentum of detected particles. This azimuthal asymmetry is characterized by a Fourier decomposition of the azimuthal distribution:
| (1) |
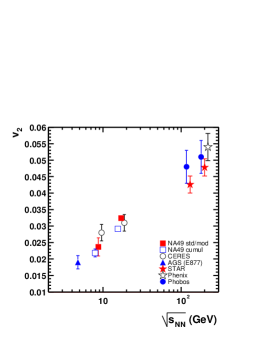
where is the azimuthal angle with respect to the reaction plane222The true reaction plane is defined by the impact parameter vector between the gold ions. The experimental results shown have been corrected for the reaction-plane resolution, which would otherwise dilute the signal.. The left-hand panel of Fig. 2 shows that the elliptic flow parameter is quite large, nearly reaching the values predicted by hydrodynamic models. These models assume a limit of local equilibrium with collective motion of the bulk “fluid”. The right-hand panel of Fig. 2 shows that this asymmetry is the largest ever seen at relativistic energies.
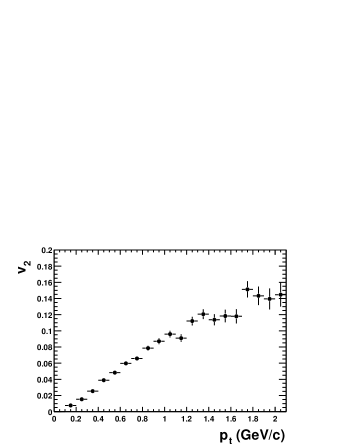
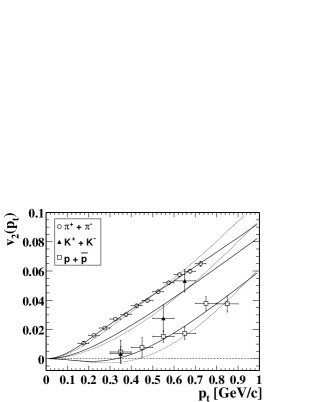
Elliptic flow, in addition to indicating that there is collective motion, can provide information about the type of motion. In particular, the dependence of elliptic flow can distinguish between two limits: the low density limit and the hydrodynamic limit (rapidly expanding opaque source). In the low density limit, some of the produced particles are absorbed or scattered once (and usually only once). In this case, for relativistic particles, is nearly independent of . In the hydrodynamic limit, in contrast, we expect for moderate values of . This effect comes about because the expansion causes a correlation between normal space and momentum space, forcing the highest particles to come from the surface, while low particles can come from anywhere in the volume. Data from the SPS favor the hydrodynamic limit [13]. The left-hand panel of Fig. 3 shows a clear linear relationship between elliptic flow and transverse momentum at RHIC as well, while the right-hand panel shows that hydrodynamic models not only describe the overall trend, but even describe the pions and protons separately.
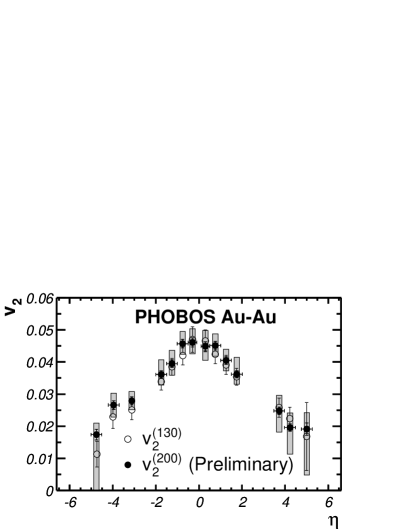
Finally, elliptic flow can be examined as a function of pseudorapidity. The expectation was that the elliptic flow would be nearly independent of pseudorapidity as the basic physics of RHIC were expected to be invariant under longitudinal boosts. Fig. 4 shows that is strongly dependent on pseudorapidity, a result which has still not been explained.
Taken together, these results show clear evidence of collective motion and suggest a system at or near hydrodynamic equilibrium which is rapidly expanding in the transverse direction and which does not exhibit longitudinal boost-invariance.
3.3 Hanbury-Brown Twiss Effect: More Dynamics
Intensity interferometery, or the Hanbury-Brown Twiss effect [15], is a technique used to measure the size of an object which is emitting bosons (e.g. photons from a star or pions from a heavy ion collision). Boson pairs which are close in both momentum and position are quantum mechanically enhanced relative to uncorrelated boson pairs. Bosons emitted from a smaller spatial source are correlated over a broader range in relative momentum, which allows you to image a static source using momentum correlations.
For a given pair of identical particles, we can define their momentum difference, , and their momentum average, . We can further define the three directions of our coordinate system [16]:
-
•
Longitudinal () — along the beam direction (),
-
•
Outwards () — In the plane, ,
-
•
Sidewards () — & .
For a boost-invariant source, the measured sidewards radius at low will correspond to the actual physical transverse (rms) extent of the source at freezeout, while the outwards radius will contain a mixture of the spatial and time extent of the source. Particles emitted earlier look like they are closer to the observer, which artificially extends the apparent source in the out direction. In particular,
| (2) |
where is the transverse velocity associated with , is the “duration of emission” parameter, and are the geometric size in the out and side directions, and is the space-time correlation in the out direction.
In the case of an azimuthally symmetric and transparent source, the last two terms are taken to be small or zero and we have
| (3) |
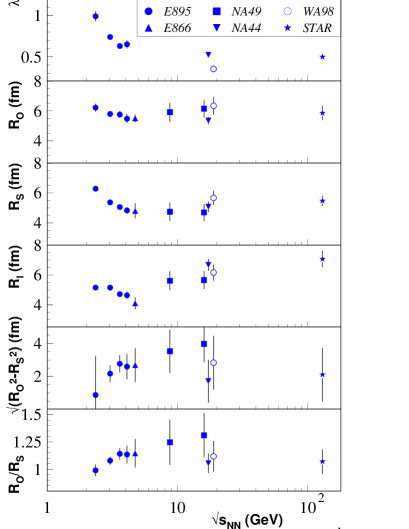
Given the assumption of a boost-invariant, azimuthally symmetric and transparent source, the HBT results from heavy ion collisions have been perennially confusing. From Eq. 3, we expect since most sources should emit for a time which is of the same order as their size. Some models of the Quark-Gluon Plasma predict an even larger value for this ratio as the plasma might need to emit particles over a long time duration in order to get rid of the entropy [18]. However, as can be seen in Fig. 5, is basically unity at RHIC energies, naïvely implying an instantaneous emission of particles over a moderately large volume.
This situation, along with the modest values of , has been termed the “HBT puzzle”. Primarily, though, these data indicate a need to improve the modeling of the collision. If you consider a source which is opaque, rapidly expanding and also not boost invariant, the meaning of changes since we must use Eq. 2 and not Eq. 3. Opacity reduces the apparent value since you only see the part of the source closest to you in the out direction. Transverse expansion along with opacity will decrease the ratio further since particles emitted later are also emitted closer to the viewer, reducing the magnitude of . Finally, a general longitudinal expansion (not just coasting) must be taken into account since we know that the source is not boost invariant. This effect would explain the small size of and has also been shown [19] to reduce the ratio .
So, while HBT and elliptic flow have not been successfully described in full detail by the hydrodynamic models yet, the qualitative message they provide is very similar. The source is rapidly expanding (probably in all three dimensions), opaque, and can be described as “hydrodynamically equilibrated bulk matter”.
3.4 Characterizing the Bulk Matter
Having established that the system has a large number of particles as well as collective behavior, we can now proceed to consider bulk quantities such as the temperature and baryon chemical potential of the system.
In conventional, static, thermodynamic systems, the temperature can be measured by directly measuring the average energy per particle. In a very dynamic system, such as a heavy ion collision, we have to separate the energy contributed by collective motion from the thermal energy. To do this, we make use of the fact that the collective velocity contributes more to the momentum of heavy particles than to lighter particles. Thermal fits [20] to yield a temperature of approximately 100 MeV and an average transverse expansion velocity of 0.55 c. This large expansion velocity supports the picture given by the elliptic flow and HBT.
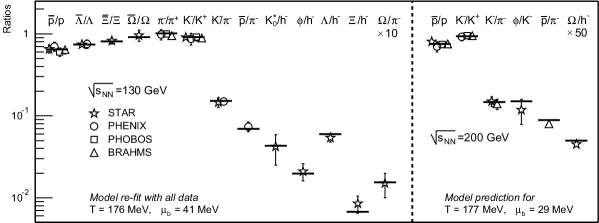
Another thermometer is provided by the fact that the ratios of particles of different masses are sensitive to the temperature. In addition, ratios of particles with the same mass, but different quark content, such as and , are sensitive to the balance between matter and antimatter, characterized by the baryon chemical potential . Positive values of refer to a matter (baryon) excess in a system. Fig. 6 shows particle abundance ratios and a thermal fit. This fit yields a constant temperature of 176–177 MeV at both energies, but a falling baryon density (41 MeV at 130 GeV and 29 MeV at 200 GeV). The falling baryon density is expected. Higher energy collisions dilute the fixed initial baryon excess from the original gold nuclei and also make it harder to transport the baryon excess to midrapidity.
We are immediately faced with a dilemma: our kinetic thermometer, based on energy per particle, indicated a temperature of MeV, while our chemical thermometer, based on particle abundances, indicated a much higher temperature of MeV. The resolution of this paradox lies in the fact that only inelastic collisions can change the particle abundances while both elastic and inelastic collision serve to equalize the energy between particles. Using the terminology of cosmology, we can define an approximate “freezeout hypersurface” which contains the spacetime points of the final collisions suffered by each particle. In the case of a heavy ion collision, the chemical freezeout can occur earlier than the kinetic freezeout. This resolves our dilemma, but with the unavoidable consequence of making our picture of the collision somewhat more complicated. It should be noted that the HBT results are actually imaging the kinetic freezeout boundary as the source.
3.5 “Little Bang Cosmology”
As in cosmology, we are interested in understanding what happened before the freezeout. We can estimate the energy density from the transverse energy produced in the collision and the cylindrical volume occupied shortly after the collision occurred. This leads to the formula [22]:
| (4) |
where the radius R is the nuclear radius and is the time it takes for the transverse energy to be effectively equilibrated (0.2–1.0 fm/c).
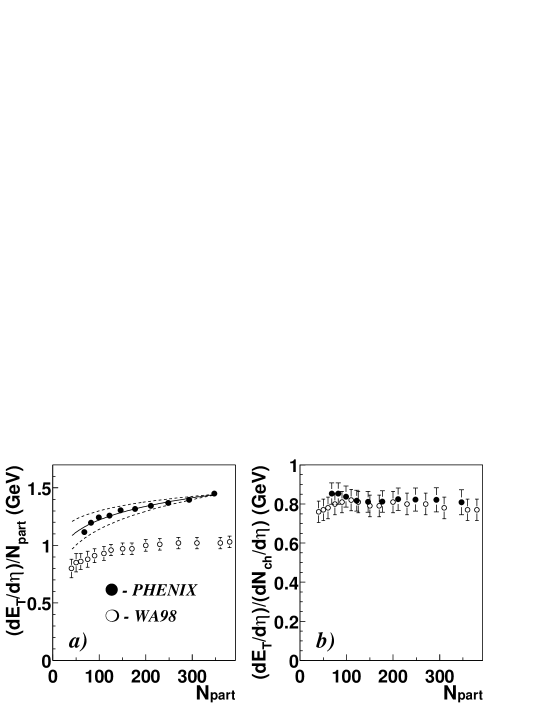
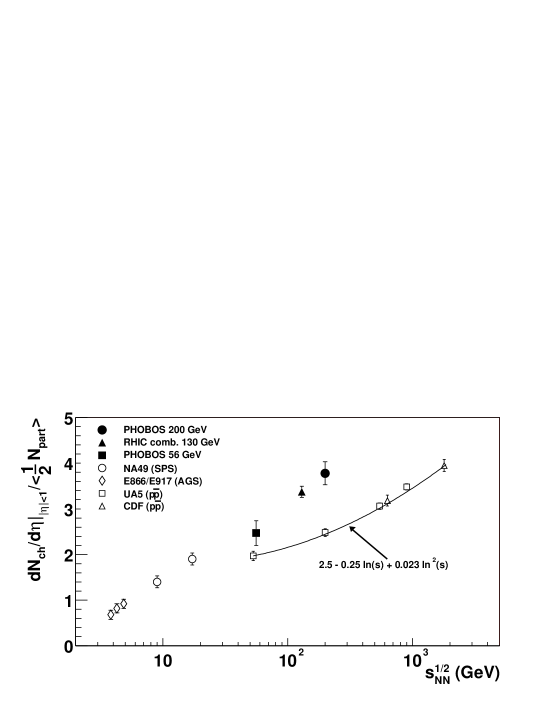
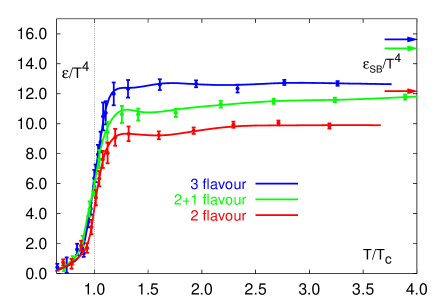
Figure 7 (right panel) shows that the transverse energy per particle is about 800 MeV at RHIC while Fig. 8 shows the multiplicity. Combining these results, using Eq. 4 yields 5–25 for central collisions at the highest RHIC energy. Fig. 9 shows the theoretical relationship, based on lattice QCD calculations [4], between energy density and temperature. The expected dependence of an ideal gas has been divided out, leading to a a constant value for high temperature, proportional to the number of degrees of freedom in the quark-gluon plasma phase.
Combining the data with the theoretical curves leads to an estimated initial temperature of MeV for central collisions at the top RHIC energy. This is significantly higher than the theoretical transition temperature of MeV. A similar exercise at the top CERN-SPS energy 17 GeV, yields an estimated initial temperature of MeV. It should be noted that if we assume a hadronic description rather than a phase transition, the number of degrees of freedom should actually be lower, implying an even higher initial temperature (about twice as high). This means that the estimated initial temperatures of and 240 MeV for RHIC and CERN actually represent lower limits.
3.6 Summary: Bulk Matter
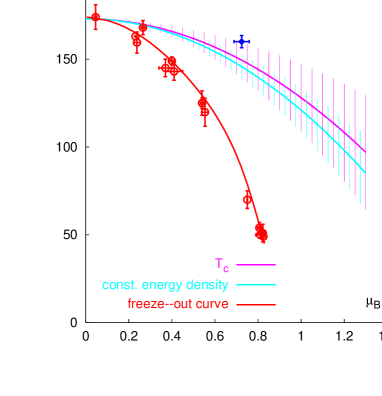
Figure 10 shows the phase diagram based on the chemical freezeout points measured at various energies in heavy ion collisions including the 130 GeV point from RHIC. The 200 GeV point from RHIC would be at basically the same temperature, but MeV rather than MeV. The curve through the data implies freezeout at a fixed energy per particle of about 1 GeV, while the bands indicate the theoretical expectation for the transition between confined and deconfined matter. The initial temperatures estimated for both RHIC and CERN are not shown, but they would lie above the theory curve, with the RHIC temperature being MeV. The constant freezeout temperature for high energy ion collisions, appearing at the theoretical boundary between confined and deconfined matter is provocative. It could be an accident, but it is similar to a situation where you have a detector which only detects liquid, you determine indirectly that you created matter at , and you directly detect droplets of water at a temperature of .
To summarize this section, we have produced a dense, hot, rapidly expanding bulk matter state. We have seen a universal freezeout curve and it is suggestively close to the expected boundary between deconfined and confined matter. Furthermore, we have indications that the initial collision reaches energy densities (and therefore temperatures) well in excess of that expected to be needed for deconfinement.
Efforts to probe this state quantitatively are just beginning, but show promise. This will be the subject of the next section.
4 Probing the Earliest, Hottest Part of the Collision
While the freezeout temperature measurements are on solid footing, the estimates presented above for the initial temperature are indirect. As the RHIC program develops, we can go beyond these qualitative discussions of the early times and start probing them more quantitatively.
4.1 Electromagnetic and Hidden Flavor Probes
Perhaps the cleanest method, from a theoretical perspective, would be to examine thermal photons and leptons that originate from the early part of the collision when the temperature was higher. These weakly interacting particles are expected to decouple thermally (or “freezeout”) from the bulk strongly interacting matter much earlier than hadrons. Combined with a measurement of the energy density this would effectively measure the number of degrees of freedom in the initial state. While it is theoretically very clean, this measurement is experimentally very challenging. A typical central collision at RHIC produces thousands of neutral pions which decay into thousands of photons in each event and serve as a background to this measurement. A typical RHIC detector also has literally tons of material in which background photons (and leptons) can be produced.
Despite the difficulty, these measurements and fits have been attempted at the SPS, both in terms of direct photon spectra [26] and thermal leptons [27]. These results lead to an estimated initial temperature at the SPS of MeV, consistent with our estimate above for partonic matter. These results, however, are very sensitive to details of how the backgrounds are handled.
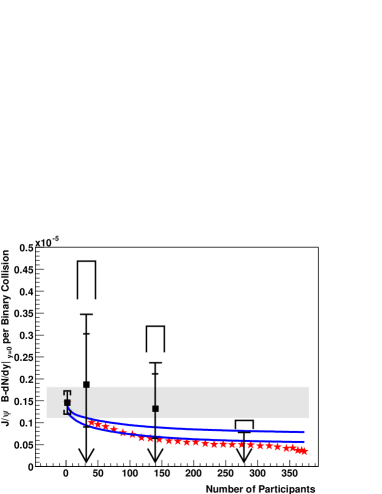
Hidden heavy flavor measurements (strangeness, charm, and beauty) also show promise as potentially sensitive probes of the density of the medium and of chiral symmetry restoration. Fig. 11 shows the suppression of the J/ (hidden charm) compared to collision scaling at RHIC and the SPS. Sensitivity can also be found in the mass, line shape, and yield of the particle (hidden strangeness), seen by its hadronic and leptonic decay modes [28]. So far at RHIC, these measurements suffer from lack of statistical power.
One common denominator that would make many of these signals clearer would be a clean measurement of open heavy flavor (D and B particles). These measurements should be forthcoming from RHIC following upgrades to the detectors and improved luminosity from the collider.
4.2 Hadron Suppression: Jet Quenching?
In addition to measuring the initial temperature, we would like to have a more direct measure of the energy density of the bulk matter that we have created. One handle on this quantity is to study the behavior of high momentum particles in heavy ion collisions. In particular, partons with relatively high transverse momentum are predicted to lose energy when traveling through dense matter, in a phenomenon known as “jet quenching”. The amount of energy loss is proportional to the energy density of the matter traversed, so this is potentially a very sensitive probe.
All four experiments at RHIC measured particle spectra [30, 31, 32, 33, 34, 35]. These spectra need to be compared to a reference sample, appropriately scaled. The simplest such reference sample is to consider each NN collision in the initial AA collision geometry as being independent. This leads us to define a “nuclear modification factor”:
| (5) |
At high momentum, ( GeV/c) this ratio should approach unity if the collisions are independent and the jets are not affected by the material. Jet energy loss in the medium should show up as a suppression of high momentum hadrons. In lower energy AA collisions [36] and collisions [37], an excess has been observed rather than a suppression. This effect is interpreted as being caused by multiple scattering during the initial collision.

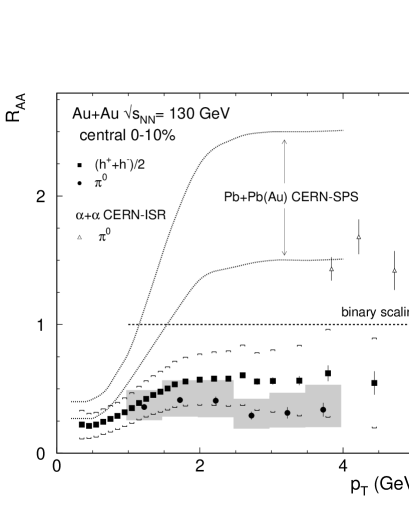
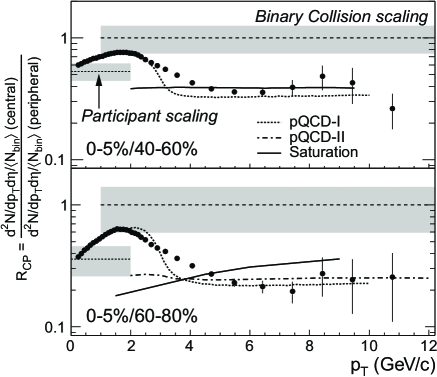
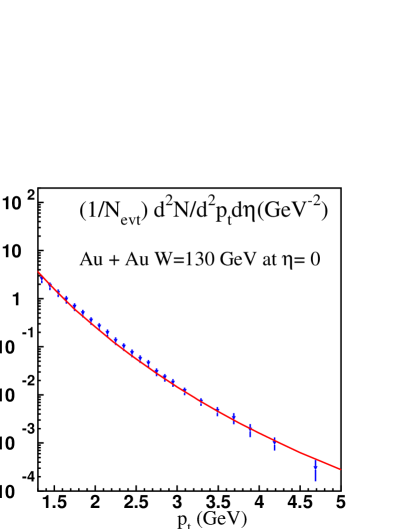
The results at RHIC energies are strikingly different from lower energy data as can be seen in Fig. 12 from PHENIX. Invariant yields for produced particles in central and peripheral 130 GeV data are compared to a scaled-up pp reference sample. For GeV, the peripheral data scales as expected, while the central data shows a substantial suppression. The dramatic difference between the different energies is even more apparent in Fig. 13 where the scaled reference data are divided out to yield , the nuclear modification factor of Eq. 5. Clearly, something qualitatively different is occurring at RHIC energies. Similar results were seen by STAR at 130 GeV [30] and all four experiments at 200 GeV [31, 32, 33, 34]. Since the peripheral data scales as expected, it is also possible to measure hadron suppression by taking the ratio of central/peripheral data, scaled by the ratio of . At 200 GeV, this technique was used to establish that this hadron suppression persists to very high transverse momentum, as seen in Fig. 14. As indicated above, this hadron suppression may be a signature of jet quenching, in which case we have clear evidence of a system with very high energy density.
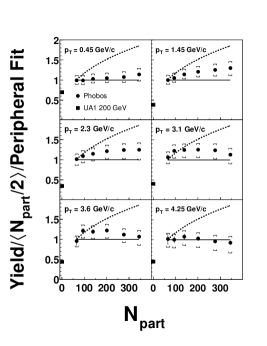
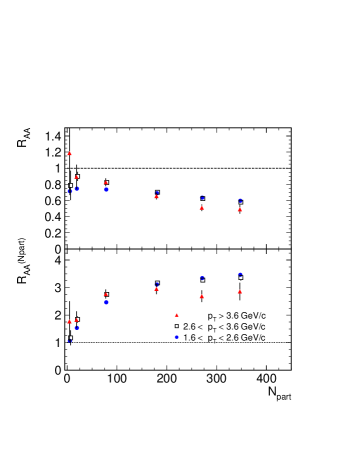
Another view of this hadron suppression, from PHOBOS and PHENIX, shows how strong the effect is. Fig. 15 (left panel) shows the yield in collisions for fixed values of , scaled by mid-central data () and normalized by . Consider the lower-right hand plot, with GeV/c. The dashed curve shows the expectation if () scaling held true over the centrality range shown, while the solid line shows the expectation of () scaling . For , we see approximate scaling of high particle production. Fig. 15 (right panel) shows a similar result, normalized to data, from PHENIX. The lower plot is normalized per participant and the result for GeV/c is relatively flat for . This particular form of high suppression could be an indication that jet quenching reaches a geometric maximum involving one power of length scale (see e.g. Ref. [39]).
Another piece of evidence in favor of the jet quenching interpretation for this data comes from STAR. Jets in pp collisions can be seen by triggering on a high momentum particle and then looking for correlations of moderate particles azimuthally. In pp collisions, this leads to a clear two-jet signal with a cluster of particles near the trigger particle in azimuth and another cluster at (back-to-back correlation). This signal indicates that jets are created and acquire large transverse momentum in conventional parton scattering processes and that the jets survive. For peripheral collisions, one expects a similar result as found in pp, with a small correction due to correlations induced by elliptic flow333Since particles are preferentially produced in the event plane, a trigger particle in the event plane will tend to pick up particles at or . This means that the appropriate reference is .
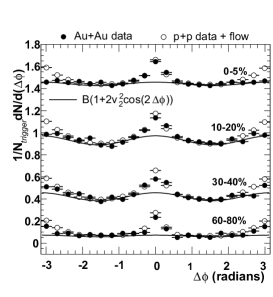
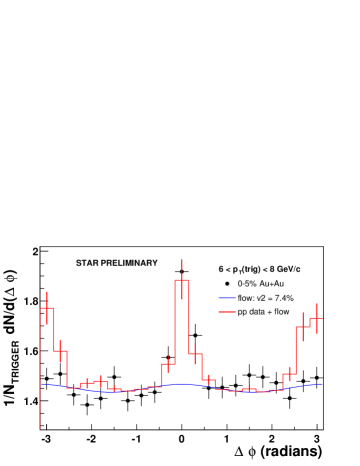
Figure 16 (left panel) shows that the reference sample constructed from collisions and the measured elliptic flow successfully describes the peripheral data: jets are created back-to-back and survive. In contrast, Fig. 16 (right panel) shows the result for central data. In this case, the azimuthal correlation function agrees with the jet+flow reference for while it agrees with the flow-only reference for . This means that the near-side jet survives, but the away-side jet disappears. The main point here is that this measurement shows that the hadron suppression is a jet phenomenon. If back-to-back jets are indeed produced as expected in central collisions, then the away-side jet is quenched by the bulk matter.
4.3 Is Jet Quenching the Only Possible Explanation?
Triggered by the observation that the scaling is approximately proportional to , or , at large , Kharzeev, Levin, and McLerran showed that the “suppression” of jets in compared to NN could simply be due to initial state effects already present in the gold nuclear wavefunction [41]. Parton recombination (or saturation) can cause gluons from different nucleons in the gold nuclei to recombine, leading to a smaller number of partons with a higher transverse momentum per parton. Qualitatively, this is difficult to distinguish from jet quenching since it reproduces both effects:
-
1.
There are fewer high jets than expected because the gold nuclei are not simple linear superpositions of nucleons and there are just fewer quarks and gluons to begin with than expected.
-
2.
Jets do not necessarily come out back-to-back. The usual argument for back-to-back jets assumes two incoming partons with followed by a large angle scatter into two back-to-back jets. However, multiple parton collisions in the initial state lead to partons with non-zero compensated by multiple partners, which need not appear at .
These authors also showed that the initial state saturation model could be made to agree quantitatively with the data (see Fig. 17), including the effect of approximate scaling [41].
The saturation model also describes the overall particle production. In fact, this ability is more natural since parton saturation effects are strongest for the softest partons where the parton densities are the highest. The saturation model relates the gluon distribution at low x in deep inelastic scattering from protons with the energy, centrality, and pseudorapidity dependence of particle production in heavy ion collisions [42].
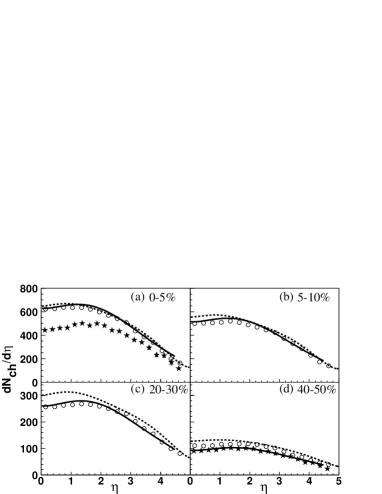
It should also be noted that the saturation model was one of the few models to correctly predict all of the following: the 130 and 200 GeV midrapidity multiplicity [24, 44] and the centrality dependence at all three energies [45]. Figure 18 shows the fits to 130 and 200 GeV data from PHOBOS and BRAHMS respectively. The pseudorapidity and energy dependence are primarily controlled by the parameter, which is extracted from deep inelastic scattering data.
So the initial state saturation model describes well the bulk of soft particle production and, if pushed, may also describe the moderately high particle production behavior. More importantly, the hadron suppression or “jet quenching” effect which we want to use as a probe of the density of the strongly interacting bulk medium may not be a final state effect at all, but may be actually be present in the gold wavefunction.
4.4 Initial or Final State Effect?
At the time of these lectures, RHIC was running deuteron-gold collisions in order to resolve this issue. Initial state effects, such as parton saturation, should still occur in since they are associated with the gold nucleus itself and not the collision. Final state effects, such as jet quenching, should go away in since we do not expect a large bulk medium to form. Some preliminary hints already indicated that the suppression was probably a final state effect rather than an initial state effect.
Since charm quarks are primarily formed by gluon-gluon fusion and are not expected to be quenched in the final state [46], charm serves as a measure of the number of gluons available for hard scattering from the initial state. Open charm production, which was found to scale with the number of collisions [47], implies that parton saturation does not affect hard scattering.
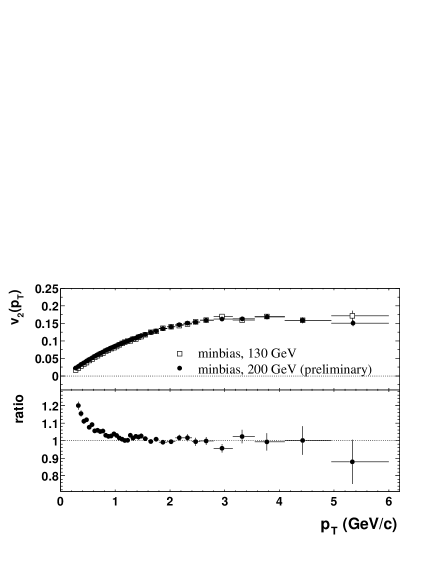
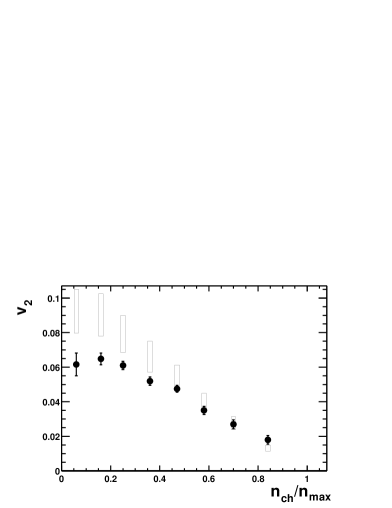
The behavior of elliptic flow at high also suggests that high particles are strongly absorbed in the final state. Figure 19 shows that elliptic flow reaches a constant value at high , independent of . Furthermore, the value is so large that it is essentially the maximum allowable asymmetry from a geometric point of view [49]. This implies that only jets emitted close to the surface make it out as was also indicated by the approximate scaling of high particles. Since the transverse geometry of the collision is a final state effect and not present in a single initial gold wavefunction, high particles must be strongly absorbed or rescattered in the final state, such that the collision geometry leaves its imprint on the final state momentum distribution. It should be noted that a value of 0.17 implies that twice as many particles are emitted in-plane as out-of-plane, a huge effect. This effect has been shown by STAR [48] to persist to GeV/c.
Taken together, the results on overall particle production and high particle production are very suggestive. The system appears to be made up of hydrodynamic bulk matter. The system is opaque and expanding explosively, probably in all three dimensions. The estimated energy density is much higher than that of the theoretical transition. There is a freezeout along a universal curve near the theoretical transition. There is a strong suppression of inclusive high yields and back-to-back pairs and an azimuthal anisotropy at high . The natural implication is that there is a large parton energy loss and surface emission.
These results are tantalizing, but there are some caveats. First of all, we not yet have a complete 3D hydrodynamic description of the collision which is consistent with all of the data. Additionally, there are some outstanding puzzles from PHOBOS and PHENIX. Finally, data from collisions are needed to really disentangle initial state effects. We will turn to the puzzles and data next.
5 Some Puzzles at RHIC
In addition to the surprising features mentioned above (blackness and 3D explosiveness of the source), there are two deep puzzles in the data: the behavior of protons at moderately high and the apparent universality of particle production at high .
5.1 Scaling Puzzle I: Baryon/Meson Differences
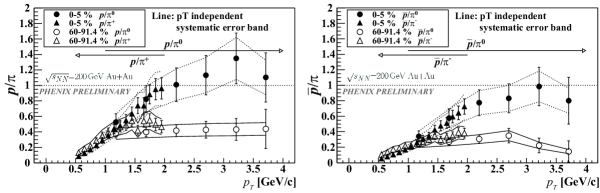
The first puzzle, emphasized initially by PHENIX, concerns the remarkable number of protons (compared to pions) at large transverse momentum, as shown in Fig. 20. PHENIX has also shown that pions are more suppressed than protons in the intermediate region from 2–5 GeV/c [51]. This effect is also seen in neutral mesons and baryons by STAR [52].
Why are pions more suppressed than protons? The current ideas include a modification to the fragmentation function in the hot medium or a difference in gluon jet and quark jet quenching in the hot medium. Perhaps the most intriguing explanation is that, in the presence of jet quenching, a different production mechanism — quark coalescence — starts to dominate hadron production. Instead of the usual jet fragmentation, this is a multiparton mechanism: three independent quarks coalesce into a baryon or an independent quark and antiquark coalesce into a meson [53].
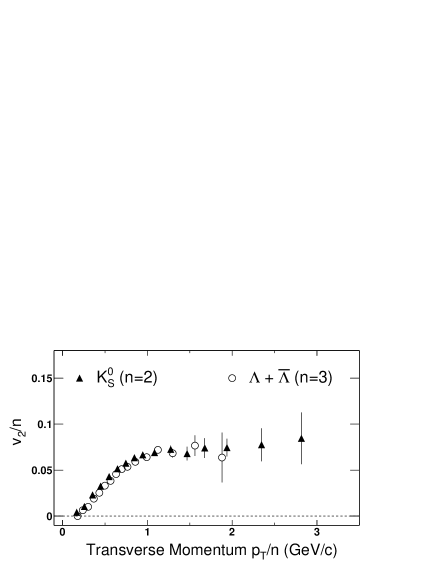
Since the coalescence model [53] predicts a scaling in elliptic flow per constituent quark versus per constituent quark. Figure 21, from STAR, shows this scaling effect for elliptic flow. This model also explains the fact that, in collisions at high , baryons and mesons behave similarly while mesons are suppressed (and reach maximum ) at lower momentum.
While this explanation is intriguing, this result remains a puzzle because it is unclear that this model should apply to data (see Section 6).
5.2 Scaling Puzzle II: Similarity of AA and at High Energy
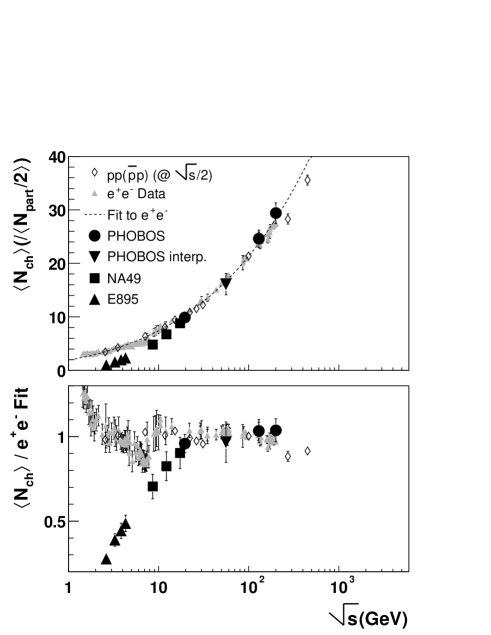
Figure 22 shows the total charged multiplicity for AA collisions (scaled by ) compared to , , and , as a function of the appropriate for each system [54]. The data serve as a reference, describing the behavior of a simple color dipole system with a large . The curve is a description of the data, given by the functional form: with the parameters A and B calculable in perturbative QCD and the constant parameter C determined by a fit to the data [55]. In order to compare them with , the and data were plotted at an effective energy , which accounts for the leading particle effect [56]. Finally, central AA collisions, from the AGS and RHIC, and from CERN are shown. Over the available range of RHIC energies from 19.6 to 200 GeV, the results are consistent with the results, suggesting a universality of particle production at high energy. In addition, the data approximately agrees with the scaled and data suggesting that the effective energy of a high energy AA collision is just . This result is not understood theoretically and remains a puzzle.
6 The Latest Results from RHIC
At the time of the lectures, the critical “control” run at RHIC was not complete. Since then, results from this run have been published by all four collaborations [34, 57, 58, 59]. These results show no hadron or jet suppression in implying that the suppression is NOT present in the nuclear wavefunction. This strongly favors the jet quenching interpretation for hadron suppression in and has led to a lot of theoretical activity.
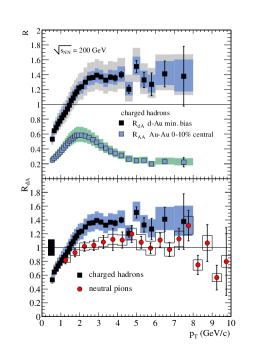
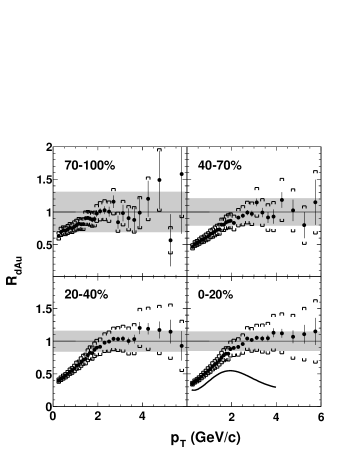
Figure 23 (left panel) shows the minimum bias results from PHENIX at midrapidity. The charged hadrons are enhanced rather than suppressed, in sharp contrast to , a result confirmed by BRAHMS [34]. Furthermore, the pions show collision scaling, again in sharp contrast to the strong suppression seen in .
This contrast is striking, but the comparison of minimum bias to central is not fully decisive. Any nuclear effects in are expected to manifest themselves primarily in central collisions and can be washed out in minimum bias collisions. Fig. 23 (right panel) shows the centrality dependence of from PHOBOS, slightly forward of midrapidity (from the deuteron’s point of view). Even the most central collisions show no suppression.
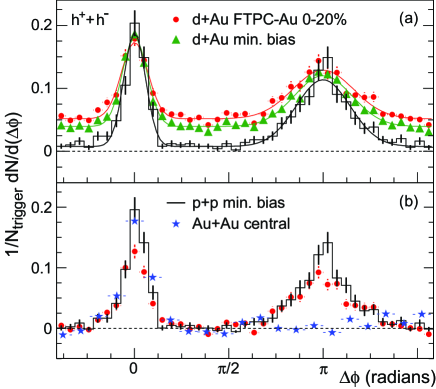
Finally, Fig. 24, from STAR, shows that the jet structure in central collisions can be understood based on a reference sample. There is no significant reduction of back-to-back jets in head-on collisions. The complete suppression of the away-side jet in central collisions is also repeated in this plot for comparison.
Taken together, these results indicate that jets are quenched in collisions at RHIC energies ( of 130 and 200 GeV), while there is little or no evidence of such quenching in or in lower energy AA.
The production and behavior of protons in collisions is again surprising, however. Figure 23 shows that midrapidity pions scale like at high momentum while total charged particles (including protons) are enhanced. This may explain why PHOBOS (Fig. 23) sees little enhancement of charged particles (fewer protons for ). The mystery comes from the fact that the explanations put forward for the relative behavior of protons and pions in do not explain their behavior in .
7 Summary
The field of heavy ion physics has indeed reached an exciting new era. We have created a high temperature, high density, strongly interacting bulk matter state in the laboratory, and we have achieved temperatures higher than needed to theoretically create a quark-gluon plasma. This bulk matter exhibits interesting properties. It appears to be very dense and opaque even at high , generating the maximum possible elliptic flow and strongly quenching any jets which are not formed on the surface of the material. Furthermore, the system appears to be exploding in all three dimensions.
Some puzzles remain. Why are there so many protons at high , and why do protons and pions behave differently even in collisions? Is the particle production universal between AA, , , and at high energy, and if so, why?
Much work remains to be done to study this strongly interacting matter more quantitatively and to resolve the puzzles. Fortunately, the detectors and accelerator are undergoing continuous upgrades and the prospects for a continued rich harvest of physics from RHIC look excellent.
Acknowledgments
Essential help in the assembly of this proceedings was provided by David Hofman (U. Illinois, Chicago). Some of the material in the original lecture presentation was provided by Barbara Jacak (SUNY, Stony Brook) and Thomas Ullrich (BNL). This work was partially supported by U.S. DOE grant DE-AC02-98CH10886.
References
- [1] CTEQ Collaboration (R. Brock et al.), Rev. Mod. Phys. 67 (1995) 157.
- [2] CDF Collaboration (T. Affolder et al.), Phys. Rev. Lett. 88 (2002) 042001.
- [3] Particle Data Group (K. Hagiwara et al.), Phys. Rev. D66 (2002) 010001.
- [4] F. Karsch, Nucl. Phys. A698 (2002) 199.
- [5] Nucl. Inst. and Meth. A499 (2003) 1ff.
- [6] PHOBOS Collaboration (B.B. Back et al.), Phys. Rev. Lett. 91 (2003) 052303.
- [7] T.L. Hill, Thermodynamics of Small Systems (1994), Dover Publications, New York, New York.
- [8] PHENIX Collaboration (K. Adcox et al.), Phys. Rev. Lett. 86 (2001) 3500.
- [9] PHOBOS Collaboration (B.B. Back et al.), Phys. Rev. C65 (2002) 031901.
- [10] STAR Collaboration (K.H. Ackerman et al.), Phys. Rev. Lett. 86 (2001) 402.
- [11] NA49 collaboration (C.A. Alt et al.), arXiv:nucl-ex/0303001.
- [12] STAR Collaboration (C. Adler et al.), Phys. Rev. Lett. 87 (2001) 182301.
- [13] Heiselberg, Levy, Phys. Rev. C59 (1999) 2716.
- [14] PHOBOS Collaboration (B.B. Back et al), Phys. Rev. Lett. 89 (2002) 222301, Nucl. Phys. A715 (2003) 611.
- [15] R. Hanbury-Brown, R. Q. Twiss, Phil. Mag. Ser. 7, Vol. 45, No. 366 (1954) 663, Nature 178 (1956) 1046.
- [16] S. Pratt, Phys. Rev. D33 (1986) 1314, G.F. Bertsch, Nucl. Phys. A498 (1989) 173, U. Heinz, Nucl. Phys. A610 (1996) 264.
- [17] STAR Collaboration (C. Adler et al.), Phys. Rev. Lett. 87 (2001) 082301.
- [18] D. Rischke, M. Gyulassy, Nucl. Phys. A608 (1996) 479.
- [19] D. Rischke, RIKEN/BNL Workshop on particle interferometry and elliptic flow at RHIC, Upton, NY (2002) — no proceedings.
- [20] STAR Collaboration (G. van Buren et al.), Nucl. Phys. A715 (2003) 129.
- [21] T.S. Ullrich, Nucl. Phys. A715 (2003) 399.
- [22] J. D. Bjorken, Phys. Rev. D27, (1983) 140.
- [23] PHENIX Collaboration (K. Adcox et al.), Phys. Rev. Lett. 87 (2001) 052301.
- [24] PHOBOS Collaboration (B.B. Back et al.), Phys. Rev. Lett. 85 (2000) 3100, Phys. Rev. Lett. 88 (2002) 22302.
- [25] P. Braun-Munzinger, K. Redlich, J. Stachel, arXiv:nucl-th/0304013.
- [26] WA98 Collaboration (M.M. Aggarwal et al.), Phys. Rev. Lett. 85 (2000) 3595.
- [27] R. Rapp, E.V. Shuryak, Phys. Lett. B473 (2000) 13.
- [28] PHENIX Collaboration (D. Mukhopadhyay et al.), Nucl. Phys. A715 (2003) 494.
- [29] PHENIX Collaboration (S.S. Adler et al.), arXiv:nucl-ex/0305030.
- [30] STAR Collaboration (C. Adler et al.), Phys. Rev. Lett. 89 (2002) 202301.
- [31] PHOBOS Collaboration (B.B. Back et al.), arXiv:nucl-ex/0302015.
- [32] PHENIX Collaboration (S.S. Adler et al.), arXiv:nucl-ex/0304022.
- [33] STAR Collaboration (J. Adams et al.), arXiv:nucl-ex-0305015.
- [34] BRAHMS Collaboration (I. Arsene et al.), Phys. Rev. Lett. (2003) in press. arXiv:nucl-ex/0307003
- [35] PHENIX Collaboration (K. Adcox et al.), Phys. Rev. Lett. 88 (2002) 022301.
- [36] E. Wang, X.N. Wang, Phys. Rev. C64 (2001) 034901.
- [37] J.W. Cronin et al., Phys. Rev. D11 (1975) 3105.
- [38] PHENIX Collaboration (K. Adcox et al.), Phys. Lett. B 561 (2003) 82.
- [39] B. Müller, Phys. Rev. C67 (2003) 061901.
- [40] STAR Collaboration (C. Adler et al.), Phys. Rev. Lett. 90 (2003) 082302, STAR Collaboration (D. Hardtke et al.), Nucl. Phys. A 715 (2003) 272.
- [41] D. Kharzeev, E. Levin, L. McLerran, Phys. Lett. B561 (2003) 93.
- [42] D. Kharzeev, E. Levin, Phys. Lett. B523 (2001) 79.
- [43] BRAHMS Collaboration (I. G. Bearden et al.), Phys. Rev. Lett. 88, (2002) 202301.
- [44] S.A. Bass et al., Nucl. Phys. A661 (1999) 205.
- [45] PHOBOS Collaboration (M.D. Baker et al.), Nucl. Phys. A715 (2003) 65.
- [46] Y.L. Dokshitzer, D.E. Kharzeev, Phys. Lett. B519 (2001) 199.
- [47] PHENIX Collaboration (K. Adcox et al.), Phys. Rev. Lett. 88 (2002) 192303.
- [48] STAR Collaboration (K. Filimonov et al.), Nucl. Phys. A715 (2003) 737.
- [49] S.A. Voloshin, Nucl. Phys. A715 (2003) 379, E.V. Shuryak, Phys. Rev. C66 (2002) 027902.
- [50] PHENIX Collaboration (T. Chujo et al.), Nucl. Phys. A715 (2003) 151.
- [51] PHENIX Collaboration (S.S. Adler et al.), arXiv:nucl-ex/0305036.
- [52] STAR Collaboration (J. Adams et al.), arXiv:nucl-ex/0306007.
- [53] R.J. Fries, B. Müller, C. Nonaka, S.A. Bass, arXiv:nucl-th/0306027.
- [54] PHOBOS Collaboration (B. B. Back et al.), arXiv:nucl-ex/0301017.
- [55] A. H. Mueller, Nucl. Phys. B213 (1983) 85.
- [56] M. Basile et al., Phys. Lett. B92 (1980) 367, Phys. Lett. B95 (1980) 311.
- [57] PHENIX Collaboration (S.S. Adler et al.), Phys. Rev. Lett. (1993) in press, arXiv:nucl-ex/0306021.
- [58] PHOBOS collaboration (B. Back et al.), Phys. Rev. Lett. (1993) in press, arXiv:nucl-ex/0306025.
- [59] STAR collaboration (J. Adams et al.), Phys. Rev. Lett. (1993) in press, arXiv:nucl-ex/0306024.