Liquid Argon Ionization Detector for Double Beta Decay Studies
Abstract
A multisection liquid argon ionization detector was developed by the DBA collaboration to study the double beta- decay of 100Mo. The experiment was carried out in the Gran Sasso underground laboratory in Italy. The detector design and main characteristics are described. The decay of 100Mo was observed and its half-life measured: yr. Limits on the 0 and 0 modes of the decay were obtained: yr and yr at 68 % (90 %) C.L., respectively. In addition the upper limits on the 42Ar content and 222Rn activity in liquid Ar were found to be g/g and Bq/kg, respectively.
1 Introduction
The current interest in decay is due to the
fact that its existence is closely linked to the following
fundamental aspects of particle physics
[1, 2, 3]:
-lepton number non-conservation;
-existence of neutrino mass and its nature;
-existence of right-handed currents in the electroweak
interactions;
-existence of the Majoron;
-the Higgs sector structure;
-existence of leptoquarks;
-heavy sterile neutrino and composite neutrino.
All these questions lie beyond the scope of the Standard Model of
electroweak interactions and so the detection of decay will give rise to ”new physics”. The primary
interest in this process is the question of neutrino mass: -the
detection of decay will allow to establish
the absolute neutrino mass scale and will indicate that this mass
is of Majorana type. The recent results from atmospheric
[4], solar [5, 6, 7, 8, 9], and
reactor [10] neutrino experiments indicate that neutrinos
have mass and they mix. This very exciting result has greatly
renewed the interest in decay since the
oscillation experiments show that the next generation of double
beta decay experiments will have a good chance of measuring the
absolute mass of the neutrino. To date, only lower bounds on
half-lives () have been obtained experimentally for a
number of double beta decay isotopes. These bounds are used to
deduce upper limits on the Majorana neutrino mass, the
right-handed current admixture parameter, the Majoron-Majorana
neutrino coupling constant etc. However, uncertainties in nuclear
matrix element (NME) calculations do not allow reliable limits to
be placed on these fundamental values. In this context the
detection of two-neutrino double beta decay
becomes of particular importance because information on
experimental values of NME (2) for different nuclei enables
a more accurate calculation of both NME (2) and NME (0).
A liquid argon detector [11, 12] was designed by
the DBA collaboration to study the double-beta decay of
100Mo. The 100Mo isotope was selected for the study
because of its large transition energy (Eββ = 3033 keV). In 1996 the experimental setup was installed
in the Gran Sasso underground laboratory (Italy). In this work we
describe the technique used in the experiment. Special attention
is paid to the design of the experimental setup, calibration
procedure and performance of the detector components.
2 Experimental setup
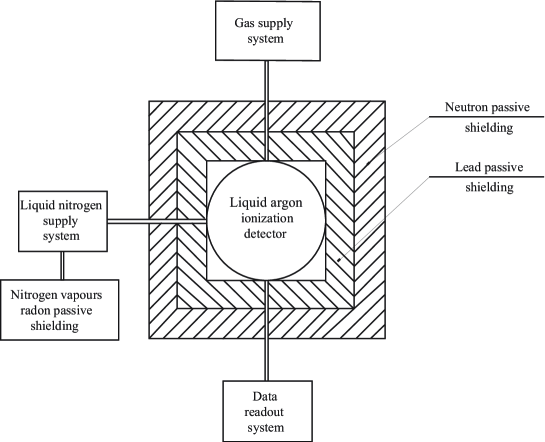
The experiment was carried out in the Gran Sasso Underground Laboratory located at a depth of 3500 m w.e. (meters of water equivalent). The experimental setup (Fig. 1) consists of a liquid argon ionization detector enclosed in passive lead shielding, a gas supply system, a radon protection system, a mechanical crane used for detector assembling and disassembling, electronics and a data acquisition system. The equipment was mounted on a special concrete platform with dimensions of 40.6 m. To suppress mechanical vibrations the platform was supported on a rubber sheet. The platform carried a special ”house” which protected the equipment from the moist atmosphere underground. The data acquisition and readout system of the detector was placed in another ”house” located 2 m away from the platform.
2.1 Liquid-argon ionization detector
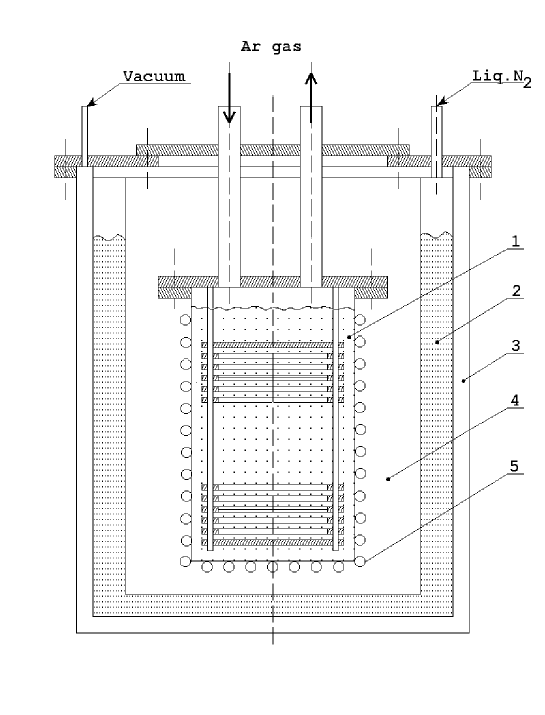
The detector is mainly constructed of titanium and its alloys. All the insulators in the electrode system were made of fluoroplastic. A sketch of the detector is shown in Fig. 2. The detector was cooled with liquid nitrogen that was fed into a nitrogen volume (2) from a 4000 l Dewar vessel. The liquid nitrogen was pumped to the detector through a pipeline, enclosed in vacuum heat insulation to reduce the liquid nitrogen flow rate, which was necessary for long period of routine data taking. The nitrogen volume (2) was thermally insulated from the environment with a vacuum casing (3). The inner wall of the volume was coated with 12 layers of 10 m-thick aluminized Mylar. This thermal insulation allowed the liquid nitrogen flow rate to be reduced to 6 l/h. The nitrogen volume (2) was connected to a chamber (4), in which a vessel (1) with liquid argon was housed, with a tube to equalize the nitrogen vapor pressure in these volumes. Heaters (5) located on the outside wall of the vessel (1) regulated the liquid argon temperature.
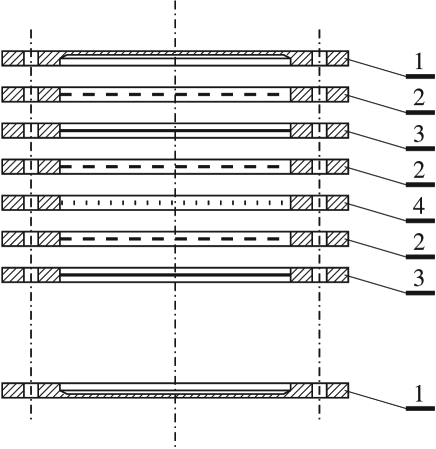
The electrode system that formed the sensitive volume of the detector was placed in the vessel (1), 40 cm in diameter and 70 cm high. The active detection portion of the detector was composed of identical sections (Fig. 3) Each section consisted of two combined flat ionization chambers with screening grids (2) and a common cathode (3). A foil made of the isotope under study (molybdenum) was inserted into a circular cathode frame. The sensitive volume was 30 cm in diameter and 56 cm high. The detector contained 14 cathodes, 15 anodes, and 28 screening grids. The grid-anode and grid-cathode gaps were 5.5 and 14.5 mm, respectively. The anodes (4) had the same design as the grids. The screening grids and anodes were made with 110 m Ni-Cr wires wound with a 1 mm spacing. The top and the bottom anodes (1) of the electrode system were solid titanium discs. The high voltage applied to the cathodes and the grids was -4.8 and -2 kV, respectively. Charge sensitive preamplifiers converted the charge, produced on each anode, into a voltage pulse.
2.2 Isotopes
The detector cathodes were made of molybdenum foil 50 mg/cm2 thick. The four cathodes of enriched molybdenum (98.4 % of 100Mo) were first investigated in three experimental runs of 202, 238, and 313 h duration. To suppress the radioactive background these cathodes were mounted at the center of the electrode system and interleaved with cathodes of natural molybdenum (containing 9.6 % of 100Mo). The activity of radioactive impurities in the molybdenum foil samples was less then 0.015 Bq/kg for 214Bi, 0.0015 Bq/kg for 208Ti and 0.04 Bq/kg for 234mPa. The total mass of 100Mo under study was 138.7 g. Later, the 100Mo mass in the detector was increased to 306 g (eight cathodes of 100Mo). The interleaved arrangement of the natural and enriched molybdenum cathodes allowed a differential measurement to be made. In this method one can subtract the natural sections spectrum from the enriched sections spectrum yielding a pure 2 effect. The total measurement time with eight 100Mo cathodes was 2706 h.
2.3 Gas supply system
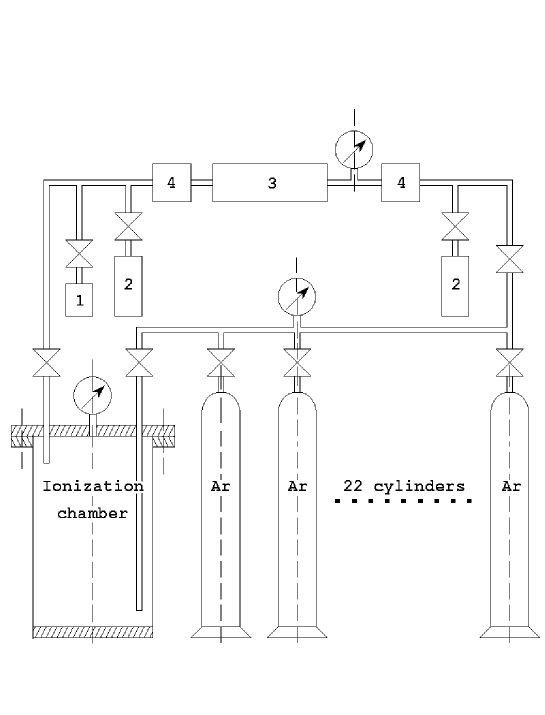
The gas supply system (Fig. 4) consisted of 22 40 l stainless steel bottles with gaseous argon under a pressure of about 150 bar, a gas purification system (3), and a gas purity control system (1). Six of these bottles were housed in stainless steel Dewar vessels. After the measurements they were used as a cryogenic pump to transfer the liquid argon from the chamber to the bottles. The gas purification system (3) had a titanium sponge as its main element due to a low concentration of radioactive impurities in this getter. For example, a purification system based on an Oxysorb absorber or a molecular sieve releases 100–1000 times more 222Rn because the 238U content in these materials (approximately 10-6 to 10-7 g/g) exceeds that of titanium by the same factor. After a single pass of gaseous argon through the titanium sponge at a temperature of 850 0C the concentration of electronegative impurities was under 1.9 equiv. O2 [13, 14]. The content of electronegative impurities in argon was monitored with a two-phase detector (1) [14, 15]. The absorber vessel, made of high-temperature steel, was a cylinder 50 mm in diameter and 300 mm high filled with the titanium sponge. The argon flow rate during the purification phase was 0.6 m3/h.
2.4 Passive shielding
The 15 cm thick passive shielding of lead was installed on a concrete platform. Note that the measured radon activity in the ambient air was 200 Bq/m3 (for comparison, the radon activity in the other halls of the Gran Sasso underground laboratory was 40 Bq/m3). To suppress radon diffusion from the environment the nitrogen vapor from the detector’s cooling system was flushed through a heat exchanger, heated to 20 0C and directed inside the passive shielding. With the same aim in mind hollow organic glass blocks were placed next to the detector inside the passive shielding (in order to reduce the volume of air inside the shielding). As a result, the background due to 222Rn near the detector (inside the passive shielding) was suppressed to a level of 2 Bq/m3 (before installation of the organic glass blocks it was 50 Bq/m3). The passive neutron shielding included a 25 cm thick water layer to thermalize neutrons and a 1 cm thick layer of boric acid (H) powder to capture the thermalized neutrons. Preliminary estimates showed that such shielding should provide an almost tenfold suppression of the background due to high-energy gamma’s produced from the neutron capture in the detector. The experimental test demonstrated that the suppression factor for energies above 4 MeV was approximately eight.
2.5 Electronics and data readout system
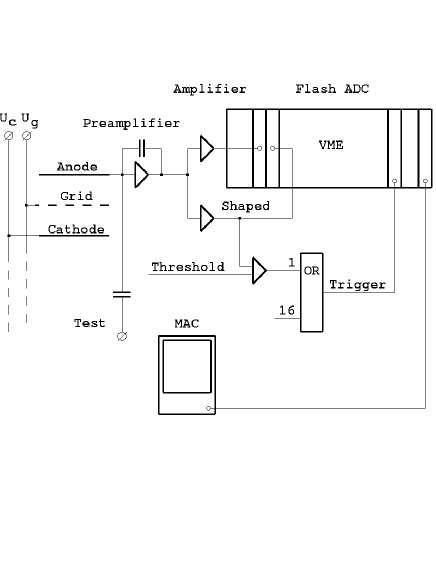
A diagram of the electronics and data readout system used in the experiment is shown in Fig. 5. The outputs from all 15 anodes go to 15 ceramic feedthroughs. These signal feedthroughs, mounted on the lid of the liquid argon chamber ((1) in Fig.2), were connected to the charge sensitive preamplifiers located on the upper lid of the detector. Each electronic channel consisted of a charge sensitive preamplifier, an amplifier, and an analog to digital converter (ADC) with a 20 MHz sampling frequency. Since each channel recorded both shaped (= 3.6 s) and unshaped (no filtering) signals, 30 flash ADCs were used. Spatial information on the events was obtained by analyzing the shape of the unfiltered pulses. A Macintosh computer with the MACUA 1 data acquisition software was used for both recording the data and controlling the electronics. The programs for raw data histograming and an event display were written in the same software environment. The trigger for data collection required that at least one anode signal exceeded the 700 keV threshold. Each trigger caused digitized signals from all anodes to be written to a data tape. Such a universal triggering pattern allowed the use of the power of pulse shape analysis to reduce the background and allowed the investigation of single electron spectra and the extraction of limits on 42Ar and 222Rn content in liquid argon (see Section 3).
2.6 Calibration procedure
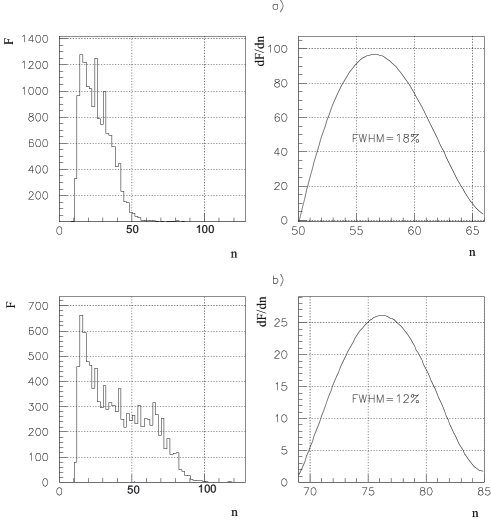
The detector filled with liquid argon was calibrated with external gamma sources. The calibration was aimed at (a) providing a relationship between the amount of energy deposited in the detector’s fiducial volume and the ionization signal amplitude recorded by the readout electronics and (b) determining and monitoring the stability and energy resolution of the detector. The response of the electronics was regularly tested for linearity and stability with a voltage pulse generator. The integral nonlinearity was 1 % throughout the dynamic range. A small 2 % drift of the amplifiers gains was observed over the period of data taking and was corrected using the pulse generator data. Two -ray sources were selected for the calibration: 22Na (T1/2 = 2.6 yr, Eγ = 1275 keV) and 88Y (T1/2 = 106.6 days, Eγ= 1836 keV). Since the photoelectric effect probability depends heavily on the atomic number of the element (P) and the atomic number of argon is relatively small (Z = 18), it is virtually impossible to use the photoelectric effect to calibrate the liquid argon detector. However, the energy spectrum of Compton electrons is appropriate for this purpose if the source intensity is high enough to allow the fitting of the high energy edge of the Compton spectrum followed by its differentiation. This approach was used in the calibration procedure. A fifth degree polynomial function was chosen to fit the spectrum. The peak of the first derivative of the fit function corresponds to the maximum energy of the Compton electrons. For 22Na and 88Y this energy is 1063 and 1610 keV, respectively. Each channel was calibrated independently. Typical single channel calibration spectra of 22Na and 88Y sources are shown in Fig. 6. The full width at half-maximum (FWHM) of the distribution for the channel shown was about 18 % for 1063 keV (22Na) and 12 % for 1610 keV (88Y). The resolution of the other channels varied from this value by no more than 10 %. It is worth noting that the relative energy resolution changed with energy as 1/E rather than . This is because the major contribution to the energy resolution is capacitive noise in the electronics readout chain (note the high value of the electrode’s capacitance - 500 pF) and the ”microphone effect”. The latter is caused by mechanical vibrations of the anode and grid wires in the boiling liquid argon resulting in oscillation of the electrode capacitance value. The extrapolation of the 22Na and 88Y calibration results gives a 6 % energy resolution (FWHM) at the energy of the 100Mo decay transition (3033 keV). The calibration procedure with the sources described above was repeated every 300 h during the measurements. No deviations from the initially measured values were observed over the course of data taking.
3 Physics results
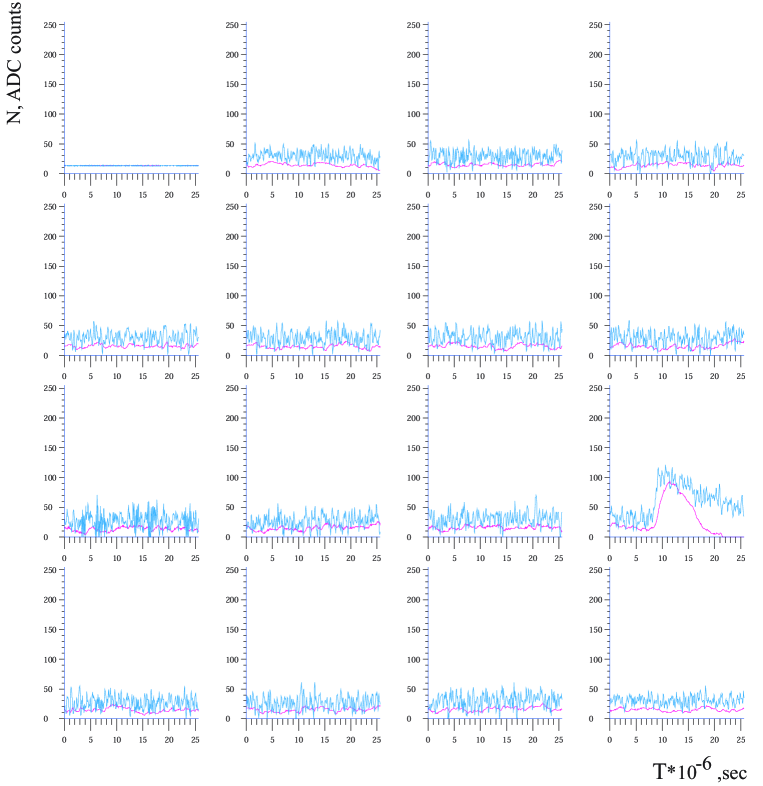
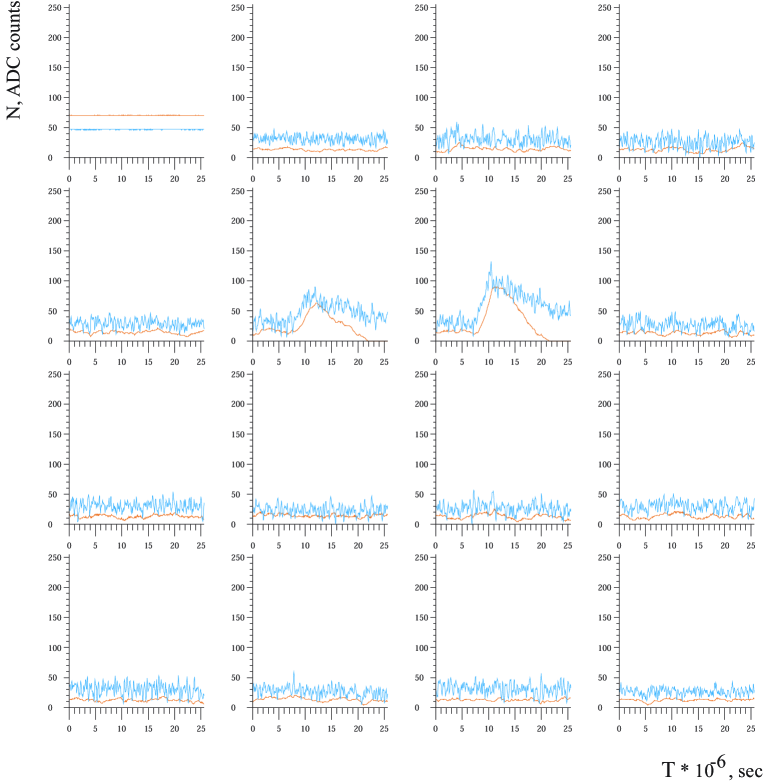
A typical single electron event (only one anode signal above the threshold) is shown in Fig. 7. Two-electron events (events with two neighboring anode signals with a time difference 0.6 s) were selected as candidate events for the double beta decay of 100Mo (Fig. 8).
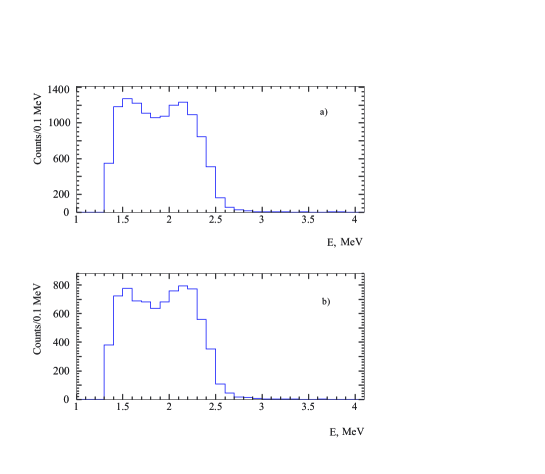
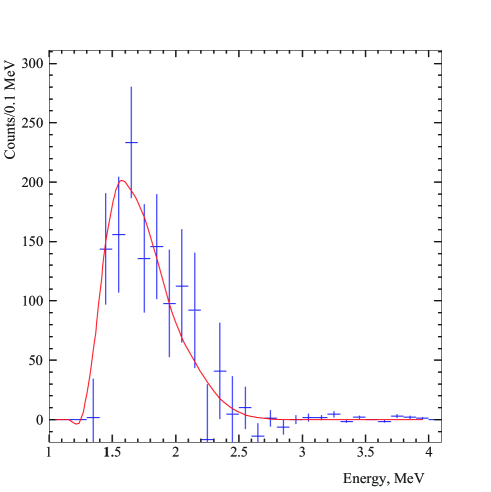
Figure 9 shows the electron sum energy spectra of these events for the sections with enriched and natural molybdenum. The energy threshold is 0.8 MeV for the first electron in the event and 0.5 MeV for the second. The detection efficiency of each decay mode was calculated by Monte Carlo using the GEANT 3.21 program [16]. The final analysis involved the results from all experimental runs which corresponded to 842.2 kgh of measurements for 100Mo and 592.9 kgh for natural molybdenum. The difference spectrum of two-electron events (enriched – natural) shown in Fig. 10 is due to the decay of 100Mo.
0-mode
To reduce the background the energy threshold for each electron of a pair was set at 1 MeV. The energy range (2.8–3.1) MeV has been studied with an additional selection on signal shape. As a result 6 events in the enriched molybdenum and 4 events in the natural Mo (i.e. 5.8 events if recalculated for 848.2 kgh) have been detected. Using the calculated detection efficiency (6.9%) one can obtain a limit on the decay mode of 100Mo,
yr at 68 % (90 %) C.L. (1)
0-decay
The energy interval (2.3-3.0) MeV has been investigated. 1613 events for the enriched Mo foils and 1577 events for the natural foils (rescaled for 848.2 kgh) have been obtained. For the efficiency of 5.7% we have obtained the limit,
yr at 68 % (90 %) C.L. (2)
2 -decay
Events have been analysed in the energy interval (1.4-2.4) MeV where the signal to background ratio is maximal. After background subtraction 1140 146 events remained. Using the calculated detection efficiency of the 2decay of 100Mo (2.2 %) one gets the half-life:
yr (3)
The systematic error is mainly due to possible contributions of radioactive impurities in the foils.
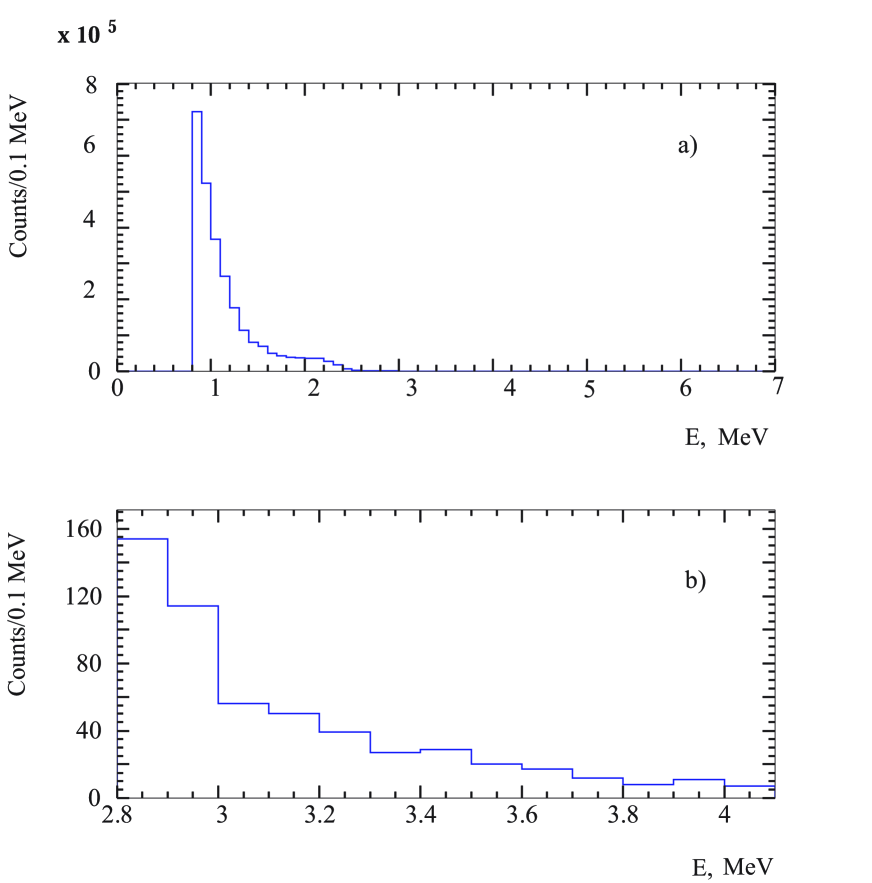
The spectrum of single-electron events obtained over 2706 h of data taking is shown in Fig. 11. It was used to estimate the background in Mo-foil cathodes and to determine 222Rn and 42Ar concentrations in liquid argon. These radioactive isotopes constitute a potential danger for future experiments utilizing large quantities of liquid argon (e.g. ICARUS [17]). 145 and 201 events were observed in the energy intervals (3.0–3.3) MeV (the end point of the 214Bi beta spectrum) and (3.0–3.5) MeV (the end point of the 42Ar beta spectrum) respectively. The contribution to the background in these regions from the high energy plateau was estimated from the high energy part of the spectrum above 3.5 MeV . The maximum number of counts due to 222Rn and 42Ar in the mentioned energy regions were found to be 70 and 127 events respectively. The detection efficiency for these events was calculated by Monte Carlo assuming that the decay products were either uniformly distributed in liquid argon or were deposited on the cathodes. The difference in the calculated efficiency between the two cases was less than 10 %. The efficiencies were 0.025 % for 222Rn and 1 % for 42Ar. The corresponding upper limit on the 222Rn activity in liquid Ar is 1.210-3 Bq/kg at 90 % C.L. The upper limit on 42Ar content is 4.310-21 g/g at 90 % C.L..
4 Conclusions
The liquid argon ionization detector was installed, commissioned
and demonstrated good performance characteristics. The high level
of purity of liquid argon (1.9 equiv.O2)
needed for a successful operation of the detector was achieved.
The data readout system developed made it possible to select
reliably double-beta decay events and separate them from numerous
background events. The two experimental runs carried out in 2000
showed that the passive neutron shielding had suppressed the high
energy background in the fiducial volume by a factor of 8. The
results obtained over a period from 1996 to 2000 are the
following:
1) The decay of 100Mo
with a half-life of [7.2 yr was observed [12].
2) The lower limits on the half-lives for 0 and 0
modes of the 100Mo decay were put at
8.4(4.9) and 4.1(3.2) yr
respectively at 68 % (90 %) C.L.[12].
3) A new experimental limit of Bq/kg (90 % C.L.)
was obtained for the 222Rn activity in liquid argon.
4) The content of radioactive 42Ar in the Earth’s atmosphere was found
to be less than 4.3 g/g (90 % C.L.).
It
should be noted that the two limits are the world’s best results
for the content of 222Rn and 42Ar in liquid argon which
should help understand potential backgrounds in future detectors
using large quantities of liquid argon as detection media.
Acknowledgement
We are grateful to M.Balata (LNGS) for his help in maintaining the liquid nitrogen cooling system of the experiment and for fruitful discussions. We are also thankful to the LNGS workshop staff, in particular to L.Marelli, B.Romualdi, A.Rotilio and E.Tatananni for regular and timely technical support.
References
- [1] H.V. Klapdor-Kleingrothaus, J. Hellmig, M. Hirsch, J. Phys. G 24 (1998) 483.
- [2] A. Faessler and F. Simkovich, Prog. Part. Nucl. Phys., 46 (2001) 233.
- [3] J.D. Vergados, Phys. Rep., 361 (2002) 1.
- [4] T. Kajita and Y. Totsuka, Rev. Mod. Phys. 73 (2001) 85.
- [5] B.T. Cleveland et al., Astrophys. J. 496 (1998) 505.
- [6] J.N. Abdurashitov et al., Phys. Rev. C60 (1999) 055801.
- [7] W. Hampel et al., Phys. Lett. B447 (1999) 127.
- [8] Q.R. Ahmad et al., Phys. Rev. Lett. 87 (2001) 071301; ibid 89 (2002) 001301; ibid 89 (2002) 001302.
- [9] S. Fukuda et al., Phys.Rev. Lett.86 (2001) 5651; ibid 86 (2001) 5656.
- [10] K. Eguchi et al., Phys. Rev. Lett. 90 (2003) 041801.
- [11] A.S. Barabash, A.I. Bolozdynya and V.N. Stekhanov, Preprint of Inst. of Experimental and Theoretical Physics, Moscow, 1986, # 154.
- [12] V.D. Ashitkov, A.S. Barabash, S.G. Belogurov, et al., JETP Lett. 74 (2001) 529.
- [13] A.S. Barabash and V.N. Stekhanov, Nucl. Instrum. Methods Phys. Res., Sect. A, 316 (1992) 51.
- [14] A.S. Barabash and V.N. Stekhanov, Nucl. Instrum. Methods Phys. Res., Sect. A, 327 (1993) 168.
- [15] A.S. Barabash and A.I. Bolozdynya, Zhidkostnye ionizatsionnye detektory (Liquid Ionization Detectors), Moscow: Energoatomizdat, 1993.
- [16] GEANT 3.21. Detector Description and Simulation Tool, CERNLIB, 1994.
- [17] A. Rubbia, Nucl. Phys. B (Proc. Suppl.) 91 (2001) 223.