Elements Discrimination in the Study of Super-Heavy Elements using an Ionization Chamber.
Abstract
Dedicated ionization chamber was built and installed to measure the energy loss of very heavy nuclei at 2.7 MeV/u produced in fusion reactions in inverse kinematics (beam of 208Pb). After going through the ionization chamber, products of reactions on 12C, 18O targets are implanted in a Si detector. Their identification through their alpha decay chain is ambiguous when their half-life is short. After calibration with Pb and Th nuclei, the ionization chamber signal allowed us to resolve these ambiguities. In the search for rare super-heavy nuclei produced in fusion reactions in inverse or symmetric kinematics, such a chamber will provide direct information on the nuclear charge of each implanted nucleus.
keywords:
PACS:
25.70 , 25.75 , 25.70.Gh , 29.40.C , ionization chamber , SHE , heavy ion detection, , , , , , , , , , , , , , , , , , , , , , , , , , , , , ,
1 Introduction.
The production of super heavy elements (SHE) and the study of their properties are conducted in several research centers (ANL, GSI Darmstadt, JINR Dubna, LBL Berkeley, GANIL Caen, Riken, Jyväskylä). So far all experiments were done in normal kinematics (projectile much lighter than the target nucleus), which means that the recoiling fusion nuclei and their detected evaporation residues have very low kinetic energies per nucleon, typically in the 0.2-0.5 MeV/u range. Most of the groups use very similar detection and identification techniques. A typical detection setup consists of 2 or 3 carbon foils associated with micro-channel plate detectors which give a time-of-flight information (i.e. the velocity ), and a position silicon detector where the reaction products are implanted and which returns information on the energy and x-y position. Due to the very large mass of the evaporation residues, the ionization defect in the Si implantation detector is very large, the energy signal is small and has a broad distribution (due to fluctuations of the energy loss in the carbon foils and the Si crystal response), so that mass determination through kinetic energy and velocity is not feasible. Neither it is possible to install a E detector (thin Si detector or gas chamber) since it would stop the evaporation residues. Therefore no direct identification of the detected reaction product is made. Actually, the fusion evaporation residues and other reaction products are identified via alpha-particle decay chains leading to a known nucleus [1]-[3]. Indirect although unambiguous identification is done. The observed -chain or fission decay has to be correlated with the signal from the heavy ion in the implantation detector. This technique is powerful but suffers from two limitations: i) the detection efficiency for -particles is not 100 % , so the chains are often not complete. ii) since the evaporation residue cross section becomes very small for compound nuclei above Z106, there are very few such products (1-2 per day or per week) among a background due to other reaction products (transfer reactions) some of which are -emitters, so the probability of wrong chain reconstruction and identification may be large [4], [5]. Therefore any direct information on the mass and/or charge of the implanted product would be very useful, even though it does not offer a resolution of 1 mass or charge unit. In the detection of rare events, it is clear that redundant information is needed in order to eliminate erroneous identifications. Each additional independent physical quantity that can be measured and delivered by a modified detection system is precious.
Such information can be obtained in the case of inverse kinematics or nearly symmetric systems. Indeed the compound nucleus recoil velocity is much larger. It was calculated that an estimate of the mass can be obtained after calibration of the implantation detector response with heavy projectiles at the compound nucleus velocity and with known very heavy nuclei or “light” super-heavy fusion nuclei (formed with a relatively large cross section). Similarly, a thin detector (gas counter) can be installed before the implantation detector to provide a E information, so that an estimate of the nuclear charge can be obtained. In GANIL a test experiment was performed with such a detection set-up in inverse kinematics: beam of 208Pb at 5 MeV/u on light targets.
In this paper we show that the E signal from an ionization chamber can be used to distinguish between different reaction channels leading to SHE. In chapter two we present the detection setup of the GANIL experiment. Next we describe the construction and properties of the ionization chamber. In chapter four some results from the reactions 208Pb+12C and 208Pb+18O are presented stressing the role of the signals received from the E detector. The last section gives conclusions and some perspectives.
2 Experimental detection setup.
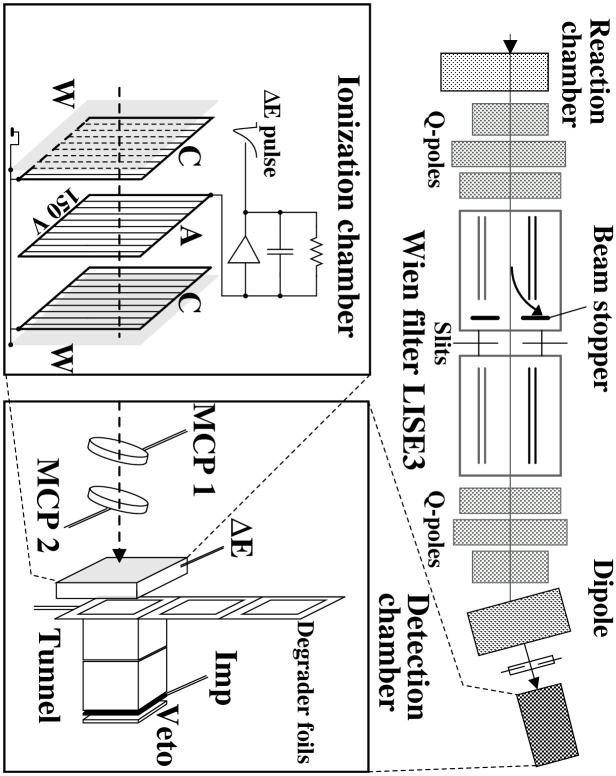
The main tool of SHE research at GANIL is the Wien filter at the LISE magnetic spectrometer with crossed magnetic and electric fields (figure 1). It is divided into two identical halves. The ratio of magnetic to electric field is set to select the velocity of the complete fusion fragments (evaporation residues). Their values are chosen so that the projectiles are deflected in the first half of the Wien filter and stopped in a Faraday plate. Two pairs of independently movable slits and a beam profiler were installed at mid- filter. The suppression of unwanted products is improved by a dipole magnet located after the velocity filter.
The reaction chamber contains several rotating targets: a 670 mm diameter wheel bearing 35 targets and rotating at 2000 RPM, allowing targets with a low melting temperature to sustain intense beams, a 16 cm wheel with 8 targets for materials having a higher melting temperature and small rotating targets (diameter 5 cm) used for calibration at low intensity. The time structure of the beam is synchronized with the rotation. A Si detector continuously monitors the status of each target. To equilibrate the charge state of the fusion products before they enter the Wien filter, a 50 m carbon stripper was placed 40 cm behind the target. After the dipole magnet, the velocity of each product is obtained from the ToF between 2 aluminized mylar foils and micro- channel plate detectors. Then an ionization chamber provides a E signal. It is described in the next section. The residual kinetic energy and localization are given by a X-Y Si implantation detector (IMP).
The energy of -particles and fission fragments escaping from IMP is measured with a set of 8 Si detectors which form a tunnel. A veto Si detector is installed behind IMP to reject light particles which might punch through it. Special electronics and data acquisition systems were developed. A fast analysis program allowed us to identify -decay chains or spontaneous fission events on line.
The transmission of fusion evaporation residue produced at the target position through the quadrupoles, filter and final dipole was studied via a simulation code. The optics was checked and the Wien filter was calibrated using 208Pb ions at several energies, which were also used for calibrating the ToF and IMP response. The transmission efficiency of the whole set-up was checked via fusion reactions with known cross sections and -decay chains.
Direct identification of the SHE is done in the two-dimensional plot: energy signal from the IMP vs ToF signal. In the ToF range selected by the velocity filter, there is always a background of scattered projectiles, 208Pb ions in this case. The higher energy signals come from heavier products. This informs us on the mass number of the reaction product. The energy and ToF resolutions are such that the mass resolution is several %. This is sufficient to eliminate many of the heavy transfer products. An additional discrimination between products with different Z’s is necessary to improve the direct product identification.
3 Construction and specification of the ionization chamber (IC).
For the production of super-heavy nuclei via complete fusion followed by evaporation of 1 or a few neutrons (detected evaporation residues, ER), projectiles at (about) 5 MeV/u are used. In inverse kinematics experiments (Pb, U projectiles) the kinetic energy of the ER’s can be as high as 2.5 - 3 MeV/u. In nearly symmetric systems (Xe + Sn), it is around 1.2 MeV/u. Such energy is sufficient to install a E detector; here it is an ionization chamber.
The process of how an ion with charge Z loses energy passing through matter is quite complicated and has been a subject which received great theoretical and experimental interest. In the few MeV/u energy region mainly electron interactions are responsible for the energy losses while the nuclear interactions are negligible. Here the effective charge becomes the important quantity. The Bethe-Bloch formula is no longer exact and is usually replaced by semi-empirical ones [6, 7]. Experimental data shows that in the vicinity of the Bragg maximum, energy loss is approximately proportional to Z. This dependence can be used to identify the charge of the ion. For our experiment we are interested in discriminating between nuclei with charge Z=82 (projectiles) to 88 (fusion products on 12C material used to support the target material and as stripper foils) and super-heavy compound nuclei (Z106). A resolution in Z of 1 % would allow us to measure Z of the ER. We do not expect such a resolution, but, as one can see, such a detector will be useful if its E (charge) resolution is only on the level of 10% or better.
The main factors which influence resolution of the gas detector are:
-
1.
Detector thickness- x. The energy loss E=xdE/dx is proportional to the detector thickness, and straggling of the E is proportional to () [8]. That means the relative resolution () is inversely proportional to .
-
2.
Non-uniformity of the detector thickness. In the case of the gas detector non uniformity is due to the window distortions caused by the gas pressure. This effect can by partially corrected by installing additional field wires which define a constant useful length (see below).
-
3.
Non-completeness of charge collection. Part of the charge generated by the passing particle is not collected by the detector mainly due to the recombination process. This effect decreases the detector resolution. If charge collection conditions determined by the electric field are different for various ion trajectories, the recombination process worsens the detector resolution even more.
-
4.
Noise of the associated electronics. The detector signal is broadened by the electronics noise. This broadening depends on the internal noise of the preamplifier and detector capacity.
Considering the above factors we decided to build an ionization chamber as a E detector. In such a solution the amount of collected charge is almost insensitive to the anode voltage. This property is a result of absence of avalanche processes, which would be responsible for additional fluctuations of the collected charge. The detector construction is schematically depicted in fig.1. The electric field in the counter is generated by 3 planes of wire grids. The distance between consecutive planes is 1.5 cm and each one has the same dimensions: 5 cm x 5 cm. Within a grid wires are spaced 2 mm apart and their diameter is 10 m. Such a solution minimizes the electric capacity of the counter as a consequence, electronic noise is reduced [9]. The 2 outer grids are grounded while the middle one is set to a positive voltage around 150 V. The electric field in the counter is parallel to the trajectory of an entering ion. Because of this, the collection of the generated charge is independent on the point of the ion injection. Furthermore, for any given particle trajectory in the IC, the effect of the generated charge on the electric field is identical. This means the same conditions are obtained for the collection of the useful charge. As a result, the rise-time and the shape of the pulse are very similar for each detected particle. It is therefore possible to optimize the shaping times in a spectroscopic amplifier. Additionally, in order to minimize electronics noises, the low noise charge preamplifier was connected directly to the counter output signal [10]. The charge sensitivity of the preamplifier is 940 mV/pC.
The counter thickness is determined by the distance between mylar windows and by the type and the pressure of gas. As said above the gas pressure causes a smearing of the counter thickness. It becomes dependent on the particle trajectory. The cathode grids put just besides the windows minimize this effect. If the window and the screening grid are at the same potential (ground), the electric field between them is approximately equal to zero. As a result, the charge generated in the region of non constant thickness (window-grid to cathode), do not influence the measured pulses. The charge from such a region recombines or is collected by the residual field. If the residual field collects this charge the collection time is long and a slowly increasing component appears in output pulse, but this slow component is eliminated by the spectroscopy amplifier. The effective transmission for the system due to the window support wires and three planes of wires grids was calculated to be around 96%.
This ionization chamber is operating with circulating isobutane under the pressure of 30 mbar. Circulation of the gas is controlled by a GANIL gas flow control system. Mylar windows of 2.5 m on both sides are used.
4 Reactions Pb+12C,18O. Alpha chains and E signals.
The resolution of the IC is poorer than the difference in the energy loss of adjacent elements passing through the chamber. In order to study this resolution one has to utilize independent information on the Z of the detected ion. For this purpose we use measurements performed to calibrate the detection set-up. These measurements were done with a 5 MeV/u 208Pb beam, delivered by the 1st stage cyclotron of the GANIL facility, impinging on 18O and 12C targets.
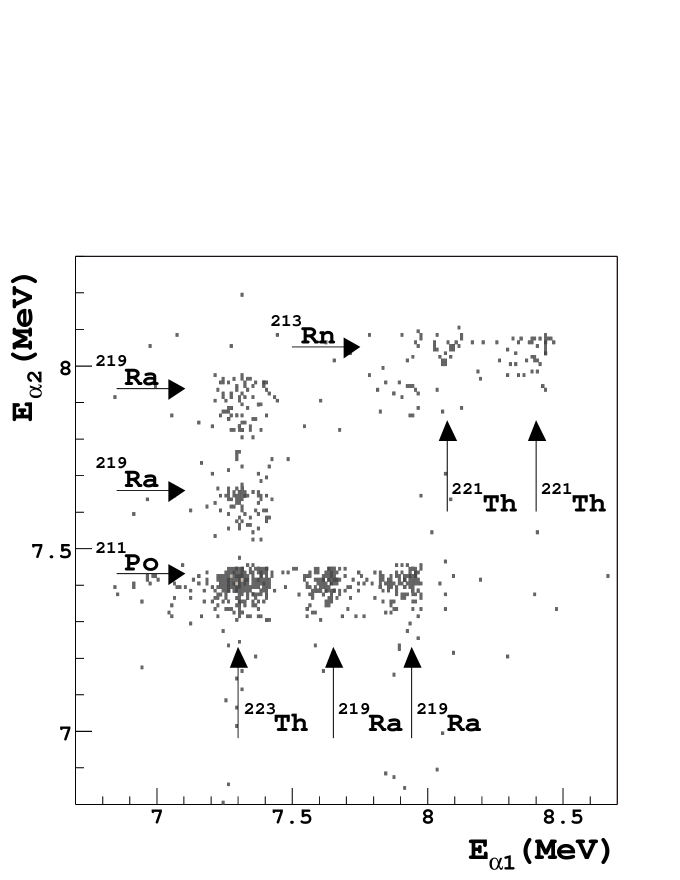
With 18O target, the compound nucleus is 226Th∗ and has excitation energy E∗=35 MeV. Reaction products give E signals in the IC and their radioactivity is used to identify them after they implant in the position-sensitive Si detector IMP(see sec.2). In fig.2 is shown the 2-dimensional energy spectrum of particles which are emitted at the same position as an ER implanted in the strip detector. The figure shows that there are well defined groups of ’s. Using a standard ER-- correlation technique alpha chains which start from the parent isotopes 221Th and 223Th can be identified. This means that the compound nucleus 226Th∗ which de-excites by 5n and 3n neutron evaporation channels was produced. In the figure we marked also alphas that are emitted by daughter nuclei. The parent nucleus (implanted residue) is unambiguously identified here because the half life of the first emitted from the residue is long enough and these alphas can be detected by the detection system. The 4n channel, 222Th, must also be present, but the half-life of its daughter 218Ra∗ is 25 s, below the time resolution, 50s, of the detection system; for the grand-daughter 214Rn∗, it is less than 1 s. Conversely, the grand-grand-daughter 210Po∗ has a much too long half-life: 138 days. Therefore we cannot see them. Only one alpha from the radioactive decay chain of 222Th was identified. This alpha is emitted by the 222Th itself. It has energy 7.98, 7.60 MeV and half live 2.5 ms which lies in the most convenient range of ms-0.1 s acceptable by our detection set up. Background pulses in the IC originate mainly from scattered Pb ions with velocities matching the velocity filter acceptance. This background may broaden the E distribution of other detected Z’s. Indeed, if one Pb ion implants in the IMP detector at the same x-y position as an ER before this ER emits its alpha, then the E signal of the Pb ion is attributed to the ER. This contribution depends on the counting rate. Because we use chains to identify Z of the ER, it also depends on the time after which the first is emitted. Such contribution from the Pb background is given approximately by the formula r/(+r), where r denotes the counting rate at a given x, y position on the IMP detector and is a decay constant that determines life time of the ER. Taking this into account we estimate the background contribution for the Z=90 case on the level of few %.
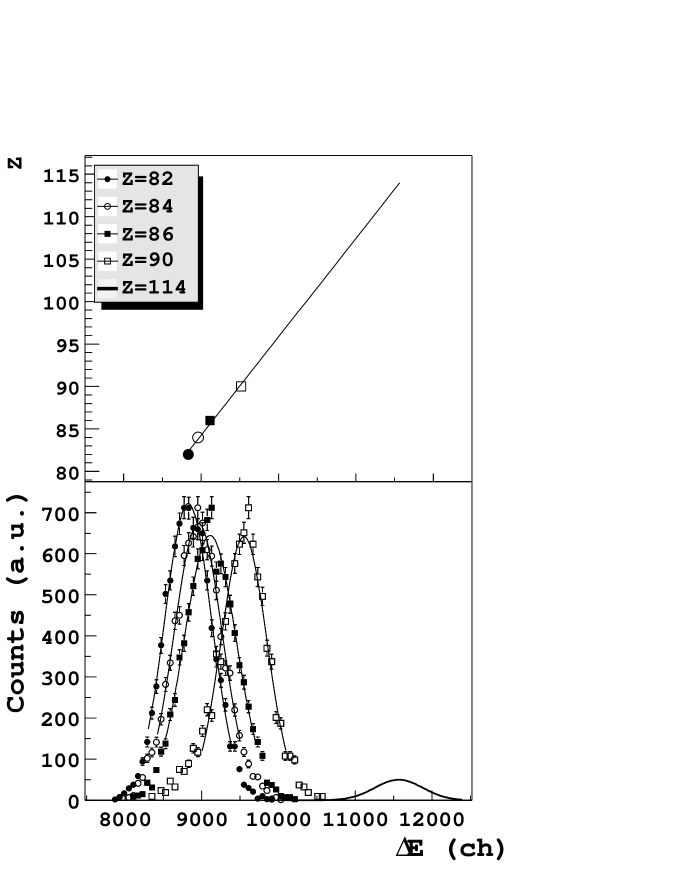
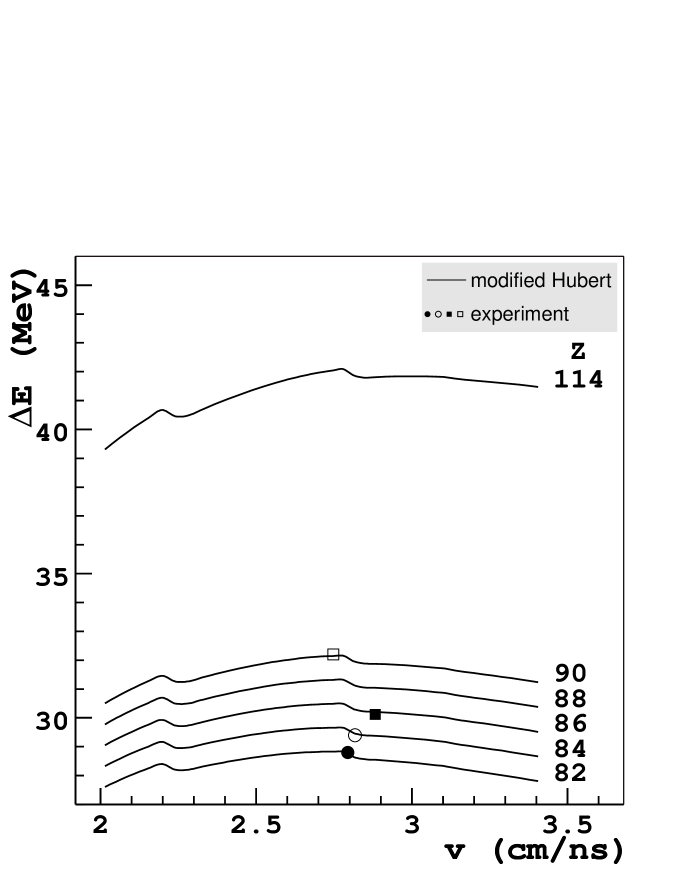
In fig.3 we present measured distributions of the energy loss for different nuclei. The empty squares are for Z=90, while full circles are for Z=82. Of course, the distribution for Z=82 (Pb) ions comes from the analysis of the Pb ions which pass the filter. Solid lines in the figure are gaussian fits. The FWHM for both cases is about 6%. Mean values extracted from two E distributions (Z=82, 90) are presented in the upper panel. The straight line is drawn to interpolate the region of Z’s between these two cases and also to extrapolate to higher elements. The energy loss is a function of the ion velocity but as it is shown on the fig.4 this dependence on the ion velocity is very weak in the considered energy region. So this line can be used as a “calibration” line.
For reactions on the carbon target, the compound nucleus is 220Ra∗ (E∗=23 MeV) and we tried to select chains to identify the ER’s, like for oxygen. But in this case the interpretation of the data is more complicated. In the expected chains following xn de-excitation after the compound nucleus formation, the 1n chain starting from 219Ra (half-life: 10ms) and ending at 211Po is easily identified. In addition, there are alphas with very short emission time, especially the first one in the 2n, 3n and 4n chains: 218Ra: 25.6 s, 217Ra: 1.6 s, 216Ra: 2/180 ns. If these chains are populated the alpha energy piles up with the ER kinetic energy pulse and they are missed by the IMP detector. Because of that we can only identify the emitters of the observed alphas and cannot identify the implanted ion. The incident energy we used was chosen for other targets and is a few MeV below the Bass barrier for fusion with 12C. Measurements of 3, 4 and 5 n channels were made at higher incident energies [11]. Extrapolation to our energy (4.85 MeV/u at mid-target) leads to expect less than a few mb in the 2n channel, i.e. 218Rn which we cannot identify. 1n and 3n channels could be present with much smaller cross sections. 1n (219Ra) could be identified but no event was found. The excitation energy is too low for feeding the 4n channel; anyway 215Ra has a quite convenient half-life (1.6 ms) but unfortunately its daughter 211Rn has a too long half-life: 14.6 days, so no chain could be seen. During the analysis the only events we could unambiguously identify were the alpha-chains going through 211Po or 213Rn. In the case of 211Po there are two possible candidates as implanted ER’s : 215Rn - residue from the two transfer reaction followed by evaporation of 1 neutron, or 211Po itself - residue from one transfer followed by evaporation of 1 neutron . For the 213Rn (25 ms) emitter the implanted father can be 217Ra (1.6 s) i.e. 3n channel after fusion or just 213Rn - from two transfer reaction. One can not affirm which scenario is the right one. For Rn the background contribution is negligible while for Po it is of the order of 20%.
In order to determine what was really implanted in these two cases we plot the energy loss distribution as shown in fig.3: open circles for implants associated with 211Po and full squares for implants which produce the 213Rn emitter. Mean values from these two distributions were then marked on the “calibration” line (upper picture in the same figure) assuming that open circles and full squares correspond to Z=84 and Z=86 respectively. These two points fit well on the line. In this way we may settle that the implanted nuclei are exactly the emitters which were identified from alpha-residue correlations. We conclude that, as expected, the fusion process has a low cross section at this energy. 1 or 2 alpha particle transfer reactions are favored (3 alpha structure of 12C).
In figure 3 we have put also the Gaussian line which corresponds to the nucleus Z=114. As one can see from the predicted location of the line the IC should be able to separate Z=114 from most actinide products.
5 Conclusions and remarks.
The specific thin ionization chamber, we developed, was found to be very useful and quite powerful for resolving ambiguities in the identification of some nuclei produced in reactions of 208Pb projectiles on a 12C target.
This detector will be used in experiments on the production of super-heavy nuclei via fusion reactions in inverse or symmetric kinematics. It will provide a signal related to the nuclear charge of the detected nuclei. Although element resolution is not achieved, this signal will make it possible to eliminate most of the ”background” of other reaction products. Also in inverse or symmetric kinematics, a large kinetic energy signal (several hundreds of MeV) will be obtained in the implantation detector. After calibration of this signal and of the time-of-flight with heavy projectiles and evaporation residues with known velocities, a rough value of the mass will be obtained. Together, these values of mass and charge will provide direct and immediate information on the implanted nucleus, independently of its subsequent decay, thus reducing very much the number of erroneous identifications and strongly improving the quality of the data.
Acknowledgments: The authors want to thank all the technicians and engineers who made it possible to overcome the specific difficulties of these experiments: the electronics, detectors and mechanics groups at LPC Caen, Ganil and Dapnia Saclay, the data acquisition group GIP Ganil, the users support group and the accelerator staff of Ganil for their continuous support and efficient performances. They are also indebted to the technicians of Smoluchowski Insitute of Physics and LPC Caen for their help during the construction and operation of the detector, and to the target laboratory of IReS Strasbourg and the isotope separator of CSNSM Orsay for the targets used in the experiments. This work was partly supported under the Polish-French IN2P3(CNRS)-KBN agreement contract no. 101-01.
References
- [1] S. Hofmann, V. Ninov, F. Heberger, P. Armbruster, H. Fogler, G. Münzenberg, H.-J. Schött, A. Popeko, A. Yeremin, A. Andreev, S. Saro, R. Janik, M. Leino, Z. Phys. A350, 277 (1995).
- [2] Y. Oganessian et al., Eur. Phys. J. A5, 63 (1999).
- [3] J. Péter et al., in: G. Fazio (Ed.), Nuclear Physics et Border Lines, World Scientific, Lipari (Italy), 2001, pp. 257–266.
- [4] V. Zlokazov, Eur. Phys. J. A8, 81 (2000).
- [5] K. H. Schmidt, Eur. Phys. J. A8, 141 (2000).
- [6] J. F. Ziegler, J. P. Biersack, U. Littmark, The Stooping And Range Of Ions In Solids, Vol. 1, Pergamon Press, 1985.
- [7] F. Hubert et al., Nucl. Ins. Meth. B36, 357 (1989).
- [8] J.B.A. England, Techniques in Nuclear Structure Physics, Mac Millan Press (Ed.), 1974.
- [9] Z. Sosin, T. Kozik, Z. Majka, Nucl. Instr. Meth. A351, 383 (1994).
- [10] K. Łojek, Report from Institute of Physics, Jagellonian University: in preperation.
- [11] T. Nomura, K. Hiruta, T. Inamura, M. Odera, Nuc. Phys. A217, 253 (1973).
Figure captions.
Fig.1 Schematic view of the experimental setup. Reaction chamber, two halves of the Wien filter as well as detection set-up is depicted here. Details of detection chamber are presented on the right panel. The left panel sketches more detailed construction of the ionization chamber: three wires planes cathode-anode-cathode and schematic electronics.
Fig.2 Energies of two detected particles from the radioactive decay chains. The chains are identified from the condition that ’s are emitted from the same position as an ER implanted in the strip detector (IMP). Observed groups of events (chains) come from two ERs: 221Th and 223Th. The arrows in figure denotes ’s which come from parent 223Th or 221Th, daughter 219Ra, grand-daughter 213Rn, and grand-grand daughter 211Po nuclei. 208Pb+18O reaction.
Fig.3 Lower panel: measured distributions of E signals for ions with different Z’s. Full circles present energy loss distribution for Z=82 while empty squares are for Z=90. Distribution denoted by empty circles and full squares are attributed (see text) to Z=84 and Z=86 respectively. The spectra were fitted with a gaussian to get the mean value and FWHM of E for each distribution. In the upper panel the extracted mean values of E for each identified Z are presented. “Calibration” line shown in this panel is drawn through two points Z=82 and Z=90. It extrapolates to higher values of atomic number. The curve marked as Z=114 (lower panel) presents the predicted location of E signals for this super-heavy element.
Fig.4 Energy loss in the ionization chamber for ions with atomic numbers marked in the figure as a function of their velocity, full lines. Calculation were done with a modified version of Hubert code. Symbols in the figures are experimental values of mean E for ions from fig.3. They were normalized in the way that measured mean E for Z=82 corresponds to the calculated one.