Measurement of radium concentration in water with
Mn-coated beads at the Sudbury Neutrino Observatory
Abstract
We describe a method to measure the concentration of \nuc224Ra and \nuc226Ra in the heavy water target used to detect solar neutrinos at the Sudbury Neutrino Observatory (sno) and in the surrounding light water shielding. A water volume of (50–400) m3 from the detector is passed through columns which contain beads coated with a compound of manganese oxide onto which the Ra dissolved in the water is adsorbed. The columns are removed, dried, and mounted below an electrostatic chamber into which the Rn from the decay of trapped Ra is continuously flowed by a stream of N2 gas. The subsequent decay of Rn gives charged Po ions which are swept by the electric field onto a solid-state counter. The content of Ra in the water is inferred from the measured decay rates of \nuc212Po, \nuc214Po, \nuc216Po, and \nuc218Po. The Ra extraction efficiency is 95%, the counting efficiency is 24% for \nuc214Po and 6% for \nuc216Po, and the method can detect a few atoms of \nuc224Ra per m3 and a few tens of thousands of atoms of \nuc226Ra per m3. Converted to equivalent equilibrium values of the topmost elements of the natural radioactive chains, the detection limit in a single assay is a few times g Th or U/cm3. The results of some typical assays are presented and the contributions to the systematic error are discussed.
keywords:
radioactivity assay \sepwater purification \sepsolar neutrino \sepSNO \PACS29.40.-n \sep26.65.+t \sep81.20.Ym, , , , , ,∗, \corauthCorresponding author. Address: SNO Project, PO Box 159, Lively, Ontario P3Y 1M3, Canada. , , , , ††thanks: Present address: Department of Physics and Astronomy, Laurentian University, Sudbury, Ontario P3E 2C6, Canada , , , , , , , , , , , , , , , , , , , , , , , and
1 Introduction
All experiments to detect solar neutrinos have observed significantly fewer than are predicted by well calibrated solar models. It is now recognized, after publication of the first results of the sno experiment [1], that this deficit is the result of the transformation of the electron neutrino into other neutrino species. A crucial element of the sno experiment is the verification that the rates of background processes that might be misinterpreted as neutrino events are significantly less than the observed signal. We describe here one of the procedures used to measure the radioactivity content of the water in the sno detector and thus to prove that the background is adequately low.
This article is structured as follows: after giving a general description of the sno experiment, the various aspects of the background measurement technique based on Mn-coated beads are described. Then the methods for measuring the Ra extraction efficiency and the Po counting efficiency are considered, followed by a discussion of systematic errors. Finally representative results of using the method to measure the Ra concentration in the heavy and light water of the sno detector are given.
1.1 Overview of the sno detector
The main neutrino target of the Sudbury Neutrino Observatory [2] is 1000 tonnes of D2O contained in a transparent spherical acrylic vessel of 12 m diameter. An array of 9438 inward-looking photomultiplier tubes with light collectors are located on a nearly water-tight icosahedral support structure at 3 m distance from the central vessel. They see the Cherenkov light from neutrino interactions in the D2O and in part of the 1700 m3 of H2O which fills the volume between the acrylic vessel and the photomultipliers. An additional 5700 m3 of H2O between the photomultipliers and the cavity wall provide further shielding from external radiation.
Solar neutrinos are detected in sno through three distinct reactions:
| (CC), | ||||
| (NC), | ||||
| (ES), |
where denotes any of the active neutrino species . The charged-current reaction (CC) observes only electron neutrinos, the neutrino type produced in the Sun. The neutral-current reaction (NC) detects the total flux of active neutrinos and has equal sensitivity to all flavors. The elastic-scattering reaction (ES) also detects all active neutrinos, but is dominantly sensitive to neutrinos of the electron type.
1.2 Upper limits on radioactive contamination
The most restrictive limits on D2O purity arise by considering the background for the neutral current reaction. The main unvetoed background for this reaction is the photodisintegration of the deuteron, , whose threshold is 2.22 MeV. The only commonly occurring natural isotopes which emit rays above this energy are near the end of the Th and U decay chains, viz., \nuc208Tl, 99.8% of whose decays produce a 2.614-MeV ray, and \nuc214Bi, 2.15% of whose decays are accompanied by a ray with energy greater than 2.22 MeV. If we require that the rate of neutron production by radioactive background be less than 1 per day, which is less than 10% of the anticipated signal, then, based on our Monte Carlo for the response of the detector to internal rays, we set the goal of restricting the decay rate of \nuc208Tl and \nuc214Bi in the D2O of the sno detector to less than 480/day and 32 000/day, respectively. Assuming radioactive equilibrium in the Th and U chains, this leads to upper limits of 4.2 g Th/cm3 D2O and 3.3 g U/cm3 D2O. 111It is of course not true that the Th and U chains are in equilibrium in the water of the sno detector all the way back to long-lived \nuc232Th and \nuc238U, but it is conventional in low-background counting to express radioactivity measurements as if equilibrium were present, and we follow this practice here. At these limits there is an average of 1.5 atoms of \nuc208Tl and 640 atoms of \nuc214Bi in the entire D2O volume.
The requirements on radiochemical purity of the H2O in the sno detector are determined by the ingress of rays into the D2O region that are produced by the decay of \nuc208Tl or \nuc214Bi in the surrounding light water. Based on our early simulations for the transport of rays and assuming equilibrium, this leads to upper limits of 3.7 g Th/cm3 H2O and 4.5 g U/cm3 H2O for the water in the region between the acrylic vessel and the photomultiplier tubes, considerably less severe than required for the D2O.
Four complementary techniques have been developed by sno to determine if the detector water meets these specifications. Three methods are based on flowing water to an external extraction system where a chemical separation of Ra, Th, or Rn is performed; the other method uses the Cherenkov light signals from the photomultipliers to directly infer the concentrations of \nuc214Bi and \nuc208Tl. The first of the extraction methods, the MnO assay method, is the subject of this paper. The second radiochemical method, which is described in a companion paper [3], flows water over a filter coated with an adsorber of hydrous titanium oxide. After water flow, the filter is eluted with acid to remove the extracted Ra, Th, and Pb. These elements are then concentrated, mixed with liquid scintillator, and the – coincidences of \nuc212Bi–\nuc212Po and \nuc214Bi–\nuc214Po are detected with a photomultiplier. In the third chemical assay method, water from the detector is flowed through a degasser to liberate Rn. The Rn is purified and collected and its alpha decays are counted in a Lucas cell scintillator chamber on a photomultiplier [4]. This method can detect only the U-chain isotope \nuc222Rn.
2 The MnO assay method
In overview, water is passed through columns that contain beads coated with a manganese oxide compound. The coating extracts Ra from the flowing water, and, to a lesser extent, other dissolved species, such as Th, Pb, etc. [5]. After a large volume of water has passed through the columns, they are removed and dried. The Rn produced from Ra decay is swept from the columns into an electrostatic chamber where it decays. The charged Po ions from the decay of Rn are carried by an electric field onto an alpha counter where the decays of the Po are detected.
In this section we describe all the components of the MnO assay method as used in sno, from the MnO coating onto acrylic beads, the column which holds the beads during an assay, the system that flows water through the column, the apparatus for counting the column, the physical interpretation of the data, and the way in which the data are analyzed.
2.1 Beads and Mn coating
Solid spherical acrylic beads of 600 m nominal diameter were chosen as the support material. These beads have good mechanical strength, little water uptake, low intrinsic content of radioactive elements [6], good resistance to the production of fine particulate material (fines), and good Rn emanation efficiency.
Tests of Ra extraction efficiency and retention, Rn emanation, and fines production were carried out with two forms of coatings, designated MnO2 and MnO. The MnO2 coating was produced by prolonged oxidation of the beads with sodium permanganate in the presence of sulfuric acid at high temperature. This yields a black coating on the bead surface. The MnO coating is obtained by incomplete oxidation with the same reagents, and gives a dark brown coating. It was selected for our purpose as the Rn emanation efficiency was higher than with MnO2. The exact stoichiometry has not been determined so we call it MnO.
The procedure for bead production with MnO coating is described in [7]. Electron microscopy reveals that the coating consists of a base layer that is parallel to the surface and needles of (0.3–0.5) m length oriented approximately perpendicular to the surface. The average coating density is g Mn/m2. The radioactive background of one sample of coated beads was measured with a Ge -ray detector [8] to be 90 ng Th/g beads and ng U/g beads.
The ability of the beads to retain adsorbed Ra was measured by spiking a column with \nuc226Ra, measuring its initial activity , flowing a volume of water through the column, and measuring the activity that remained on the column. These tests were conducted on small-scale analogues of our columns used in extraction with flow rates of 20 column-volumes per min and the activity was measured with a Ge -ray detector. The results of these measurements can be described in terms of an effective distribution coefficient defined as
| (1) |
where is the volume of the beads in the column. Up to , was found to be 106 with an error of approximately 25%. This implies there is little concern regarding loss of Ra from a one liter column at a flow rate of 20 /min222To avoid confusion with the number 1, we use the symbol “” as an abbreviation for ‘liter.’ up to water volumes of at least 170 k.
Not only do the beads adsorb Ra, but they also have an affinity for other elements, such as Ba. By flowing a large volume of Ba solution over a fixed volume of MnO-coated beads and measuring the Ba concentration of the eluate, the capacity of the coated beads to hold Ba was determined to be 300 mg Ba/ beads. The capacity for Ra should be comparable as it also is a divalent atom and has only slightly greater radius. The other divalent atoms and monovalent atoms have a smaller affinity for MnO. The water in the sno detector does not contain such large quantities of impurities that there is any problem with the bead capacity.
2.2 Column
During a water assay and subsequent counting, the coated beads are held within a column made from polypropylene. The internal column volume is 950 cm3 and it is filled with g of coated beads which contain approximately 3.5 g of Mn.
Before a column is used it is dried and counted for background. This is done in the same way as after the column has been used in an experiment and will be described below. We call this measurement the column ‘blank.’ When counting is finished, which takes at least 10 days, the column is filled with nitrogen, its ends are capped, and it is brought underground for the assay.
To maintain the isotopic purity of the heavy water, columns for a D2O assay are deuterated before use. This is done by flowing 3 of D2O through the column with a peristaltic pump at 150 cm3/min until the density of the water that exits the column is 1.103 g/cm3. (The density of pure D2O at 20C is 1.105 g/cm3.) To reduce the entry of fines into the water, columns are then rinsed at a rate of 20 /min for 15 min.
2.3 Water flow
Most H2O assays use a sampling point halfway between the acrylic vessel and the photomultipliers as it is this region of H2O that contributes most to the neutral-current background. Assays of the D2O usually draw water from the vessel bottom and return it near the vessel top. The H of the H2O is 5.8–6.0 and the D of the D2O is 5.5–5.8. All water entering the detector is cooled; the temperature of the D2O and the immediately surrounding H2O is (10.5–11)C.
After the column is attached to the water system it is evacuated so that the ingress of \nuc222Rn to the system is minimized. The usual water flow rate through an MnO column is 20 /min. To allow the sampling of very large volumes of water, and thus to achieve greater sensitivity, assays of the D2O are usually made with 4 columns through which the water flows in parallel with 20 /min through each.
All water that has flowed through an MnO column is passed through ultrafilters that remove tiny particulates (fines). If MnO fines were to be carried into the acrylic vessel, they would bind there with Ra and remove it from future assays, thus leading to an underestimation of the true Ra content of the water. The ultrafilration units have a 3 kiloDalton molecular weight cutoff (approximately 3 nm). Their permeate flow returns to the water system; their concentrate flow is passed through a 0.1 m filter and then returned to the feed stream of the MnO column.
Since a very large volume of water is passed through the column, there is a concern that some Mn may be dissolved and enter the water. An indication that some loss of Mn occurs is provided by the visual observation that the bead color sometimes changes from its initial dark brown to light brown after water flow. This effect is most evident on the end of the column where the water enters. To address this question, experiments have been made in which H2O at H 7 was recirculated from a 1 m3 tank through a column and the concentration of Mn measured as a function of flow volume by inductively-coupled plasma mass spectrometry [9]. Very little Mn was found, even up to water volumes of 115 m3. Using this data and measurements of the mass of Mn remaining on the beads after their use in an extraction, it appears that a few tens to hundreds of mg of Mn are removed from a column in a large volume assay. Most of this Mn is in the form of fines which are blocked from entering the detector by the ultrafilter that follows the MnO columns. Very little of the released Mn is in dissolved form: measurements of the D2O in the acrylic vessel show an increase in Mn concentration from an initial value of 0.5 ng/cm3 to 2.0 ng/cm3 during the pure D2O phase, a period in which 61 MnO columns were used in assays. This increase in Mn concentration has not deleteriously affected the operation of the sno detector.
2.4 Column drying and counting
When an assay has been completed, the columns are removed, their ends are capped, and they are brought to a surface laboratory where they are dried and counted. Either air or boil-off gas from liquid N2 is used for drying. The gas is filtered and heated to 60C. A volume of 25 m3 is used to dry a wet column from an assay; 10 m3 is sufficient for an initially dry column, as when counting a blank before use in an assay.
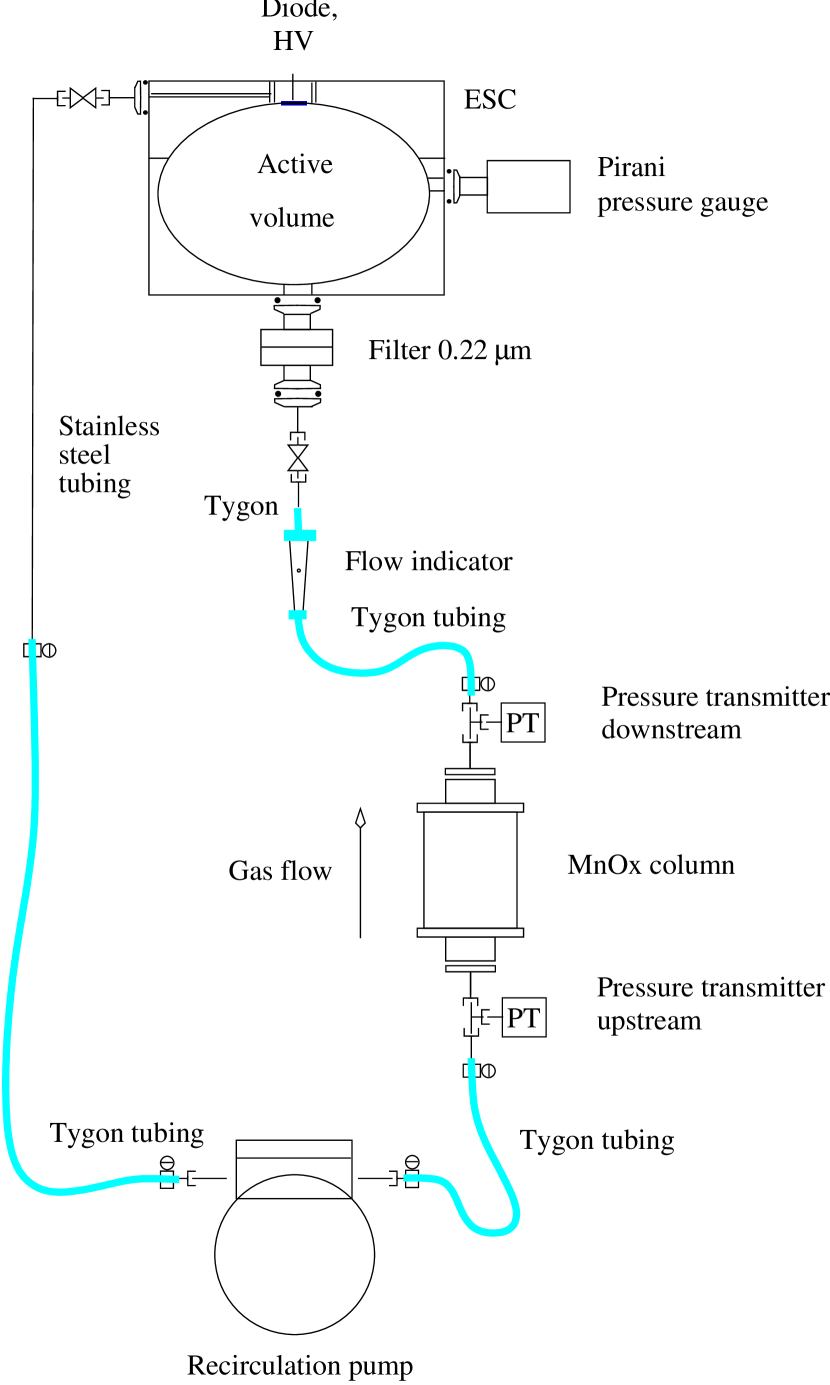
The Ra activity on the columns is measured by attaching the dried column to the gas flow loop on an electrostatic counter (ESC), as shown in Fig. 1. To remove Rn and residual water vapor, the counting loop is initially filled with dry N2 from a compressed gas bottle and evacuated several times. The loop is then pressurized to mbar with dry N2 which acts as a carrier gas to transport Rn from the column to the ESC. The total elapsed time between the end of extraction and the start of counting is typically (10–12) hours.
The internal shape of the ESC chamber was designed [10] to sweep the positively charged Po ions from Rn decay onto an alpha detector at the apex of the chamber with high efficiency throughout its volume. The alpha counter is an 18 mm by 18 mm windowless silicon photodiode operated at a bias voltage of (60–69) volts. The diode is held at a potential of 1000 volts below that of the aluminum chamber. The output of the diode is amplified, digitized in 1024 channels, and written to disk every 3 hours. Counting is continued for (10–30) days. Long counting times are essential in D2O assays to well determine the \nuc228Th activity.
Fig. 1 shows the counting configuration for a single-column assay. When 4 columns are used they are attached to the gas flow loop in parallel in the same position as with one column. The gas is circulated with a diaphragm pump at a typical flow rate of (0.3–0.4) STP /min. The filter just below the ESC blocks the entry of fines to the chamber and is the major impediment to gas flow.
Most of the Ra from a water assay is located near the top of the column where the water enters. To give the highest efficiency for the transport of Rn to the active ESC volume, especially the short-lived \nuc220Rn, the gas flow through the column is thus opposite to the previous direction of water flow.
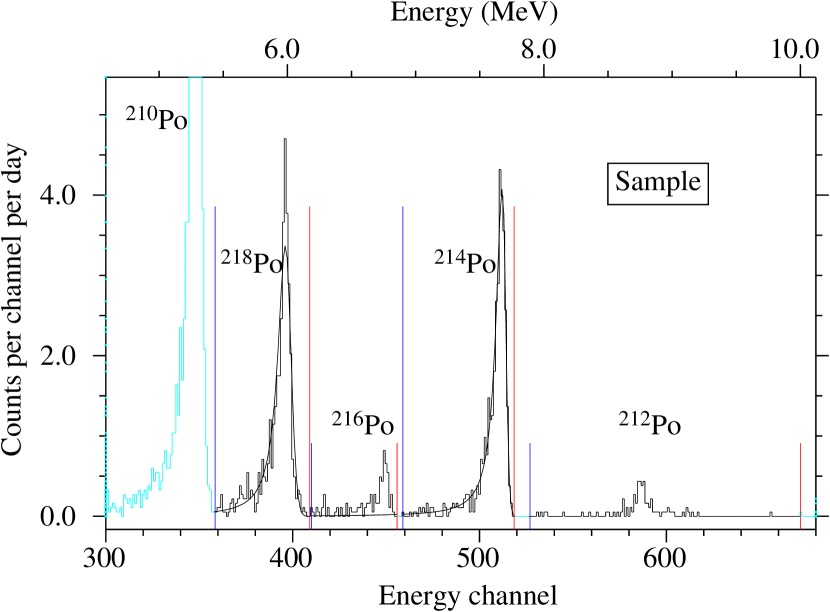
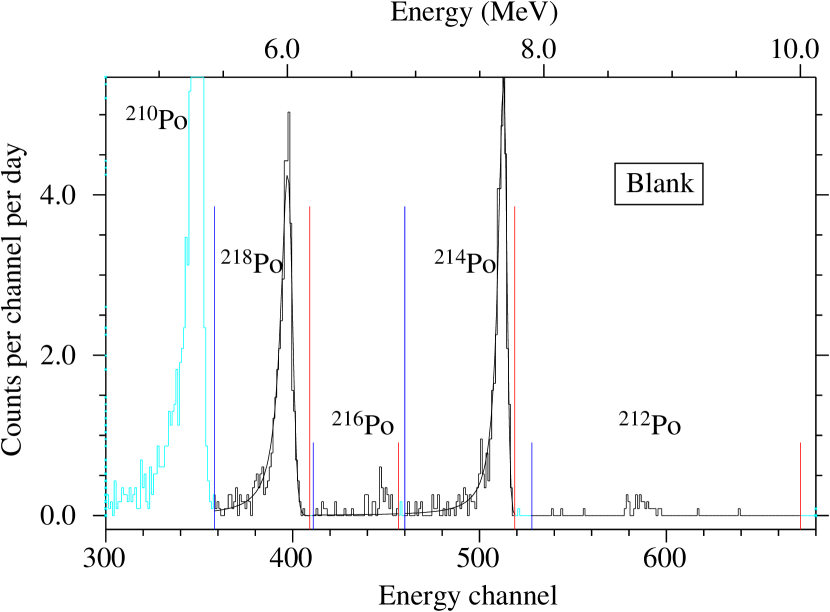
Energy spectra from the detector at the end of counting of a typical assay are given in Fig. 2. The lower panel shows the spectrum of the blank before passing water through the column; the upper panel shows the spectrum of the sample after water flow. Because the particles lose energy as they pass through the surface dead layer of the diode, each Po peak falls gradually on the low-energy side, but much more steeply on the high-energy side.
2.5 Interpretation of energy spectra
Since it is Po produced by the decay of Rn that is detected, we look backward from Rn along the Th and U chains to the last isotope whose half life is considerably longer than the usual (10–15) day counting period. This leads to 1.9-y \nuc228Th in the Th chain and 1600-y \nuc226Ra in the U chain. If any prior elements in either chain are present, their influence is effectively blocked by these long-lived isotopes.
The relevant part of the Th decay chain and the energies of the particles that follow Rn is thus \nuc228Th \nuc224Ra \nuc220Rn \nuc216Po \nuc212Pb \nuc212Bi \nuc212Po \nuc208Pb, which is stable. The next to last decay here takes place 64% of the time; the other 36% proceed through \nuc212Bi \nuc208Tl \nuc208Pb. The major peaks from Th are thus \nuc216Po and \nuc212Po, as labeled in Fig. 2. The 6.1-MeV from \nuc212Bi makes an unresolved peak near the upper edge of the much stronger \nuc218Po peak. The window for \nuc212Po decay is set very wide to include the detection of the 2.2-MeV endpoint energy electron from \nuc212Bi decay in coincidence with the 8.8-MeV from \nuc212Po decay.
The section of the U chain of interest is \nuc226Ra \nuc222Rn \nuc218Po \nuc214Pb \nuc214Bi \nuc214Po \nuc210Pb. The chain is completed by \nuc210Pb \nuc210Bi \nuc210Po \nuc206Pb, which is stable. Fig. 2 shows the major peak regions due to \nuc218Po and \nuc214Po in a U-dominated spectrum. Although the \nuc210Po peak is also a part of the U chain, it cannot be used in analysis as it represents the gradual accumulation on the diode of long-lived \nuc210Pb from the counting of previous assays, tests, etc.
Because the concentration of \nuc226Ra as an impurity in the ESC loop is higher than that of \nuc228Th, and the counting efficiency for \nuc222Rn is higher than that of \nuc220Rn, all low-level spectra are U-dominated, rather than Th-dominated. Thus, the relative heights of the peaks in a single spectrum do not reflect the relative concentrations of \nuc226Ra and \nuc224Ra in the water.
Note in Fig. 2 that the \nuc216Po and \nuc212Po peaks are somewhat higher in the sample spectrum than in the blank spectrum. This increase occurs because the column extracted \nuc224Ra from the flowing water. In contrast, the \nuc218Po and \nuc214Po peaks are higher in the blank than in the sample. This difference is not because significant \nuc226Ra was lost during water flow; rather, it is due to the presence of more \nuc222Rn in the ESC loop when counting of the blank was initiated than when counting of the sample began.
2.6 Data analysis
The counting data are analyzed in three steps: In the first step, the energy spectra are fit, energy windows are set about the four Po peaks, and the number of counts in each energy window is determined as a function of time. The second step is to fit these time spectra to determine the decay rates of the isotopes that produce the counts. These two steps are done separately for the blank and for the sample. In the third step, the isotope decay rates for sample and blank and the water flow rate are used to determine the concentration of \nuc224Ra and \nuc226Ra in the water.
| Value | ||
|---|---|---|
| Item | Blank | Sample |
| Live time (days) | ||
| Counts in \nuc218Po window | ||
| Counts in \nuc216Po window | ||
| Counts in \nuc214Po window | ||
| Counts in \nuc212Po window | ||
| Peak height (counts) | ||
| \nuc218Po | ||
| \nuc214Po | ||
| Peak location (channels) | ||
| \nuc218Po | ||
| \nuc214Po | ||
| Width of Lorentzian (keV) | ||
| below \nuc218Po | ||
| below \nuc214Po | ||
| Width of Gaussian (keV) | ||
| above \nuc218Po | ||
| above \nuc214Po | ||
| Overlap of \nuc214Po into \nuc216Po (%) | ||
| Window efficiency for \nuc218Po (%) | ||
| Window efficiency for \nuc216Po (%) | ||
| Window efficiency for \nuc214Po (%) | ||
| Window efficiency for \nuc212Po (%) | ||
2.6.1 Energy spectrum analysis
The final accumulated spectrum is first passed through a peak recognition algorithm which identifies the various peaks. Once the peaks are recognized, a fit is made to the two principal peaks, either \nuc212Po and \nuc216Po for a Th-dominated spectrum or \nuc214Po and \nuc218Po for a U-dominated spectrum. The energy scale is then set by a linear interpolation from the two principal peak positions and the four energy windows are set based on the fitted peak parameters. Finally, the number of counts in each window in each 3-hour interval is written to a file for subsequent analysis.
This process is illustrated with the sample energy spectrum in Fig. 2. The principal peaks are \nuc214Po and \nuc218Po, so this is a U-dominated spectrum. The solid line is the fit to the \nuc214Po and \nuc218Po peaks. Table 1 gives the fitted parameters and other data for these spectra. The \nuc218Po window is set so that its lower limit removes the \nuc210Po peak and its upper limit fully includes the \nuc212Bi contribution.
This figure also shows one practical complication: although the resolution is good, it is not high enough to totally separate the peaks. As a result, each peak makes a contribution to the peaks at lower energy [10]. The extension of the fitted line in Fig. 2 below the \nuc214Po peak indicates the overlap of \nuc214Po into the \nuc216Po energy window. Usually (1–2)% of the counts in each window appear as overlap counts in the adjacent lower energy window. Although this fraction is small, overlap can be an appreciable effect. For example, since the \nuc214Po peak of the spectrum of the blank in Fig. 2 contains 475 counts and the overlap is 1.1%, approximately 5 of the counts in the \nuc216Po window are from overlap, more than 10% of the total of 45 counts in this window.
A fit function that was found to adequately approximate the shape of each Po peak is a Gaussian above the maximum and a Lorentzian below the maximum. If the peak height is and the center (maximum) is at , the number of counts at energy is then
| (2) |
where is the width (standard deviation) of the Gaussian and is the width (FWHM) of the Lorentzian. Based on the Poisson probability for detecting counts in an energy bin that contains counts, , the likelihood function is defined as
| (3) |
where the product is over all the energy bins in the window. In practice the fit is made by searching for the set of parameters that minimize the negative logarithm of ,
| (4) |
where the constant term has been neglected. The two peaks are fit independently and three passes are made through the fit routine, with each pass gradually refining the four peak parameters and , and resetting the window limits. After the last pass, 68% confidence regions on the parameters are calculated by finding the values of each parameter that increase by 0.5, all other parameters being maximized.


Finally, the number of counts in each of the 4 energy windows for each time interval is determined, the best fit parameters are used to calculate the overlap and energy efficiency for each window, and all of these calculated values are written to an output file.
2.6.2 Time spectrum analysis


Examples of time spectra from the last step of energy analysis of the data in Fig. 2 are shown in Fig. 3 for the \nuc226Ra-originated components and in Fig. 4 for the \nuc228Th-originated components. Fits to these spectra are given by solid curves with dashed lines above and below the fit that indicate the range of the fit based on the statistical 68% confidence limits for the derived parameters. The fit to the spectra contains four components for \nuc214Po and \nuc216Po, two components for \nuc212Po, and six components for \nuc218Po. The major components of the fit are separately shown by the rising and falling thin solid lines. The physical basis for these fits and the time functions used in fitting [11] will now be briefly described.
U chain
The U chain is the simpler case and will be discussed first. The observed Po isotopes, first \nuc218Po and then \nuc214Po, are produced by two sources:
-
The decay of \nuc222Rn that was entrapped during exposure of the column and sections of the ESC counting loop to air. Neglecting any permeation of Rn into the loop, the decay rate of this component begins at some positive value and falls with the 3.82-day half life of \nuc222Rn. At time the instantaneous decay rate has the form , where is related to the initial number of \nuc222Rn atoms and is the decay constant of \nuc222Rn. This component is shown in the spectrum of \nuc218Po by the thin falling line in Fig. 3. The initial amplitude depends on the extent of pumpout before the start of counting. Note that in this example there was more trapped Rn in the blank than in the sample. The time development of this component is somewhat different in the spectrum of \nuc214Po–there is a delay at the start of counting because of the need to build up the daughter elements 26.8-min \nuc214Pb and 19.9-min \nuc214Bi. This leads to an initial rise in \nuc214Po count rate before the fall begins.
-
The decay of \nuc226Ra. \nuc226Ra originates from two sources: (1) Ra extracted from the water and (2) contamination with Ra of all the components of the ESC loop, viz., the beads, the MnO coating, the column, the detector walls, etc. These sources are separated by counting the column both before and after extraction and taking the difference. This component has the time dependence in the \nuc218Po spectrum where is related to the initial number of \nuc226Ra atoms. It is shown by the thin rising lines in Fig. 3.
Th chain
The parent isotopes that produce the observed \nuc216Po and \nuc212Po counts are \nuc228Th and \nuc224Ra. These spectra also originate from two sources:
-
The decay of \nuc224Ra that (1) was produced by the decay of \nuc228Th and (2) was extracted from the water. Since it is the latter that we wish to determine, the column is counted before and after extraction. In the spectrum of \nuc216Po this component has the time dependence where is related to the initial number of \nuc224Ra atoms and is the \nuc224Ra decay constant. It is shown in Fig. 4 in the spectrum of \nuc216Po by the thin falling line. In the spectrum of \nuc212Po it is the component that gradually rises to a peak at about 1.5 days after the start of counting and then falls with the \nuc224Ra half life. The initial rise in the \nuc212Po spectrum is because of the delay in production of the 10.6-h daughter \nuc212Pb from \nuc224Ra.
-
The decay of \nuc228Th. The \nuc228Th is present as a contaminant in the constituents of the ESC loop and, to a small extent, may be extracted from the water. This term is shown in the spectra of Fig. 4 by the thin rising line. In the \nuc216Po spectrum the time dependence is where is related to the initial number of \nuc228Th atoms. The time dependence in the \nuc212Po spectrum is again delayed by the need to build up \nuc212Pb.
Estimation of activities
Both decay chains are examples of the general case whose solution is [12]
| (5) |
where is the number of atoms of species at time and the initial condition for all is imposed. The number of decays of species during a counting interval that begins at time and ends at time is thus
| (6) |
where and is the product in Eq. (5). Introducing the detection efficiency for isotope and defining the activity of isotope to be , the number of detected counts of species due to parent isotope 1 during the counting interval from to is
| (7) |
Defining as the initial activity of \nuc222Rn and as the initial activity of \nuc226Ra, Eq. (7) is applied in the U chain to obtain the number of counts of \nuc218Po and \nuc214Po in each counting interval. Similarly, defining as the initial activity of \nuc224Ra and as the initial activity of \nuc228Th, Eq. (7) is used in the Th chain to obtain the number of counts of \nuc216Po and \nuc212Po in each counting interval. Because their half lives are much shorter than the 3-hour interval on which data is recorded, we make the approximation that the 55.6-sec \nuc220Rn and 0.15-sec \nuc216Po decays occur immediately after the \nuc224Ra decay.
In addition to these major terms, there are several additional components, whose amplitudes are relatively small, which also contribute to the time spectra: Except for \nuc212Po, each Po isotope has an overlap contribution from the adjacent Po isotope at higher energy in the spectrum. These terms are added onto the expression for , using for \nuc216Po the overlap fraction measured when Rn gas is added to the ESC loop, and for \nuc214Po and \nuc218Po the overlap fraction measured when a Th source was in the ESC loop. Finally, for \nuc218Po, a term is added to to take account of the contamination of \nuc212Bi. The relative amplitude of this component is approximately determined by the 36% branching fraction of \nuc212Bi to \nuc208Tl and was checked by fits to data with a Th source. All these additional terms are included in the fitted total spectra shown in Figures 3 and 4, but for clarity only the major terms are illustrated.
For each of the four Po isotopes a likelihood function is formed which is identical to Eq. (3) with the factor replaced by the expression for the total number of predicted counts in Eq. (7) and the product taken over all time intervals . The grand likelihood function is defined as the product of these individual likelihood functions for \nuc212Po, \nuc214Po, \nuc216Po, and \nuc218Po. The fit is made by solving for the four variables , , , and that maximize the grand likelihood function and the parameter confidence regions are found using the same prescription as described earlier for the energy spectrum. In the spectra from a blank the \nuc224Ra and \nuc228Th are in equilibrium so the additional constraint is imposed. In making the fits, negative values of the parameters are not allowed, since they correspond to an unphysical regime.
The final step of time spectrum analysis is to determine the goodness of fit between the fitted spectra and the data. For the set of 4 spectra, the Poisson likelihood goodness of fit parameter defined in [13], is calculated, where the sum is over all time intervals and is the number of observed counts in interval . Since there are usually very few counts in each of the 3-hour data intervals, the probability distribution of this parameter is not the same as that of the standard distribution, but must be obtained by simulation. This is done by making a large number of simulations, each of them based on the best fit parameters. Each simulation is then fit to obtain new parameters and the value of is calculated. This determines the distribution of for data with the same average number of counts per interval as in the real data. The probability level is then set by the placement of the value of from the real data in the distribution from simulation, a procedure analogous to that described in [14].
| Value | ||
| Item | Blank | Sample |
| Number of counting intervals | 92 | 146 |
| Counting efficiency (%) | ||
| \nuc212Po | 4.4 | 4.4 |
| \nuc214Po | 16.4 | 16.3 |
| \nuc216Po | 4.1 | 4.1 |
| \nuc218Po | 15.1 | 15.1 |
| Activity at start of counting (decays/day) | ||
| \nuc224Ra | 76 | 278 |
| \nuc228Th | 76 | 93 |
| \nuc226Ra | 313 | 280 |
| \nuc222Rn | 184 | 69 |
| Goodness of fit probability (%) | ||
The results of fitting the spectra in Fig. 3 and 4 are given in Table 2. The values used for counting efficiency are discussed in Section 4. There is considerably more \nuc224Ra in the sample than in the blank, implying that \nuc224Ra was extracted from the water. Within errors the \nuc228Th activity is the same in both sample and blank, indicating that little Th was extracted. The disparity in \nuc222Rn content shows that there was much less Rn in the column for the sample than in the blank. Surprisingly, there is also slightly less \nuc226Ra in the sample than in the blank, implying that some \nuc226Ra may have been leached from the column. A loss of Ra of this magnitude is consistent with Eq. (1). The fits to both sample and blank spectra are quite acceptable, as indicated by the goodness of fit probabilities.
The results of this example are very much like those of an average assay. Typical values for the activities when 4 blank columns are counted are 75 decays of \nuc224Ra per day and 250 decays of \nuc226Ra per day, with a variation of 20% and 40%, respectively. These should be compared with measured activities when the ESC loop is counted with no columns present, but the loop closed with a dummy insert, in which case the typical activities are 10 decays of \nuc224Ra per day and (150–200) decays of \nuc226Ra per day.
2.6.3 Concentration calculation
We will now relate the deduced activities of \nuc224Ra and \nuc226Ra, and , respectively, to the concentration of Ra in the water. The first step is to determine the net activity of the sample after subtraction of the blank activity, defined as
| (8) |
where is the activity at the start of counting (SOC) of the sample and is the activity at the start of counting of the blank, as calculated by the fit procedure in Section 2.6.2. The exponential factor in this equation decays the blank activity from the time of counting the blank to the time of counting the sample, which assumes that the blank activity is not supported by elements higher in the chain. This equation applies for both \nuc224Ra, in which case is the decay constant of \nuc228Th, and \nuc226Ra, in which case is the decay constant of \nuc226Ra. Since the time from blank counting to sample counting is usually much less than the half life of the supporting isotope, the exponential factor is close to unity.
A special case arises for \nuc224Ra: if the \nuc228Th activity of the sample exceeds that of the blank, then there is evidence that \nuc228Th was extracted from the water. In this case it is necessary to subtract from given by Eq. (8) an additional term. See [7] for details.
During the extraction process, the number of atoms of Ra extracted from the water and adsorbed on the column is governed by the differential equation
| (9) |
where is the extraction efficiency and is the flow rate. The concentration is assumed here to be a constant. Since our assays are made in recirculation, to satisfy this assumption we must return the water to a point in the vessel that is far from the sampling point and the volume of water that is sampled must be less than the total vessel volume. The general solution of Eq. (9) under the initial condition is
| (10) |
The extraction process is often interrupted and the flow rate may not be constant. To model these changes, we break up the extraction time into intervals during each of which the flow rate is constant at the value . If we define the beginning and ending times of flow interval to be and , respectively, then the number of Ra atoms that were extracted from the water and present on the column at the start of counting is , where
| (11) |
is called the flow-saturation factor. has units of volume. From the definition of activity, , we obtain the Ra concentration
| (12) |
As derived here the units of are Ra atoms per unit volume of water. It is more customary to express the results in terms of the parent isotopes at the top of the decay chains, assuming equilibrium. This implies in the Th chain , where is the concentration of \nuc232Th, and in the U chain where is the concentration of \nuc238U. Further, we convert to the more common units of mass per unit volume and remove the isotopic fraction of \nuc232Th and \nuc238U. This gives the final concentration of Th, , and of U, ,
| (13) |
where the activity is in decays per day and is measured in k.
| Value | ||
|---|---|---|
| Item | \nuc224Ra | \nuc226Ra |
| Exponential factor in Eq. (8) | ||
| Net activity (decays/day) | ||
| Flow-saturation factor (k) | ||
| Decay constant | ||
| Extraction efficiency (%) | ||
| Ra concentration (atoms/k) | ||
| Parent conc. (10 g Th or U/cm3) | ||
For the example set of data given in Table 2, the factors needed to compute and the results are listed in Table 3. Since the \nuc226Ra activity of the sample was less than the blank, we can only derive an upper limit for the \nuc226Ra activity, which we set by the quadratic combination of the errors for the fit of the sample and blank.
3 Measurement of extraction efficiency
In this section we describe the ways in which the efficiency of extraction of Ra from water by MnO-coated beads has been measured. The efficiency is usually very high, 95% or more.
The extraction efficiency for Ra is defined as the probability that an atom of Ra dissolved in the water which flows over the column will be adsorbed on the column and held there until extraction ends. As discussed below in Section 6, not all Ra that is present in the system may be dissolved; further there is a concern that Ra captured on the column at the start of water flow may be leached from the column by the time flow has ended, especially in assays that sample a very large volume of water.
The efficiency of most extractions in the H2O is determined by passing the water over two columns (or with multicolumn assays, two sets of columns) in series, called here the ‘upstream’ and ‘downstream’ columns. Assuming both columns have the same efficiency, which is valid because we are considerably below capacity and the distribution coefficient is independent of concentration [15], and no leaching occurs, then it is easily shown that this efficiency is given by
| (14) |
where is the measured column activity after blank subtraction and correction for Th extraction. To help to satisfy the first assumption, large quantities of the beads, sufficient for filling many columns, are mixed, and the columns are always filled with the same bead mass. The validity of the second assumption, that no leaching occurs, has been tested by spiking beads with \nuc226Ra activity and flowing large volumes of water through them, as described above in Section 2.1. Insignificant loss due to leaching was observed up to equivalent volumes of 170 k. Assuming the correctness of these assumptions, we obtain from Eq. (14) in most high-activity assays an efficiency in the range of (95–100)%. In the analysis we use the extraction efficiency from Eq. (14) whenever possible; in other cases an efficiency of 95% is assumed with a 5% systematic uncertainty.
The extraction efficiency has also been measured by adding weak \nuc224Ra spikes to 1 m3 of water. By comparison of the known initial \nuc224Ra activity with the activity inferred from counting the column on an ESC, these measurements showed that Ra was routinely extracted from water by MnO with 90% efficiency [16].
The extraction efficiency of MnO for Th at the flow rate of a standard assay is quite low (10%) [17].
| Value and uncertainty (%) | |||
|---|---|---|---|
| Factor | Definition | Th chain | U chain |
| Probability Rn atom escapes from MnO coating and enters gas phase | (\nuc220Rn) | (\nuc222Rn) | |
| Probability Rn atom is in ESC active volume when it decays |
(\nuc220Rn, 1 column)
(\nuc220Rn, 4 columns) |
(\nuc222Rn, 1 column)
(\nuc222Rn, 4 columns) |
|
| Probability Po atom from Rn decay in ESC active volume produces detected pulse in counter |
(\nuc212Po)
(\nuc216Po) |
(\nuc214Po)
(\nuc218Po) |
|
| Probability detected from Po decay is in analysis window for that Po isotope | (typical, calculated in each assay for each Po isotope) | ||
4 Measurement of counting efficiency
This section gives the results of counting efficiency measurement. For short-lived \nuc220Rn, the major loss of efficiency comes from decay before it escapes from the column; for long-lived \nuc222Rn, the major loss is during the process of detection. In one-column assays the approximate counting efficiency is 6% for the Po isotopes that follow \nuc220Rn and 25% for those that follow \nuc222Rn.
The counting efficiency for each Po isotope is defined as the probability that if an atom of \nuc226Ra (for \nuc218Po and \nuc214Po) or \nuc224Ra (for \nuc216Po and \nuc212Po) decays within the column on the ESC, then the resultant Po isotope will yield a detected count within the energy window chosen for that Po isotope. This efficiency was determined in two ways: (1) by \nuc224Ra spike experiments similar to those described earlier for measurement of extraction efficiency and (2) by measurements of all the separate factors that together make up the counting efficiency.
The spike technique has the advantage that it measures the entire throughput of the assay procedure from added Ra to detected Po. In these experiments, \nuc224Ra activity was added to 1 m3 of ultrapure H2O and the water was flowed through an MnO column at 20 /min. The spike activity was determined by electroplating an aliquot of the same activity as added to the tank onto a planchet and counting it with an detector of known efficiency. To separately determine the extraction efficiency, these experiments were made with upstream and downstream columns that were individually counted. Removing the extraction efficiency, which was consistently (98–99)%, the counting efficiency for \nuc216Po was measured [18] to be , where the uncertainty is the standard deviation of the separate measurements. The large uncertainty is believed to be mainly due to differences in the MnO coating on the beads, which lead to differences in emanation of Rn.
During early work to develop the MnO method, much attention was devoted to understanding the various factors that enter the counting efficiency. Following the trail from adsorbed Ra to detected Po, this efficiency can be broken down into the terms defined in Table 4. A brief discussion of these factors and how they are measured follows.
The emanation efficiency has been determined by placing beads spiked with \nuc224Ra or \nuc228Th in front of a shielded counter and measuring the activity of \nuc212Pb as Ar or N2 gas was flowed at low pressure through the beads. The major purpose of these experiments was to test Rn emanation with different types of beads and methods of Mn coating. The values given in Table 4 are for our present bead type and operating conditions. The difference in emanation efficiency between \nuc220Rn and \nuc222Rn is mainly due to the difference in their half lives.
The volume efficiency can be calculated based on the known flow rate, volumes, and pressures in the ESC loop. At the typical flow rate the transfer time from the beads to the ESC is (1–2) sec with 1 column and (4–10) sec with 4 columns. Assuming good mixing, the Rn remains in the ESC chamber for approximately 25 sec, after which it returns to the column where it either may be readsorbed on the Mn coating or may make a second pass through the loop. Summing the probability of decay in the ESC active volume for all possible passes leads to the values in Table 4. Again, the major cause of efficiency difference between \nuc220Rn and \nuc222Rn is due to their half life difference. The uncertainty arises from lack of knowledge of the extent of mixing and the probability of readsorption, which, from measurements of \nuc222Rn adsorption in air, is taken to be 4% with 1 column. As a check on these calculations, a \nuc224Ra-spiked column was counted by itself and then with 3 other columns. The ratio of the count rates in the two configurations was 0.655, which agrees well with the calculated ratio of .
By adding sources that emit known quantities of \nuc222Rn or \nuc220Rn to an ESC loop, the efficiency product has been measured [10] to be for \nuc214Po and for \nuc216Po at our standard operating conditions. For the experimental arrangement used in [10], the volume efficiency is calculated to be for both \nuc220Rn and \nuc222Rn and the energy window efficiency is calculated to be 95.4%. We divide by these two factors and give the resultant detection efficiency in Table 4.
Because of its long half life, essentially all of the charged \nuc218Po ions from \nuc222Rn decay are collected provided the ESC pressure is 100 mbar, as is almost always satisfied during counting. But, because of the short 150-ms half life of \nuc216Po, the daughter of \nuc220Rn, the efficiency for \nuc216Po detection depends more sensitively on the N2 pressure in the counting loop. Measured values are given in [7]. The pressure in the ESC counting loop generally rises less than 1 mbar/day which leads to a reduction in the \nuc216Po detection efficiency of no more than a few percent during the course of a normal 10-day counting period. One might expect that the detection efficiency for \nuc212Po would be approximately 64% of that for \nuc216Po, because of the 64% branching ratio of \nuc212Bi to \nuc212Po. Measurements, however, show that the \nuc212Po efficiency is somewhat greater than that of \nuc216Po, presumably due to collection of some of the \nuc212Pb ions if the \nuc216Po decays in flight before it reaches the diode (and perhaps to collection of some charged \nuc212Bi atoms which recoil into the gas when \nuc212Pb on a wall decays). Measurements with a Th foil in the ESC loop gave a \nuc212Po to \nuc216Po efficiency ratio of 1.034. For similar reasons, the \nuc214Po efficiency is somewhat higher than the \nuc218Po efficiency. Measurements with \nuc222Rn in six different ESCs gave a \nuc214Po to \nuc218Po efficiency ratio of .
The final efficiency factor, the window efficiency, is calculated by numerical integration over the chosen energy window using the fitted line shape parameters. Because the energy windows are set as wide as possible, its value is quite high, typically 98% for \nuc212Po, 97% for \nuc214Po and (95–96)% for \nuc216Po and \nuc218Po.
By multiplying the first three factors listed in Table 4, this second method of efficiency determination gives a counting efficiency in 1-column assays of for \nuc216Po and for \nuc214Po. The window efficiency is excluded here because it is calculated separately for each experiment and each energy window. These are the standard counting efficiencies that we use for data analysis. Including a typical 95% energy window efficiency, the \nuc216Po efficiency is which agrees well with the efficiency measured by adding \nuc224Ra spikes to water of . In 4-column assays the counting efficiency is reduced by factors of 0.67 for \nuc216Po and 0.68 for \nuc214Po.
5 Systematic uncertainties
The various systematic effects are listed in Table 5. The largest entry is the 27% uncertainty in the counting efficiency for \nuc224Ra, discussed in Sec. 4. The other major entries are briefly considered here; the terms whose uncertainties are 5% or less are described in [7].
| Syst. uncertainty (%) | ||||
| \nuc224Ra | \nuc226Ra | |||
| Contributor | D2O | H2O | D2O | H2O |
| Water flow | ||||
| Extraction efficiency | 5 | 5 | 5 | 5 |
| Water sample volume | 5 | 2 | 5 | 2 |
| Resampling correction | +4 | 0 | +4 | 0 |
| Feedback correction | 3 | 3 | 3 | 3 |
| MnO fines recirculation | +5 | +5 | +5 | +5 |
| Ra leaching | +10 | +3 | +10 | +3 |
| Ra adsorption | +2 | +2 | +2 | +2 |
| Ra background (see text) | ||||
| Data acquisition | ||||
| Counting efficiency | 27 | 27 | 14 | 14 |
| Relative ESC counting eff. | 5 | 5 | 5 | 5 |
| Ra distribution in column | +5 | +5 | +1 | +1 |
| Drifts during counting | 2 | 2 | 1 | 1 |
| Data analysis | ||||
| Overlap | 1 | 1 | 1 | 1 |
| Relative line efficiencies | 3 | 3 | 0 | 0 |
| Time functions | 5 | 5 | 5 | 5 |
| Total, | +32 | +30 | +21 | +18 |
| combined quadratically | -29 | -29 | -17 | -17 |
In some high-volume assays a lower \nuc226Ra activity is seen in the sample than in the blank, implying that some leaching may be occurring. If this is true, then \nuc224Ra must of course also be lost, but no decrease in \nuc224Ra activity is seen. This is because the ratio of concentrations between water and column is higher for \nuc224Ra than for \nuc226Ra, so the loss of \nuc224Ra due to leaching is less than the pickup from the water. Measurements very rarely show more than a 10% loss of \nuc226Ra activity, so we assign a +10% uncertainty for Ra leaching in D2O extractions. This effect is smaller in H2O extractions as much less water is circulated.
The \nuc224Ra background from \nuc228Th plated on the walls of the extraction apparatus of the D2O system was measured as follows: A closed loop was first made whose water flow bypassed the acrylic vessel. The D2O in this loop was flowed through an MnO column to extract all Ra in the water, and the loop was left without flow for 4 days, the typical assay duration. Then any fresh Ra that had grown in was extracted by circulating the water in the loop over an MnO column for 3 hours. After blank subtraction the net activity was measured to be decays of \nuc224Ra/day. This should be compared with the activity extracted in a typical assay, which is decays of \nuc224Ra/day. The background from this source is thus of the typical assay activity. Adopting the upper limit as the uncertainty and converting to the equivalent concentration of \nuc232Th, we find that this systematic background is -0.6 g Th/cm3 D2O.
6 Results of water assays
We give here the results of MnO assays of the \nuc224Ra and \nuc226Ra concentrations in the heavy and light water of the sno experiment.
| Assay | Volume | ||
|---|---|---|---|
| Date | D2O | ||
| (yy/mm/dd) | (k) | g Th/cm3 D2O | g U/cm3 D2O |
| 00/05/01 | 4.9 (1) | 4.1 (1) | |
| 00/08/22 | 2.3 (1) | 3.9 (1) | |
| 00/10/30 | 2.5 (1) | 0.0(0.0–9.6) | |
| 01/01/30 | 2.8 (1) | 0.0(0.0–6.2) | |
| 01/04/16 | 2.1 (1) | 1.9 (1) | |
| 01/05/14 | 2.2 (1) | 0.0(0.0–4.0) |
The results of several 4-column assays of the D2O are given in Table 6. To infer the average concentration of Th and U in the heavy water from these results requires an understanding of flow patterns, plating, solubility, diffusion, etc. and is the subject of a future article. Nonetheless, if one compares these results to the upper limit goals for radioactive purity given in the Introduction, it is apparent that the U value is considerably below the goal and the Th measurement is nearly a factor of 2 less than the goal.


A useful way to visualize the signal of extracted \nuc224Ra is to combine the data from several separate measurements. This can be done by simply adding the counts in the separate time intervals after start of counting for each experiment, with appropriate corrections for times when the counter was not active. Figure 5 shows the \nuc212Po and \nuc216Po spectra obtained by combining in this manner six 4-column assays of D2O. The decay of \nuc224Ra is much more apparent than for the similar plot for a single measurement in Fig. 4.
| Assay | Volume | ||
|---|---|---|---|
| Date | H2O | ||
| (yy/mm/dd) | (k) | g Th/cm3 H2O | g U/cm3 H2O |
| Water between acrylic vessel and photomultipliers | |||
| Upstream column | |||
| 00/01/18 | 1.0 (1) | 4.9 (1) | |
| 00/05/10 | 1.3 (1) | 2.8 (1) | |
| 00/10/23 | 6.7 (1) | 1.1 (1) | |
| 01/02/05 | 5.9 (1) | 0.0(0.0–2.4) | |
| 01/05/23 | 6.1 (1) | 1.3 (1) | |
| Downstream column | |||
| 00/01/18 | 3.6 (1) | 0.0(0.0–4.2) | |
| 00/05/10 | 2.0 (1) | 0.0(0.0–5.6) | |
| 00/10/23 | 2.3 (1) | 0.0(0.0–1.4) | |
| 01/02/05 | 7.7 (1) | 0.0(0.0–2.7) | |
| 01/05/23 | 0.0(0.0–1.2) | 0.0(0.0–1.9) | |
| Water outside photomultipliers | |||
| Upstream column | |||
| 99/05/10 | 1.7 (1) | 1.5 (1) | |
| 00/05/15 | 1.2 (1) | 0.0(0.0–6.2) | |
| 01/04/05 | 8.4 (1) | 3.1 (1) | |
| Downstream column | |||
| 99/05/10 | 4.6 (1) | 4.2 (1) | |
| 00/05/15 | 5.8 (1) | 0.0(0.0–6.1) | |
| 01/04/05 | 1.3 (1) | 1.9 (1) | |
Two types of Ra assays are often made in the H2O system. The first has a sampling point on the midplane of the acrylic vessel halfway between the vessel and the photomultipliers with the purified water returned to the midplane at two points, with the closest at 7.0 m distance from where the sample is taken. Since the Ra concentration in this region is higher than in the D2O, an adequate \nuc224Ra signal is obtained with a single MnO column and a sample volume of only 50 k. The results of several measurements of this type are given in Table 7. Both upstream and downstream columns are usually used; applying Eq. (14) to \nuc224Ra, it is seen that the extraction efficiency is in the range of (96–98)%. The other type of frequent H2O assay is of the water in the region outside the photomultipliers. The sampling point is 4 m below the surface and the water is returned to either the midplane of the acrylic vessel or near the water surface. Some representative results are given in Table 7. Comparing the results for the region between the acrylic vessel and the photomultipliers to the upper limit goals for radioactive purity stated in the Introduction, one sees that the U content of the bulk H2O amply meets the goal and the Th content is slightly, but not significantly, higher than the goal.
For all the D2O assays in Table 6, and all but one of the H2O assays in Table 7, the \nuc228Th activity of sample and blank were equal within the statistical 68% confidence range. This is expected as the extraction efficiency for Th is low, and most Th, if present, is expected to be plated onto surfaces, or possibly be held in the water in the form of a soluble chemical complex.
7 Conclusion
The MnO assay method has shown that the Ra activity in the bulk D2O and the bulk H2O of the sno detector is sufficiently low that the rate of photodisintegration background events produced by Ra impurities should be no more than 10% of the rate of neutral-current solar neutrino events predicted by the standard solar model. The sensitivity of the MnO assay method is thus adequate for the needs of the sno detector.
Since the MnO method is reliable and robust, sno has used it to make many water quality measurements in addition to those in Sec. 6. These experiments mostly tested individual sections of the water system, such as the piping from the acrylic vessel to the MnO columns, the concentrate of the reverse osmosis apparatus, the contents of various storage tanks, the purity of the D2O during detector filling, etc. A desirable feature of the method is that after extraction the column is simply dried and counted; there is no need for any chemical processing, which may introduce background from reagents and the processing system.
Acknowledgments
We thank the operators of the sno water systems for their great care in carrying out the assays described here. We are very grateful to the INCO, Ltd. mining company and their staff at the Creighton mine without whose help this work could not have been conducted. We greatly thank Atomic Energy of Canada, Ltd. for the loan of the heavy water in cooperation with Ontario Power Generation. This research was supported by: Canada: NSERC, NRC, Industry Canada, the Northern Ontario Heritage Fund Corporation, and INCO; USA: Dept. of Energy; and UK: PPARC.
References
- [1] Q. R. Ahmad et al., arXiv:nucl-ph/0106015, Phys. Rev. Lett. 87 (2001) 071301. Q. R. Ahmad et al., arXiv:nucl-ph/0204008, Phys. Rev. Lett. 89 (2002) 011301. Q. R. Ahmad et al., arXiv:nucl-ph/0204009, Phys. Rev. Lett. 89 (2002) 011302.
- [2] J. Boger et al., arXiv:nucl-ex/9910016, Nucl. Inst. and Meth. in Phys. Res. A 449 (2000) 172.
- [3] T. C. Andersen et al., Nucl. Instr. and Meth. in Phys. Res. A (paper 02-096).
- [4] M. Liu, H. W. Lee, and A. B. McDonald, Nucl. Instr. and Meth. in Phys. Res. A 329 (1993) 291.
- [5] W. S. Moore and L. M. Cook, Nature 253 (1975) 262; W. S. Moore, Deep Sea Research 23 (1976) 647; W. S. Moore et al., J. Geophys. Res. 90 (1985) 6983.
- [6] G. E. Aardsma, P. Jagam, and J. J. Simpson, J. Radioanal. Nucl. Chem. 111 (1987) 111; P. Jagam, J.-X. Wang, and J. J. Simpson, J. Radioanal. Nucl. Chem. 171 (1993) 277.
- [7] T. C. Andersen et al., arXiv:nucl-ph/0208010, v. 1.
- [8] P. Jagam and J. J. Simpson, Nucl. Inst. and Meth. in Phys. Res. A 324 (1993) 389 and 334 (1993) 657.
- [9] We thank Seastar Chemicals, Inc. of Sidney, British Columbia for their cooperation in carrying out these and many other water quality measurements for sno.
- [10] J.-X. Wang, T. C. Andersen, and J. J. Simpson, Nucl. Instr. and Meth. in Phys. Res. A 421 (1999) 601.
- [11] J.-X. Wang, Data analysis of ESC counting for Ra and Rn, sno internal report (1995) SNO-STR-95-066.
- [12] H. Bateman, Proc. Cambridge Phil. Soc. 15 (1910) 423.
- [13] S. Baker and R. D. Cousins, Nucl. Instr. and Meth. in Phys. Res. 221 (1984) 437.
- [14] B. T. Cleveland, Nucl. Instr. and Meth. in Phys. Res. A 416 (1998) 405.
- [15] F. Helfferich, Ion Exchange, McGraw-Hill, New York (1962) pp. 155.
- [16] T. Andersen et al., Recent results on extraction efficiencies, systematics, and fines with MnO2-coated beads, sno internal report (1995) SNO-STR-95-022.
- [17] M. Chen and M. Shatkay, Th, Ra, and Pb extraction onto Diakon-MnO2 resin and the effect of EDTA, sno internal report (1995) SNO-STR-95-004.
- [18] J. Farine, et al., Carleton experiments on salt purification during May–July 2000, sno internal report (2000) SNO-STR-00-033.
- [19] L. A. Currie, Anal. Chem. 40 (1968) 586.