The Pion Form Factor
Abstract
The experimental situation with regard to measurements of the pion charge form factor is reviewed. Both existing data and planned experiments are discussed.
1 Introduction
The pion, and specifically its charge form factor, is of key interest in the study of the quark-gluon structure of hadrons. This is exemplified by the many calculations that treat the pion as one of their prime examples. One of the reasons is that the valence structure of the pion, being , is relatively simple. Hence it is expected that the value of the four-momentum transfer squared , down to which a pQCD approach to the pion structure can be applied, is lower than for the nucleon. Whereas, e.g., the proton form factors seem to be completely dominated by constituent quark properties [1] up to at least = 10 - 20 (GeV/c)2, recent estimates [2] suggest that pQCD contributions start to dominate the pion form factor at 5 (GeV/c)2. Furthermore, the asymptotic normalization of the pion wave function, in contrast to that of the nucleon, is known from the pion decay. Within perturbative QCD one can then derive [3]
| (1) |
where is the pion decay constant. The question is down to which finite value of this relation is valid. Thus the interest is in the transition from the soft regime, governed by all kinds of quark-gluon correlations, at low , to the perturbative (including next-to-leading order and transverse corrections) regime at high .
The charge form factor of the pion at very low values of , which is governed by the charge radius of the pion, has been determined [4] up to =0.28 (GeV/c)2 from scattering high-energy pions from atomic electrons. For the determination of the pion form factor at higher values of one has to use high-energy electroproduction of pions on a nucleon, i.e., employ the 1H reaction. For selected kinematical conditions this process can be described as quasi-elastic scattering of the electron from a virtual pion in the proton. The cross section for this process can be written as
| (2) |
where is the virtual photon flux factor, is the azimuthal angle of the outgoing pion with respect to the electron scattering plane and is the Mandelstam variable . The two-fold differential cross section can be written as
| (3) | |||||
where is the virtual-photon polarization parameter. The cross sections depend on , and . In the t-pole approximation the longitudinal cross section is proportional to the square of the pion form factor:
| (4) |
The acceptance of the experiment should be large enough for the interference terms and to be determined. Then, by taking data at two energies at every , can be separated from by means of a Rosenbluth separation.
2 Existing measurements
The pion form factor has been studied for values from 0.4 to 9.8 (GeV/c)2 at CEA/Cornell [5]. For above 1.6 (GeV/c)2 these are at present still the only existing data. In these experiments only in a few cases was an L/T separation performed, and even then the resulting uncertainties in were so large that the L/T separated data were not used. Instead, for the actual determination of the pion form factor, was calculated by subtracting from the measured (differential) cross section a that was assumed to be proportional to the total virtual photon cross section, and no uncertainty in was included in this subtraction. This means that the published values of have large additional model uncertainties on top of the already relatively large statistical (and systematic) uncertainties.

The pion form factor was also studied at DESY [6] for = 0.7 (GeV/c)2. In this case a full separation of all structure functions was performed. We will come back to these data.
Recently the pion form factor was studied [7] at CEBAF for = 0.6 - 1.6 (GeV/c)2. Using the High Momentum Spectrometer and the Short Orbit Spectrometer of Hall C and electron energies between 2.4 and 4.0 GeV, data for the reaction 1H were taken for central values of of 0.6, 0.75, 1.0 and 1.6 (GeV/c)2, at a central value of the invariant mass of 1.95 GeV. Because of the excellent properties of the electron beam and experimental setup, L/T separated cross sections could be determined with high accuracy.
The extracted cross sections are displayed in Figure 1. The error bars represent the combined statistical and systematic uncertainties. As a result of the Rosenbluth separation the total error bars on are enlarged considerably, resulting in typical error bars of about 10%.
In order to determine the value of , the experimental data were
compared to the results of a Regge model by
Vanderhaeghen, Guidal and Laget (VGL) [8]. In this model the pion
electroproduction process is described as the exchange of Regge trajectories
for and like particles.
The VGL model is compared to the data in Figure 1.
Here the value of , which is a parameter in the model, was adjusted at
every to reproduce the data at the lowest value of .
The transverse cross section is underestimated, which can possibly
be attributed to resonance contributions at GeV that are not
included in the Regge model.
The t-pole dominance for at small was checked by studying the
reactions 2H and 2H, which gave within
the uncertainties a ratio of unity for the longitudinal cross sections.
The comparison with the data shows that the dependence in the VGL model is less steep than that of the experimental data. As suggested by the analysis [9] of older data, where a similar behaviour was observed, we attributed this discrepancy to the presence of a small negative background contribution to the longitudinal cross section, presumably again due to resonances. The values of , extracted taking this into account, are shown in Figure 2.
For consistency we have determined in the same way from the cross sections at = 0.7 (GeV/c)2, GeV from DESY [6]. The background term in was found to be smaller than in the Jefferson Lab data, presumably because of the larger value of . The resulting best value for , also shown in Figure 2, is larger by 12% than the original result, which was obtained by using the Born term model by Gutbrod and Kramer [9]. Those authors used a phenomenological -dependent function, whereas the Regge model by itself gives a good description of the -dependence of the (unseparated) data from Ref. [5].
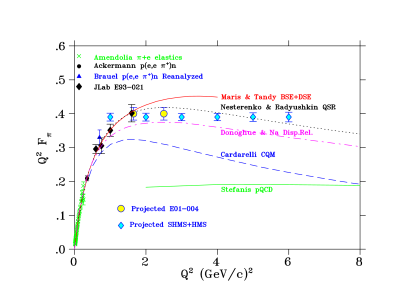
The data for in the region of up to 1.6 (GeV/c)2 globally follow a monopole form obeying the pion charge radius [4]. It should be mentioned that the older Bebek data in this region suggested lower values. However, as mentioned, they did not use L/T separated cross sections, but took a prescription for . Our measured data for indicate that the values used were too high, so that their values for came out systematically low.
In Figure 2 the data are also compared to a sample of theoretical calculations. The model by Maris and Tandy [10] provides a good description of the data. It is based on the Bethe-Salpeter equation with dressed quark and gluon propagators, and includes parameters that were determined without the use of data. The data are also well described by the QCD sum rule plus hard scattering estimate of Ref. [11]. Other models [12, 13] were fitted to the older data and therefore underestimate the present data. Figure 2 also includes the results from a perturbative QCD calculation [14]. Apart from the basic dependence given by Eq. 1, but extended to next-to-leading order, it includes transverse momenta of the quarks, Sudakov factors, and a way to regularize the infrared divergence. As a result the value of is about constant at 0.18 over the whole range of shown. Other pQCD calculations yield similar results, but with a lower value of [15]. Hence it is clear that in the region below (GeV/c)2, where accurate data exist, soft contributions are much larger than pQCD ones. For this reason it is highly interesting to get reliable data at higher values of .
3 Future experiments
The JLab experiment will be extended in the year 2003. Data will be taken at = 2.5 (GeV/c)2, the highest value compatible with the present set-up, which is determined by the combination of the maximum momentum of the SOS spectrometer (1.75 GeV/c) and the minium angle of the HMS spectrometer (10.5 degrees). The value of will be 2.20 GeV. The increased value of gives a smaller value of , closer to the pole, and is in a region where the Regge model is supposed to be more reliable. Data will also be taken at = 1.6 (GeV/c)2 with GeV. By comparing those to the existing ones, taken at GeV, the model dependence in the extraction of will be gauged.

With the planned upgrade of CEBAF to 12 GeV the pion form factor can be studied [16] up to (GeV/c)2 with GeV. The HMS spectrometer will now be used to detect the scattered electron, while the pion will be detected in the proposed SHMS spectrometer. Since the direction of is rather forward at high and , the small angle capability of SHMS is essential. Taking advantage of the higher incoming energy, the value of can be increased, with even more of the benefits described above. As a result, contrary to common belief, the ratio of over will still be favourable. This is illustrated in Figure 3. The value of decreases with due to kinematical factors, but for this reduction is more than compensated for by the value of getting smaller, i.e., closer to the pole.
Figure 2 shows what data will be obtained, with the expected experimental accuracy. The model uncertainty is estimated to be about 5%.
Kinematics for studying the kaon form factor at = 2.0 (GeV/c)2 and GeV, which gives (GeV/c)2. (GeV) (GeV) 11.0 11.4 4.60 7.98 0.700 8.0 22.8 1.60 5.43 0.364
With the 12 GeV upgrade one can also start to think about studying the kaon form factor. The formula for the Born cross section in this case is
| (5) |
Clearly, accessible values of will be much further from the pole. However, by using large values of W one can hope that meaningful results can be obtained up to 2 (GeV/c)2. Possible kinematics at this are given in table 3. In the analysis one has also to take into account two-step processes like forming first a particle, which then decays into a .
References
- [1] G. Miller, this workshop
- [2] W. Schweiger, Nucl. Phys. Proc. Suppl. 108, 242 (2002)
- [3] G.R. Farrar, D.R. Jackson, Phys. Rev. Lett. 43, 246 (1979)
- [4] S. R. Amendolia et al., Nucl. Phys. B277, 168 (1986)
- [5] C. J. Bebek et al., Phys. Rev. D17, 1693 (1978)
- [6] P. Brauel et al., Z. Phys. C3, 101 (1979)
- [7] J. Volmer et al., Phys. Rev. Lett. 86, 1713 (2001); J. Volmer, PhD thesis, Vrije Universiteit, Amsterdam (2000), unpublished
- [8] M. Vanderhaeghen, M. Guidal and J.-M. Laget, Phys. Rev. C57, 1454 (1998); Nucl. Phys. A627, 645 (1997)
- [9] F. Gutbrod and G. Kramer, Nucl. Phys. B49, 461 (1972)
- [10] P. Maris and P. C. Tandy, Phys. Rev. C62, 055204 (2000)
- [11] V. A. Nesterenko and A. V. Radyushkin, Phys. Lett. B115, 410 (1982)
- [12] F. Cardarelli et al., Phys. Lett. B332, 1 (1994); Phys. Lett. B357, 267 (1995)
- [13] J.F. Donoghue and E.S. Na, Phys. Rev. D56, 7073 (1997)
- [14] N.G. Stefanis, W. Schroers and H.-Ch. Kim, Phys. Lett. B449, 299 (1999); Eur. Phys. J. C18, 137 (2000)
- [15] R. Jakob and P. Kroll, Phys. Lett. B315, 463 (1993) and B319, 545 (1993); J. Phys. G. 22, 45 (1996)
- [16] ”The Science Driving the 12 GeV Upgrade of CEBAF”, Jefferson Lab Report, Febr. 2001