(Anti)proton and Pion Source Sizes and Phase Space Densities in Heavy Ion Collisions
Abstract
NA44 has measured mid-rapidity deuteron spectra from collisions at GeV at the CERN SPS. Combining these spectra with published , and data allows us to calculate, within a coalescence framework, and source sizes and phase space densities. These results are compared to source sizes measured by Hanbury-Brown Twiss, HBT, interferometry and phase densites produced by combining pion spectra and HBT results. We also compare to results and to lower energy (AGS) data. The source is larger than the proton source at GeV. The phase space densities of and are not constant but grow with system size. Both and proton radii decrease with and increase with . Pions and protons do not freeze-out independently. The nature of their interaction changes as and the ratio increases.
Relativistic heavy ion collisions provide a mechanism to heat and compress nuclear matter to temperatures and energy densities comparable to those of the early universe when it was still a plasma of quarks and gluons. Such a state may be fleetingly restored in these collisions where temperatures of MeV and energy densities GeV/fm3 are observed [1, 2]. These values are close to those of the phase transition found in lattice calculations [3]. If such a hot and dense state were formed one would expect a large increase in entropy and possibly a saturation of the density of particles in phase space. The coalescence of nucleons into deuterons is sensitive to both their spatial and momentum correlations. In this paper we report , and source sizes measured by coalescence and interferometry, and combine these with single particle spectra to derive phase space densities. The phase space densities depend on temperature, chemical potentials, and velocity fields in the system. This description of the final hadronic state serves as a boundary condition for models of possible quark gluon plasma production. We vary the total size of the system by studying , , and collisions. We also compare our results to lower energy AGS data where the ratio is much lower. This comparison shows that the freeze-out of pions and protons is coupled.
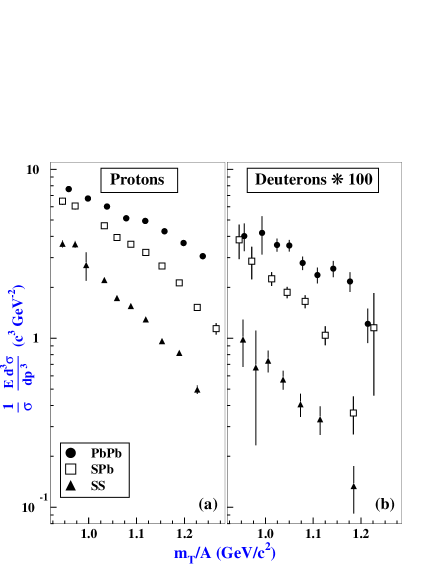
NA44 is a focusing spectrometer that uses conventional dipole magnets and superconducting quadrupoles to analyze the momentum of the produced particles and create a magnified image of the target in the spectrometer [4, 5, 6, 7, 8, 9, 10]. The systematic errors on the deuteron yields range from for to for . The and spectra are corrected for feed-down from and decays using a GEANT simulation with the () and () ratios taken from the RQMD model [9, 10, 11]. The systematic error was estimated by varying these ratios by . These errors are slightly correlated for and . Fig. 1 shows NA44 deuteron spectra and previously published proton spectra at = 1.9-2.3 as a function of A [12]. The centrality is for , and . The spectra get flatter for the larger systems consistent with a higher temperture and/or stronger sidewards flow. As expected from coalescence, the slopes are similar for protons and deuterons. This was also found for lower energy data, [13]. The deuteron inverse slopes (in ) and yields are listed in Table 1. A comprehensive analysis of all NA44’s proton and light clusters spectra will be given in a later paper.
| System | Fit Range | Inverse | dN/dy |
|---|---|---|---|
| of | Slope | ||
| () | |||
| SS | 0-520 | 320 149 | 39 13 |
| SPb | 0-520 | 300 91 | 153 23 |
| PbPb | 160-520 | 379 13 | 390 20 |
The model of deuteron production by final state coalescence of protons and neutrons with small relative momenta states that the production of deuterons with a certain velocity is proportional to the number of protons and neutrons that have similar velocities [15, 16]. This model successfully describes measured deuteron distributions in intermediate energy heavy ion collisions and high energy collisions, [17]. Near mid-rapidity, direct production of pairs is small due to the high mass threshold of 3.75 GeV/, and pre-existing deuterons are unlikely to survive the many collisions required to shift them to mid-rapidity. Since coalescence depends on the distribution of nucleons, one can determine a nucleon source size from the ratio
| (1) |
where the deuteron momentum is twice the proton momentum [18]. Since we do not measure neutrons we assume that the spectra have the same shape and take the ratio to be from RQMD [11]. At GeV the measured ratio is independent of [19]. RQMD is in reasonable agreement with this result.
To facilitate comparison with NA44’s pion interferometry results, we assume a Gaussian distribution of the proton source. If one also assumes a Gaussian wave-function one can solve for the source size analytically [20]
| (2) |
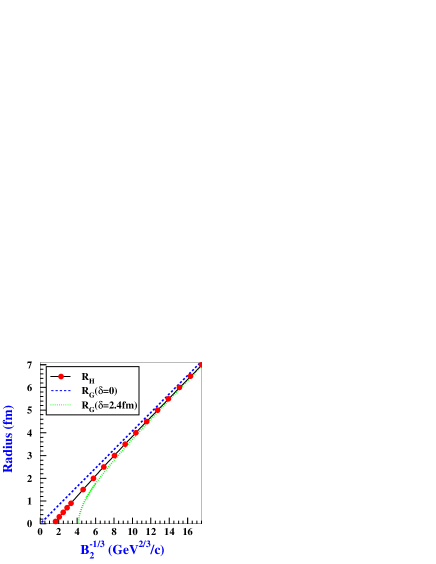
where is the proton mass and fm accounts for the size of the deuteron. In reality the deuteron wave function is not Gaussian but is more accurately represented by the Hulthen form
| (3) |
with fm-1 and fm-1 [21]. The convolution of such a wave function with a gaussian source cannot be done analytically but is straightforward numerically to solve for the source radius , [22]. Note our is the of [22]. Figure 2 shows a comparison of and versus the coalesence parameter .
Since is sensitive to both the transverse and longitudinal size of the source, when comparing to HBT results it is best to compare to (Eqn. 6.3 of [23]), where and parametrize the extent of the source perpendicular and parallel to the beam [24]. NA44 has published HBT results in the Pratt-Bertsch frame in which the sum of the longitudinal momentum of each pion pair is zero. In this scheme the radius in the sidewards direction and the longitudinal radius [25]. In this paper we will therefore compare to . These parameters can be thought of as “lengths of homogeneity” of the source [26, 27]. One can think of the radii as lengths scales of the velocity and/or temperature gradients. They represent snapshots of the hadronic system at freeze-out which may occur at different times for and protons. However since the cross sections for , and collisions are comparable the freeze-out times should be close.
A particle’s phase space density is defined as
| (4) |
For a system in chemical equilibrium at a temperature and chemical potential
| (5) |
where E is the energy and selects bosons or fermions. For a dilute system, i.e. , Eqn. 5 gives
| (6) |
Since , Eqn. 6 implies that
| (7) |
A more general form of this relation was derived in Eqn. 3 of [28] assuming only that the system is hot and large compared to the deuteron. Averaging over gives
| (8) |
where the factor of 3 accounts for the spin of the particles. For pions NA44 has measured the source size in 3 dimensions with HBT, as well as single particle spectra. Some of the pions come from the decay of long-lived resonances such as and . These pions reduce the strength of the correlation function , which typically is . The fraction of pions which do not come from resonances is , [29]. This has been shown experimentally for collisions and for RQMD simulations of collisions [30, 31]. Dividing by the Lorentz invariant volume, [27, 32, 33] gives
| (9) |
Again the factor of 3 accounts for the pion’s spin degeneracy. Here is the extent of the source along the beam direction; the extent in the outward direction, ie towards the observer and measures the source in the sidewards direction, perpendicular to both the beam axis and the line of sight to the observer. The term is the “out-longitudinal” cross term [25]. For collisions setting in the HBT fit increases by , [6]. For , and we assume but add a systematic error of to . For deuteron spectra are not available and was calculated using Eqn. 9, replacing the last term with . was determined from HBT data [7]. For and agree within their errors of , [34].
We can test the usefulness of these coalesence methods using RQMD, coupled with a coalesence afterburner, [35]. Figure 3 shows a comparison of and for both data and RQMD for and . For the data both and are larger in but for RQMD only increases from and while stays constant. This invariance of may be an artifact of the coalesence mechanism used, which ignores the requirement of a third particle. Since is constant in the model the increase in proton multiplicity from to is accommodated by a large increase in . However, is less than the average transverse radius of freezeout, 5.4 fm for and 10.3 fm for , indicating that coalesence is not sensitve to the full size of the source. A similar situation occurs in pion interferometry where correlations between position and momentum cause the observer to only “see” the side of the source closest to her, [6]. Since these correlations get stronger as the particles get faster the size of the source drops with , [29, 36].
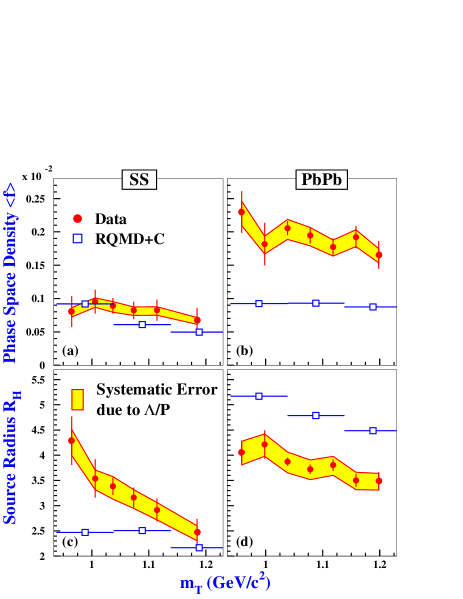
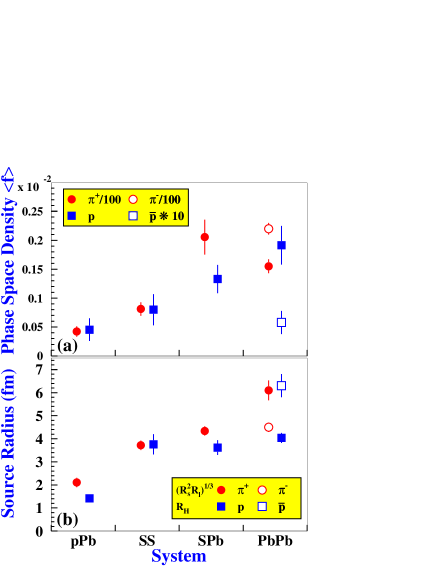
Figure 4 shows the system dependence of the phase space densities and source radii for , and . The and radii for are consistent with coalescence data at , and interferometry results [37, 38]. The and phase space densities generally increase with system size. We find that
For and was calculated in [39] using a similar equation to Eqn. 9. However a parametrization of the pion spectrum was used rather than the spectrum itself. The authors of [39] concluded that the pion phase density was universal at freeze-out but this is not the case, since is considerably smaller for and than for and .
For pions increases steadily with the number of participants and for there is a rapid increase in the radii parameters with multiplicity, [8]. At low does not change much from to (nor with centrality for ) despite the increase in the proton multiplicity by , see Fig. 1(a). However the dependence of is weaker for than for , see Fig 3. The extra protons mainly increase the proton phase space density .
Because of their large annihilation cross-section, one might expect that antiprotons (particularly those at low ) would be emitted only from the surface of the system and would have a larger RMS freeze-out radius than protons. Our data are consistent with this idea. An alternative view assumes that proton and antiprotons are produced in the same volume but that antiprotons are suppressed in the interior of the source [40]. Applying this idea to our data would imply that antiprotons are emitted only from within fm of the surface [40]. Recent and results from E864 at GeV and low imply that fm, fm and [41]. At GeV antiprotons are mainly produced in primary nucleon-nucleon collisions and so they may have a smaller source size than protons. Since is a gaussian radius it is necessary to multiply it by in order to compare it to a hard sphere with the same RMS radius, [42]. If this is done the antiproton source is roughly equal to the size of the colliding nuclei at GeV.
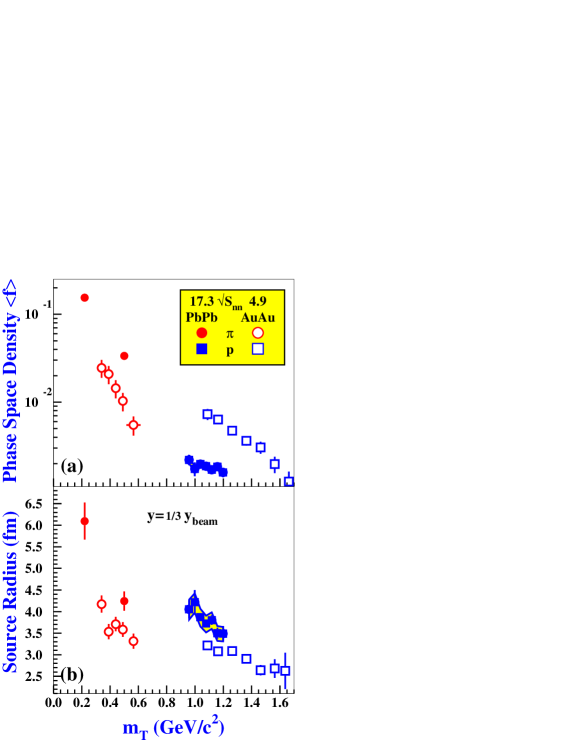
In order to study the energy dependence of freeze-out we compare our data at GeV to AGS data at GeV. Since our data are not at mid-rapidity but at y=2 we have compared results at the same scaled rapidity . Figure 5 shows the phase space densities and source radii for and collisions as a function of . At a given , increases with while decreases. Fitting to Eqn. 5 gives , within errors, for both energies while decreases with . Since , Eqn. 5 also implies that be exponential in for . However if the system is boosted due to transverse flow, will become flatter [43]. This effect is proportional to mass. The data support this scenario since the distributions are much flatter than the ones. The distribution of becomes flatter as increases because of an increase in flow and/or freeze-out temperature. However in general the velocity profile cannot be determined without knowing the density profile and so a determination of a mean velocity from is beyond the scope of this work, [28].
Several hydrodynamical models have interpreted the HBT source radii as “lengths of homogeneity” which should decrease with increasing and this is consistent with our data [26, 27]. Both pion and proton radii increase with . However increases with while drops. Since at both SPS and AGS energies [9, 46, 47], we know that most protons observed near mid-rapidity are remnants of the target or projectile that were slowed down by multiple collisions. At the higher energy the protons occupy a somewhat larger volume and they are spread over a larger momentum (i.e. ) range. Therefore drops with .
For pions the situation is different. At = 4.9 GeV, they are outnumbered by protons and so their freeze-out is driven by that of the nucleons. At = 17.3 GeV, they are the most numerous particle and control freeze-out. Since increases with . Note that the ratio increases by a factor of about 16 from = 4.9 GeV to 17.3 GeV while the ratio only increases by a factor of 7.
Using the (anti)deuteron as a measure of the nucleon-nucleon correlations we have used a coalescence formalism to make the first measurements of and source radii and phase space densities as a function of at GeV. At = 4.9 GeV the antiproton source is smaller than the proton source while at GeV it appears to be larger. We have compared the proton data to our radii and phase space densities derived from HBT and single particle results as a function of system size and . This comparison reveals a linkage between proton and pion freeze-out that changes as the ratio increases. At = 4.9 GeV the hadronic system is held together by protons while at = 17.3 GeV it is held together by pions.
We thank the NA44 collaboration for permission to publish deuteron spectra and much valuable input. Thanks also to G. Bertsch, U. Heinz, S. Mrówczyński and S. Pratt for helpful discussions.
References
- [1] P. Braun-Munzinger, I. Heppe and J. Stachel, Phys. Lett. B 465 15 (1999).
- [2] T. Alber et al., Phys. Rev. Lett. 75 3814 (1995).
- [3] A. Ukawa, Nucl. Phys. A 638 339c (1998).
- [4] H. Beker et al., Phys. Rev. Lett. 74, 3340 (1995); K. Kaimi et al., Z. Phys. C 75 619 (1997); H. Bøggild et al., Phys. Rev. C 58, 328 (1999) nucl-ex/9808002; H. Bøggild et al., Phys. Lett. B 349 386 (1995).
- [5] I.G. Bearden et al., Phys. Lett. B 471, 6 (1999).
- [6] I.G. Bearden et al., Phys. Rev. C 58, 1656 (1998).
- [7] H. Bøggild et al., Phys. Lett. B 458, 181 (1999).
- [8] I.G. Bearden et al., “Space-time evolution of the hadronic source in peripheral to central Pb+Pb collisions.” accepted by Eur. Phys. Jour. C May 2000.
- [9] I.G. Bearden et al., Phys. Rev. C 57, 837 (1998).
- [10] I.G. Bearden et al., Phys. Rev. Lett. 85 2681 (2000).
- [11] H. Sorge, Phys. Rev. C 52, 3291 (1995).
- [12] I would like to thank my NA44 collegues for agreeing to publication of some of our deuteron spectra before a comprehensive paper is published.
- [13] L. Ahle et al., Phys. Rev. C60 064901 (1999).
- [14] A. Hansen et al., Nucl. Phys. A. 661 387c (1999).
- [15] S. Butler and C. Pearson, Phys. Rev. 129, 836 (1963).
- [16] J. Kapusta, Phys. Rev. C 21, 1301 (1980).
- [17] H. Gutbrod et al., Phys. Rev. Lett. 37 667 (1976); S. Nagamiya, M. C. Lemaire, E. Moeller, S. Schnetzer, G. Shapiro, H. Steiner, and I. Tanihata, Phys. Rev. C 24 971 (1981); B. V. Jacak, D. Fox, and G. D. Westfall ibid. 31 704 (1985); J.W. Cronin et al., Phys. Rev. D 11, 3105 (1975).
- [18] A.Z. Mekjian, Phys. Rev. C 17, 1051 (1978)., Nucl. Phys. A 312, 491 (1978).
- [19] T.A. Armstrong, et al., Phys. Rev. C 60 064903 (1999).
- [20] W.J. Llope et al., Phys. Rev. C 52, 2004 (1995).
- [21] P.E. Hodgson, Nuclear Reactions and Nuclear Structure p453, Clarendon Press, Oxford, (1971).
- [22] S. Mrówczyński Phys. Lett. B 277 43 (1992).
- [23] R. Scheibl and U. Heinz, Phys. Rev. C 59, 1585 (1999).
- [24] U. Heinz, B. Tomášik, U.A. Wiedemann, and Y.F. Wu, Phys. Lett. B 382, 181 (1996).
- [25] S. Chapman, P. Scotto, and U. Heinz, Phys. Rev. Lett. 74 4400 (1995) and Heavy Ion Phys. 1 1 (1995).
- [26] T. Csörgő and B. Lörstad, Phys. Rev. C 54 1390 (1996).
- [27] U.A. Weidemann and U. Heinz, Phys. Rep 319 145 (1999) nucl-th/9901094.
- [28] A. Polleri, J.P. Bondorf, and I.N. Mishustin, Phys. Lett. B 419 19 (1998).
- [29] T. Csörgő, B. Lörstad, and J. Zimányi Z. Phys. C 71 491 (1996).
- [30] P. Avery et al., Phys. Rev. D 32 2294 (1985).
- [31] J. Sullivan, http://p25ext.lanl.gov/people/sullivan/talks /na44/hbtcoulposter.html
-
[32]
G.F. Bertsch, Phys. Rev. Lett. 72 2349 (1994).;
ibid. 77 (1996) 789(E). - [33] J. Barrette, et al., Phys. Rev. Lett. 78, 2916 (1997), Nucl. Phys. A 312, 491 (1978).
- [34] M. Murray et al., Nucl. Phys. A 661 456c (1999).
- [35] H. Sorge, J.L. Nagle, and B.S. Kumar, Phys. Lett. B 355, 27 (1995).
- [36] Y.M. Sinukov, Nucl. Phys. A 566f 589c (1994).
- [37] G. Ambrosini et al., CERN-OPEN-99-309, New J. of Phys. 1 22 (1999).
- [38] H. Appelshäuser et al., Phys. Lett. B 467, 21 (1999) nucl-ex/9905001.
- [39] D. Ferenc, U. Heinz, B. Tomášik, U.A. Wiedemann, and J.G. Cramer, Phys. Lett. B 457, 347 (1999) hep-ph/9902342.
- [40] S. Mrówczyński Phys. Lett. B 308 216 (1993).
- [41] T.A. Armstrong et al., Phys. Rev. Lett. 85 2685 (2000), nucl-ex/0005001
- [42] B. V. Jacak et al., Nucl. Phys. A 590 215c (1995).
- [43] B. Tomášik, U.A. Wiedemann, and U. Heinz, nucl-th/9907096.
- [44] R. A. Solz et al., Nucl. Phys. A 661 439c (1999).
- [45] L. Ahle et al., Phys. Rev. C 57, R466 (1998).
- [46] M.J. Bennett et al., Phys. Rev. C 56, 1521, (1997).
- [47] T.A. Armstrong et al., Phys. Rev. C 59, 2699, (1999).