Transition from in-plane to out-of-plane azimuthal enhancement in Au+Au collisions
Abstract
The incident energy at which the azimuthal distributions in semi-central heavy ion collisions change from in-plane to out-of-plane enhancement – is studied as a function of mass of emitted particles, their transverse momentum and centrality for Au+Au collisions. The analysis is performed in a reference frame rotated with the sidewards flow angle () relative to the beam axis.
A systematic decrease of as function of mass of the reaction products, their transverse momentum and collision centrality is evidenced.
The predictions of a microscopic transport model (IQMD) are compared with the experimental results.
keywords:
NUCLEAR REACTIONS, E=90–400A MeV; semi-central collisions; flow angle, azimuthal distributions, transition energy; Quantum Molecular Dynamics model; nuclear matter Equation of State, , , , , , , , , , , , , , , , , , , , , , , , , , , , , , , , , , , , , , , , , , , , , , , , , , , , , ,
PACS: 25.75.Ld;25.70.Pq
1 Introduction
A decade ago, two types of azimuthal anisotropies have been evidenced in heavy ion collisions [1, 2, 3, 4]. Following their shape relative to the reaction plane and the main mechanism behind them they have been baptized as in-plane and out-of-plane enhancement or rotational-like [1] and squeeze-out [2, 3, 4] phenomena, respectively. How the transition from one to the other scenario takes place as a function of incident energy, for different collision geometries and types of the reaction products was a question addressed few years later for a light [5] and heavy system [6]. Soon, it was realized that a detailed study of such a transition from in-plane to out-of-plane emission as a function of incident energy could give more insight into the relative contribution of the attractive and repulsive forces, the lifetime of the emitting source, its rotational energy and expansion dynamics. Therefore many studies concentrated on this subject [7, 8, 9, 10, 11, 12, 13, 14].
Below this transition energy, , the experimental data show an in-plane enhancement of the azimuthal distribution. Theoretical calculations established that a rotating compound system created by the mean field, dissipating angular momenta and excitation energy via particle emission, stays at the origin of this observation [7, 15].
Increasing the beam energy the mean field which contributes to the formation of a rotating compound system becomes less important and processes based on nucleon-nucleon interaction start to be predominant. The hydrodynamic approaches used to predict different phenomena which take place in the relativistic regime of heavy ion collisions have shown that a preferential emission of the “squeezed” participant zone in the free phase space, not hindered by the spectator nuclear matter, takes place. The out-of-plane emission of the nuclear matter has been called squeeze-out [16] and has been confirmed experimentally by Plastic Ball [2, 4] and Diogene [3] Collaborations few years later. Afterwards, the generality of this phenomenon was evidenced experimentally. Thus, pions [17, 18], kaons [19], neutrons [20, 21], light particles [22, 23], proton-like particles [8] and intermediate mass fragments [11, 12] show a similar squeeze-out pattern in the azimuthal distributions. Detailed theoretical investigations of this phenomenon were also undertaken, using microscopic transport models [24, 25, 26, 27, 28, 29, 30].
The existence of an azimuthally symmetric flow evidenced in central heavy ion collisions [32, 33, 34, 35] can be regarded as the extreme case of the out-of-plane flow. In other words, the squeeze-out is the result of the expansion of the hot and compressed participant zone in the presence of the projectile and target spectators. Although it is obvious that the cleanest signal on the collective expansion of hot and compressed baryonic matter can be obtained from central collisions, one has to accept that this is an extreme case and the study of a rotating hot and compressed object remains an appealing subject. If the angular momenta and the shadowing realized by the spectator matter which come into the game bring more complications at first glance, they can be used as internal clocks to gain more information on the expansion dynamics.
The incident energy where the effects of these three competing processes, expansion, rotation and shadowing, compensate each other could be looked as a benchmark observable for deeper understanding of the expansion dynamics.
In this paper we present the results of a multidimensional analysis of the transition energy as a function of the mass of emitted particles, their transverse momentum and for different collision centralities. Early FOPI studies [6, 11, 12], done using the experimental data from Phase I of the detector, have been continued with the data obtained using the full phase space coverage of Phase II of this device [9, 37, 38]. Relative to the Phase I FOPI studies, the present data make possible the azimuthal distributions studies in a reference frame with the axis along the sidewards flow direction, with no upper limitation on transverse momentum and as function of the mass of light charged particles.
Chapter 2 describes in more details the experiment and the experimental data analysis. The experimental results are presented in chapter 3. Chapter 4 is dedicated to the comparison of the results with the predictions of a microscopic transport model. Conclusions are presented in chapter 5.
2 Experimental Details
2.1 Setup
The present experimental configuration [39, 40] was used to study Au+Au, Xe+CsI and Ni+Ni collisions at 90, 120, 150, 250 and 400A MeV, aiming to continue our studies started with Phase I of the FOPI [36] detector with much better phase space coverage and as a function of the baryonic number involved in the process. The beam energies are the mid-target energies, taking into account the upstream energy loss of the beam. The results presented in this paper refer to the Au+Au system.
Since details of the first phase can be found in our earlier publications, especially in ref. [36], we describe here the main features of the Central Drift Chamber (CDC), the main extension of Phase I of the FOPI facility [39, 40] used in this experiment. The CDC is a drift chamber that performs the tracking of the path followed by all charged reaction products emitted in the polar angular range 33150∘. The path being curved in the magnetic field of a superconducting solenoid, one can use the transverse momentum and specific energy loss for mass identification of the reaction products. Full azimuthal coverage is realized by this tracking device. The detector is subdivided in 16 sectors, each containing 60 sense wires and 60 potential wires, all aligned parallel to the beam axis. The sense wires are resistive and readout on both ends, which gives the possibility to reconstruct the position along the wire of the hit via charge division. The reconstruction of the initial position of the ionized cell along the ionizing particle path is obtained making use of the electrons drift velocity of about 43.7 m/ns and of the Lorentz angle =32∘. As the direction of the drift electrons cannot be measured, each hit has a symmetric partner relative to the sense wires plane (mirror hit). They combine and form mirror tracks. In order to have a criterion to distinguish between real and mirror tracks, the sense wires planes are tilted 8∘ relative to the radial direction starting from the beam axis. Within this geometry the mirror tracks do not originate anymore from the target. Furthermore, the sense wires within a plane are alternatively staggered by 100 m, which could be also used to reject the mirrored tracks. The individual signal wires of 50 m thick NiCr-based alloy with a resistance of 500 /m vary between 86 and 190 cm. The mixture used for the chamber consists of 88% Ar, 10% isobuthane and 2% CH4 at a slight overpressure.
The CDC was operated in a “split-mode” in order to increase its dynamical range. While the most outer 30 potential wires were operated at a nominal voltage of -1.55 kV, optimum for a good resolution for energetic light particles (Z=1,2), the most inner 30 potential wires had a lower voltage of -1.1 kV, such that the amplitude of the signals corresponding to highly ionizing fragments (Z=3-6) to be within the dynamical range of our sampling convertors, Flash ADCs (8 bit, non-linear). The relative momentum resolution varies from 4% for 0.5 GeV/c to about 12% for =2 GeV/c. A helium bag placed between the target and the forward subdetector of Phase I [36], following the conical shape of the CDC forward endcap, was used in order to decrease the energy thresholds for the intermediate mass fragments flying in the forward direction at 30∘. It is worth to mention here that within the phase space covered by the Phase I subdetector the reaction products are identified by their charge using specific energy loss and time-of-flight information, while the fragments detected by the CDC are identified by their mass, as the information on the specific energy loss and magnetic rigidity was available.
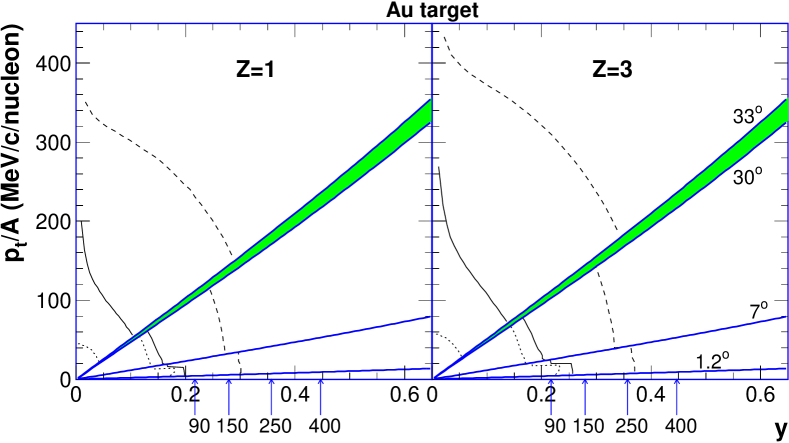
The phase space coverage of the whole device used in the present experiment, in a transverse momentum - versus rapidity - representation, can be followed in Fig. 1. The borders between different subdetectors at 1.2∘, 7∘, 30∘ and 33∘ are represented by thick lines. The shadowed area between 30∘ and 33∘ corresponds to the region between the Plastic Wall (PW) and CDC which is not covered at all. The low thresholds (LT) are represented by thin continuous lines. They correspond to the measured values (dotted lines) after correction for the energy loss in the media before the active detectors. This was done assuming that the interaction has taken place in the middle of the target. For polar angles smaller than 30∘ the low threshold corresponds to the momenta for which the particles reach the PW in order to deliver a time signal while the specific energy loss is obtained from a layer of ionization chambers or thin plastic scintillators in front of the PW [36]. For polar angles larger than 30∘ LT was considered to correspond to the momenta for which the ionizing particles could reach the outer radius of the CDC.
The dashed lines correspond, for the forward detector, to the momenta at which the plastic scintilators are just penetrated by the corresponding particles. In this case the energy loss correction is negligible. For the CDC the dashed lines correspond to the momenta at which the energy loss corrections are below 1%.
2.2 Analysis techniques
The combination of the very high hit densities into tracks associated to the true particles is a serious challenge of a tracking algorithm [40, 41]. The data analyzed in the present paper have been obtained using for the CDC a local tracking method - “track-following” - in a version developed within the FOPI collaboration [41].
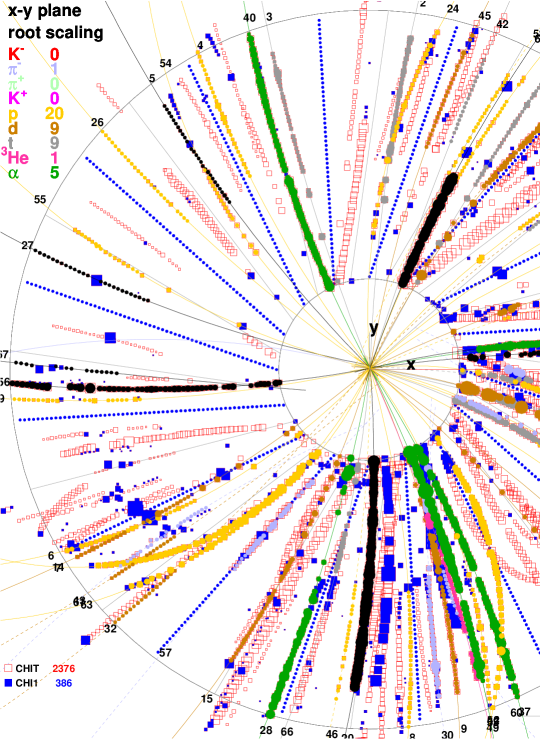
Fig. 2 shows a representation where the performance of the algorithm in track resolution can be followed. It corresponds to a projection in a plane perpendicular to the beam axis of the trajectories associated to the charged particles seen by the CDC in a typical event from central Au+Au collisions at 250 AMeV. The straight lines of dots are representing the anode (sense) wires, while the rest of symbols are the registered hits. Grey symbols are belonging to reconstructed tracks and the open squares are their mirrored counterparts. The dark full squares are the leftovers remained unassigned to any track.
The mass identification performance of CDC using specific energy loss () versus transverse momentum divided by charge () of the detected particles can be followed in Fig. 4. A cross-check of the present calibration of CDC [42] was done using comparison with our earlier data measured with Si-CsI telescopes [43]. Good agreement between the two sets of data, in spectral shape and yields, was obtained. However, using only the CDC information, the A=3 branch contains a mixed contribution from 3He and tritium (t) fragments (as can be seen in Fig.3). Consequently, the momentum associated to 3He fragments will be underestimated by a factor of two if =1, corresponding to hydrogen isotopes, is considered. Based on the phase space distribution of 3He and t obtained in one of our previous experiments [43], the contribution of 3He to A=3 yield for a given range (using =1) is smaller that 15%. As it can be seen later, this amount of contamination does not influence different systematics of A=3 fragments. They nicely fall between those corresponding to A=2 and A=4 fragments.
|
|
|
![[Uncaptioned image]](/html/nucl-ex/0008007/assets/x3.png)
![[Uncaptioned image]](/html/nucl-ex/0008007/assets/x4.png)
Most of the events were registered under “medium bias” (MB) trigger, corresponding to different values for the outer Plastic Wall multiplicity as a function of energy and mass of the colliding systems, such to reduce the background contribution written on tape, estimated from target free runs to be below 5%.
Fig. 4 shows the multiplicity distribution of the reaction products detected and identified by CDC, CMUL, as function of (the sums run over all products detected in an event) for the energy of 250A MeV under hardware “medium bias” trigger. As expected, besides a clear correlation between these two observables, producing the ridge of the displayed distribution, strong fluctuations are visible. The trends observed in this representation are in good qualitative agreement with the microscopic transport model prediction, particularly the IQMD version [44], extensively used for the present analysis. At large impact parameters (low CMUL and values) the particle multiplicity has a higher selectivity of the collision geometry, while towards higher centrality (larger CMUL and values) the does better. Following similar recipe as the one used in Phase I for PMUL [45], a CMUL selection was devised in order to select the collision geometry.
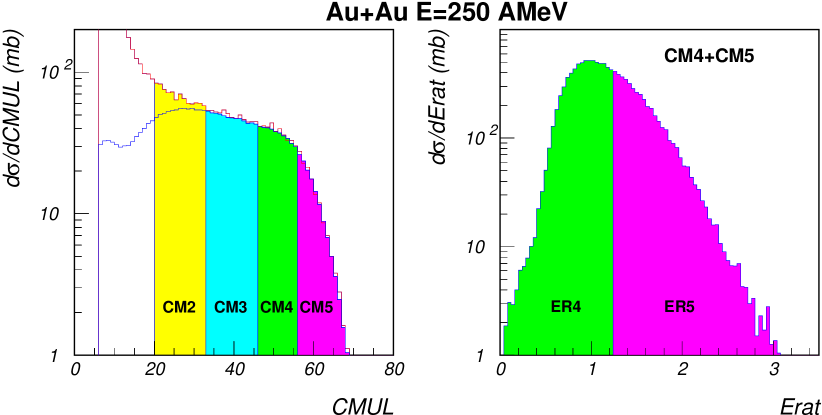
In Fig. 5 we show the CMUL distribution (both for minimum and medium bias triggers) and the distribution for CM4+CM5 bins. The CM2 and CM3 regions have been used in order to select impact parameters in the range of 6–8 fm and 4–6 fm, respectively and ER4 and ER5 for 2–4 fm and 0–2 fm, respectively. The impact parameter values have been obtained using a geometrical “sharp cut-off” approximation for the reaction cross section.
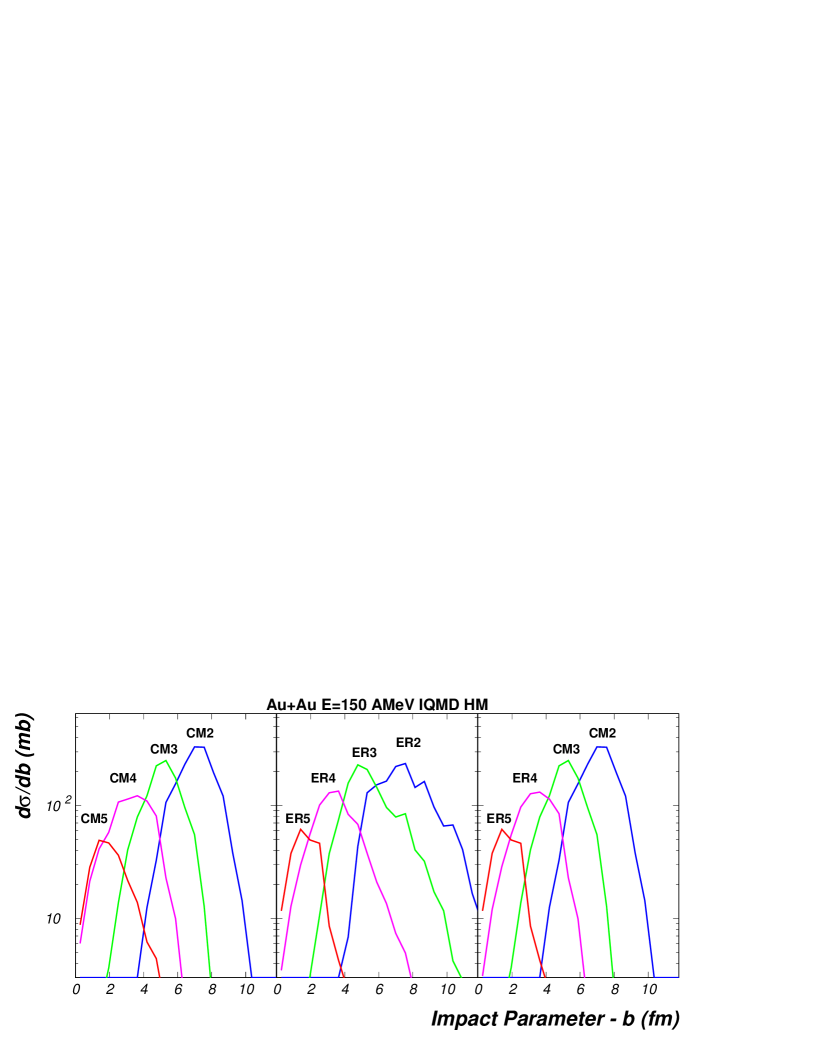
To check our centrality selection method we used events generated with the IQMD model (see Section 4), for which the impact parameter is known. Fig. 6 shows the distribution of the impact parameters for different centralities selected in the way outlined above, for IQMD HM, Au+Au at 150A MeV. As one could see, the argument for our centrality selection based on the CMUL- correlation is confirmed by the model predictions.
2.3 Reaction plane and flow angle determination
Besides the collision geometry, the reaction plane and the sidewards flow angle determination are crucial for the quality of the information extracted from azimuthal distributions. The transverse momentum analysis method has been used for the reaction plane reconstruction [46]. In order to avoid the autocorrelations, the particle of interest was not included in the reaction plane determination. In such a situation the momentum conservation is violated and a recoil correction can be done. One has to mention that such a correction brings back the autocorrelations and, taking into account that we will concentrate on heavy systems, characterized by high particle multiplicity, where the recoil correction is negligible, we rather preferred not to use it.
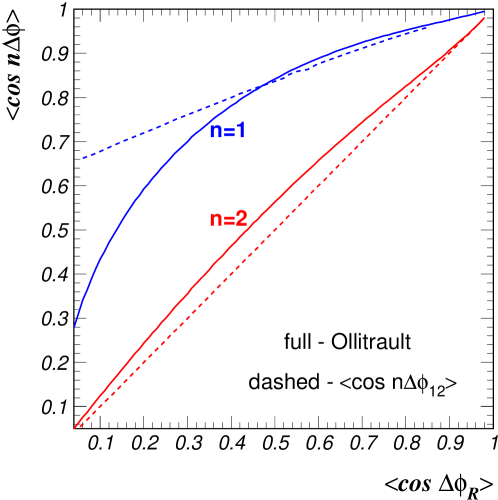
The correction for the reaction plane fluctuations due to the finite multiplicity and detector biases has been estimated using the method proposed by Ollitrault [47]. This is based as the previous one [46] on a random subdivision of each event in two and calculating the difference between the azimuth angles of the reaction planes extracted from these subevents: . The dependence of this correction on the cosine of is represented in Fig. 7. In the same figure is represented the correction using , where =/2 is a measure of the reaction plane resolution [46]. Table 1 contains the values for the energies and centralities studied in the present paper.
| Beam Energy | 90 | 120 | 150 | 250 | 400 |
|---|---|---|---|---|---|
| CM2 | 0.151 | 0.390 | 0.454 | 0.756 | 0.820 |
| CM3 | 0.252 | 0.520 | 0.644 | 0.827 | 0.864 |
| ER4 | 0.283 | 0.527 | 0.679 | 0.797 | 0.817 |
| ER5 | 0.164 | 0.326 | 0.471 | 0.563 | 0.600 |
An example of distribution for ER4 centrality is presented in Fig. 8a for E=250A MeV. Such experimental representations are used for determining the dimensionless parameter using the following expression (Eq. 12 in ref. [47]):
| (1) |
Where z=cos and , are the modified Struve functions. The line in Fig. 8a is the result of a fit using the above equation. The correction factors are then given by Eq. 8 in ref. [47]:
| (2) |
where is the modified Bessel function of order .
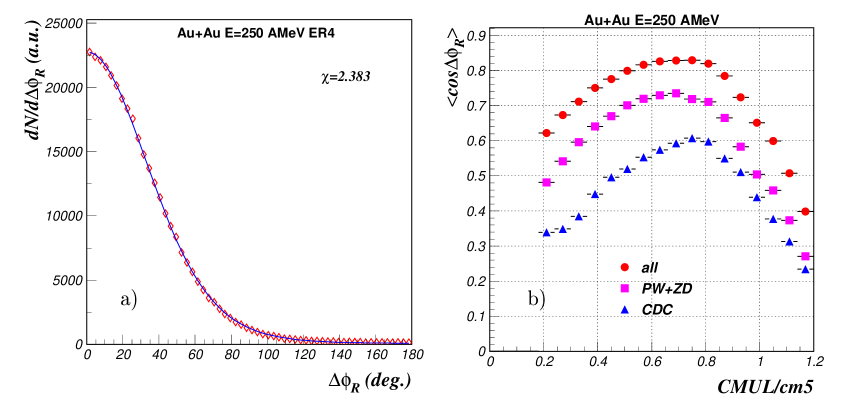
A representation of the as a function of scaled CMUL for the energy of 250A MeV is presented in Fig. 8b. Table 1 shows clearly the influence of the incident energy and of the impact parameter on the precision of the reaction plane determination. For a given incident energy the precision reaches a maximum for an intermediate value of the impact parameter (multiplicity) as it can be seen also in Fig. 8b. This figure shows also the behaviour of as a function of CMUL using the information delivered by the full device or only by some of its subdetectors. In the subsequent analysis, the full detector has been used for the reaction plane reconstruction.
Already in the first paper in which the experimental confirmation of the out-of-plane enhancement was reported [2] it was stressed the importance of performing the azimuthal distribution analysis in a reference system which has the polar axis along the sidewards flow direction [4]. There are many recipes to determine the flow angle. The methods based on the sphericity analysis [48] or on fitting the momentum distribution of the particles detected in the participant region by a three dimensional anisotropic Gaussian distribution [49] may be affected by the contributions coming from the spectator components. Information on flow angle can be also obtained using sidewards flow analysis [52]. In the present analysis we use a different procedure for theta flow determination [23, 50, 9]. The flow angle is defined as being the angle with which all the events in a given centrality class have been rotated in order to maximize the squeeze-out signal or by carefully analyzing the - y distributions in the region of value.
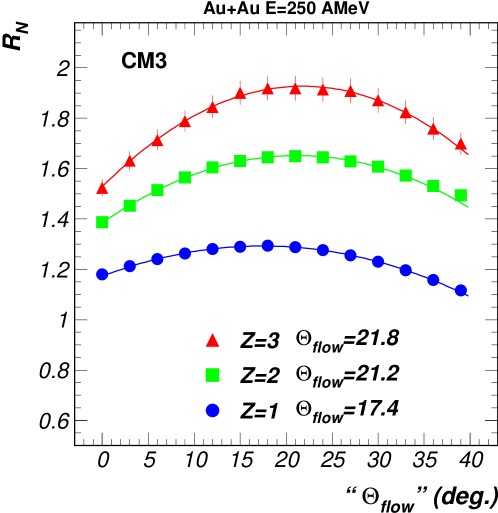
Fig. 9 shows the dependence of :
| (3) |
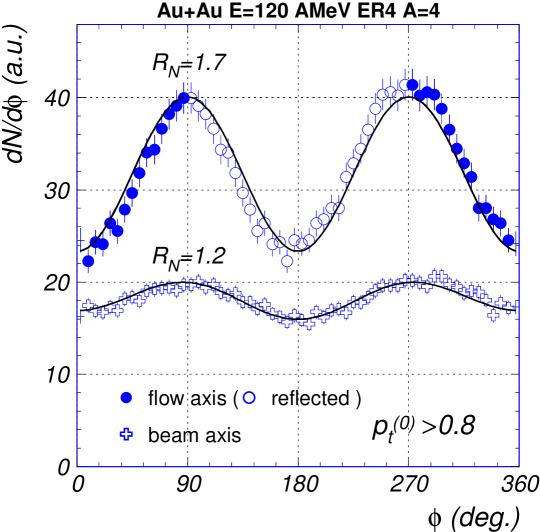
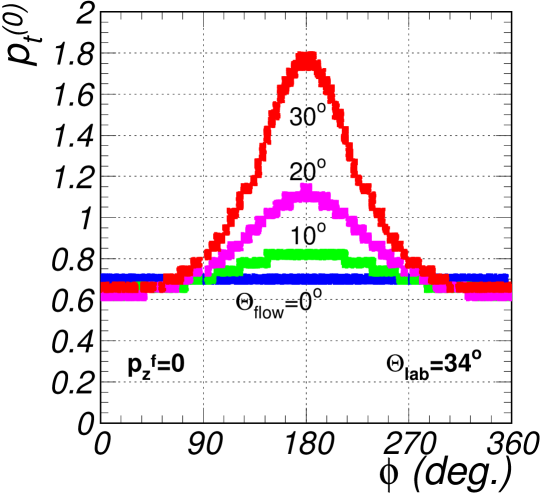
estimated in a coordinate system which has two axes () in the reaction plane and the polar axis at an angle “” relative to the beam axis, as function of the rotation angle “” for 250A MeV incident energy and CM3 centrality bin. As one could see, the maximum value of and the width of its distribution as a function of rotation angle “” shows a dependence on the mass of the analyzed particle. The mass dependence of the distribution width is a direct consequence of the sidewards flow profile. Part of this coming from thermal fluctuations, it is natural that with increasing the mass of the analyzed particle the distribution becomes narrower [52]. If extracted from a standard sidewards flow analysis is affected by the flow profile [52], the mean value of distribution as a function of “” does not depend on it. Nevertheless, the data still show a mass dependence of . It could be attributed to the dynamics of the collision. The light particles quite probable are originating from the initial stage of the collision, when the sidewards flow is not yet developed and transparency effects are more important, leading to lower values of the sidewards flow angle. On the contrary, heavier fragments could originate from later stages of the collision, when the sidewards flow has developed. Part of this pattern could be also due to preequilibrium and sequential emission processes. Already for Z=2 and Z=3 fragments the difference is negligible. Consequently, the values used in the present analysis correspond to these reaction products. In order to see the difference between the azimuthal distributions in the rotated reference system along the sidewards flow direction and in the non-rotated one, along the beam axis, we represent in Fig. 10 the corresponding two azimuthal distributions for the energy of 120A MeV. We have selected here particles of mass A=4, the centrality bin ER4 and normalized transverse momentum per nucleon to the projectile momentum per nucleon in the c.m. system 0.8.
The effect of the rotated reference frame on the values makes unnecessary any other argument for the need of carrying out these types of studies in this reference system.
2.4 The influence of the detector acceptance
The FOPI device having an azimuthal symmetry [36, 38, 39], the border regions between different subdetectors are symmetric relative to the beam axis. In other words, the transition between two consecutive subdetectors, which causes small shadows (see Fig. reffig-1), takes place for a given rapidity at a given transverse momentum, and remains constant as a function of azimuth (). Once the reference frame is rotated, the symmetry is broken and the dependence of these regions have to be carefully treated. Fig. 11 shows as an example how the =34∘ region (at midrapidity in the rotated system, =0) which corresponds to the borderline between CDC and forward Plastic Wall is seen in a representation in reference frames rotated relative to the beam axis by different values.
Due to this reason, for 0.8, where the phase space is covered mainly by the CDC, the analyzed azimuthal range was [0∘,90∘] and [270∘,360∘]. The complete distributions have been obtained by reflecting these ranges relative to 90∘ and 270∘, respectively.
3 Experimental Results
In the present paper the azimuthal distributions are analyzed in a reference frame rotated in the reaction plane by . The midrapidity region is selected by the polar angular range in the rotated reference frame =80∘–100∘. For the present study, concentrated on the transition energy such a selection is more adequate than one based on or rapidity.
3.1 Flow angle
The incident energy dependence of determined using the recipe described in the previous chapter is shown in Fig. 12 for different centralities. The source of the slight differences relative to the ones obtained using transverse momentum analysis [52] has been discussed in the previous chapter. An increase of as function of energy and centrality up to 400A MeV and ER4, respectively, can be followed in Fig. 12. The lines, drawn in order to guide the eyes, represent the result of polynomial fits to the experimental points.
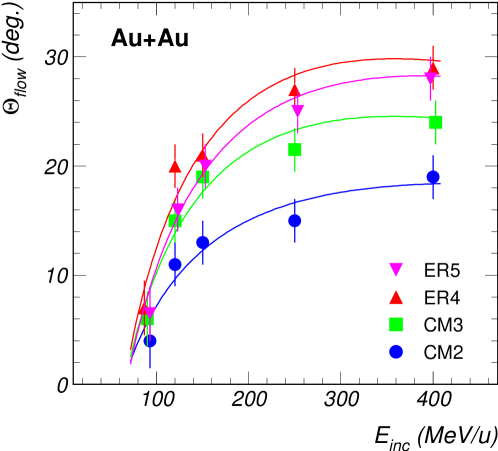
As far as 90A MeV is in the range of values (see later), the determination of using the present procedure is not very accurate. While this does not influence the results relative to studies, it could bring a big uncertainty in the determination (by extrapolation) of the balance energy, . Although this subject will be properly treated in a separate paper, it is worth to mention that the present analysis gives larger values than those reported in ref. [58], but in agreement with our previous results [12].
3.2 General trends of the azimuthal distributions
For a multidimensional study of the incident energy at which a transition from an in-plane enhancement to the out-of-plane preferential emission takes place, the excitation functions of azimuthal distributions for different fragment species, transverse momenta and centrality have been analyzed. We will present some of these trends in what follows.
|
|
|
![[Uncaptioned image]](/html/nucl-ex/0008007/assets/x13.png)
![[Uncaptioned image]](/html/nucl-ex/0008007/assets/x14.png)
For a given incident energy (as an example 150A MeV was taken), the dependence of the azimuthal distributions as a function of the scaled transverse momentum is presented in Fig. 14 for CM3 centrality and A=2 reaction products. The enhancement of the anisotropy with increasing transverse momentum seen in the previous experiments [21, 22, 11] is confirmed. Taking the advantage of a complete phase space coverage of the present configuration of our experimental device, we chose to do the present studies for high transverse momentum , a region where the theoretical predictions [26, 30] suggested that the squeeze-out signal is sensitive to the nuclear matter Equation of State (EoS). For a given incident energy and range of the dependence of the azimuthal distribution as function of mass of the analyzed particle is shown in Fig. 14. The well known enhancement of the azimuthal anisotropy with increasing the mass of the analyzed reaction product is evidenced [4, 26, 22, 23, 11].
|
|
|
![[Uncaptioned image]](/html/nucl-ex/0008007/assets/x15.png)
![[Uncaptioned image]](/html/nucl-ex/0008007/assets/x16.png)
Fig. 16 shows once more the importance of doing these types of studies in the appropriate coordinate frame [2]. In the laboratory system the dependence of the squeeze-out signal as function of the centrality is biased as far as one looks to the projection of these distributions in a plane which is not normal to the flow direction. As one can see from Fig. 12 the flow angle increases with the centrality up to ER4 and this influences the information on the squeeze-out signal as a function of centrality if this information is extracted from the reference frame with the polar axis along the beam direction. This caution has to be taken when one studies the excitation function of the squeeze-out signal. A sample of the incident energy dependence of the azimuthal distributions for A=4 reaction products and for a given range in transverse momentum, 0.81.8, is presented in Fig. 16. All the azimuthal distributions presented are the primordial ones, namely not corrected for the reaction plane resolution.
As it was already mentioned, the azimuthal distributions have been analyzed in the rotated reference frame. They have been fitted with a second order Fourier expansion:
| (4) |
The smooth curves in Fig. 14-16 have been obtained using this fit function. As there are some systematic dips around 90 and 270, caused by the detector acceptance in the rotated reference system and by the influence of the magnetic field on the reaction plane reconstruction, we excluded them from the fits. gives the average value of the distribution, corresponds to in-plane flow and describes the squeeze-out pattern. The squeeze-out ratio can be written:
| (5) |
The values have been corrected for the fluctuations of the estimated reaction plane using the method of ref. [47] explained in the previous chapter:
| (6) |
The corrected quantity , which will be used in the following, is given by:
| (7) |
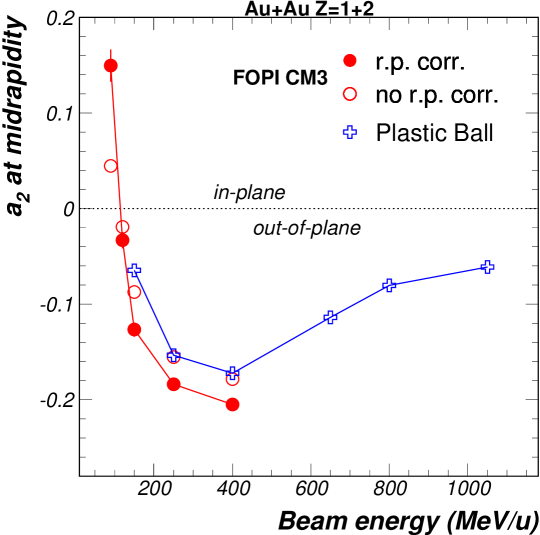
Before proceeding to the detailed analysis of the transition energy, we present in Fig. 17 the excitation function for the coefficient extracted using Z=1 and 2 particles and integrated over the transverse momentum. To compare with the Plastic Ball results [4] which were not corrected for the reaction plane fluctuations, our values are shown both with (full dots) and without (open circles) this correction. Both sets of data are for roughly similar centrality bin (CM3 for the present analysis and MUL3 for the Plastic Ball data). Only for this case, we used a window to select the midrapidity, as it was done in ref. [4], namely 0.1, where is the particle longitudinal c.m. momentum per nucleon in the rotated reference frame and is the projectile momentum per nucleon in the c.m. system. A good agreement between the two data sets can be observed. This agreement is meaningful as the resolutions of the reaction plane for the two experiments are comparable, at least at 400A MeV [4].
The experimental values in the rotated reference frame at the incident energies, centralities, transverse momenta and for reaction species studied in this paper are given in the Appendix.
3.3 Multidimensional analysis of the transition energy
Most of the previous studies of the azimuthal distributions have been concentrated on the behaviour of the observed anisotropies as a function of centrality, rapidity, transverse momentum and the mass of the reaction products. A detailed study of the incident energy at which a transition from in-plane to out-of-plane emission takes place could give deeper insight on the relative contribution of the attractive and repulsive forces, the lifetime of the emitting source, its rotational energy and expansion dynamics. Earlier evidences of such a transition energy have been reported for Au+Au combination [6, 9, 11, 12] and Zn+Ni [5]. These studies have been done in the reference frame in which the polar axis was along the beam direction. At 100A MeV Au+Au collisions a transition from squeeze-out at high centrality to a rotational-like pattern towards peripheral collisions was observed [8].
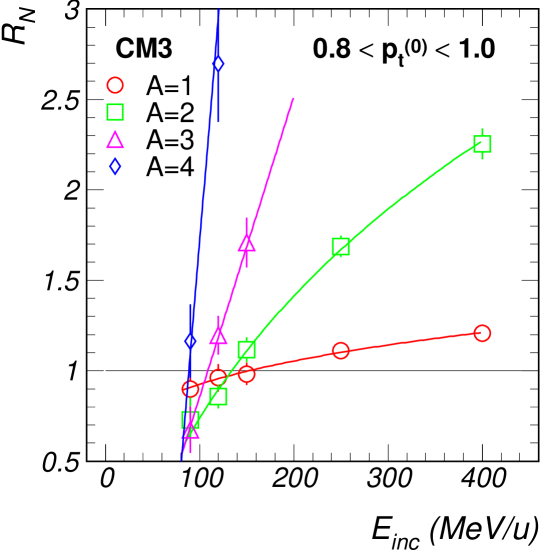
A multidimensional analysis of this transition energy in terms of its dependence as function of centrality, transverse momentum and mass of the reaction products for Au+Au is performed in this section. The procedure used to extract the transition energy () can be followed in Fig. 18. For a given centrality range, transverse momentum and mass of the reaction product, the value is represented as a function of incident energy (). Squeeze-out signal corresponds to while in-plane enhancement of the azimuthal distribution is characterized by . The continuous lines correspond to the result of fits of the experimental points for different masses using a polynomial function. The intersections of these lines with the one corresponding to value are defined as . Fig. 18 shows a clear mass dependence of the transition energy, lower values corresponding to heavier particles for a given centrality and a given range in the scaled transverse momentum .
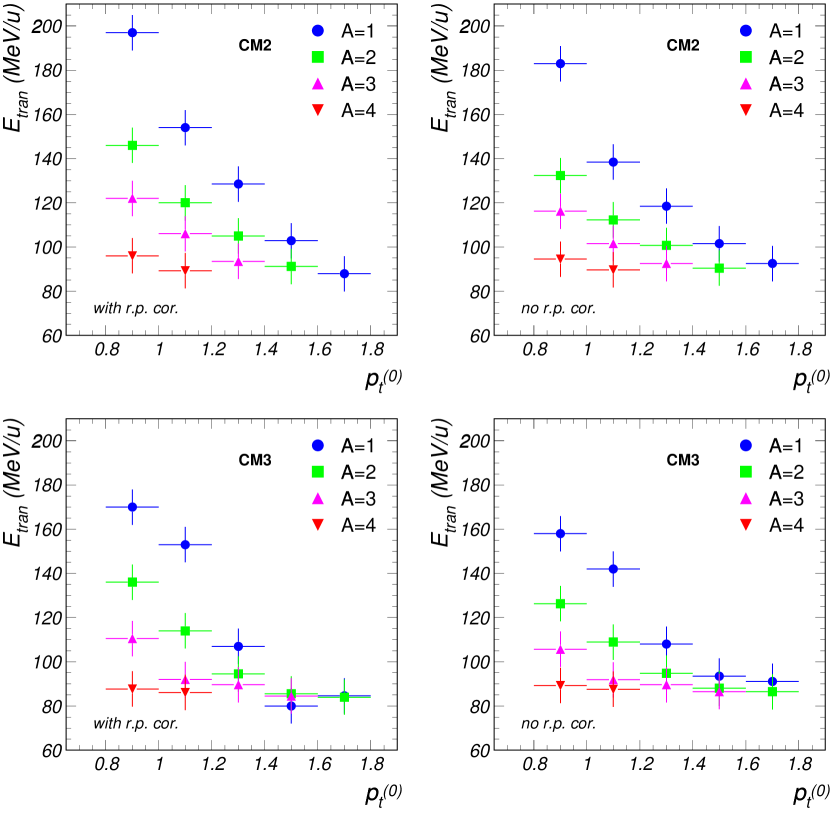
Following the above recipe for different regions of , a two dimensional dependence of the values as function of mass of the analyzed reaction products and transverse momentum can be obtained. The results are presented in Fig. 19 for CM2 and CM3 centrality bins, with and without doing the correction for the reaction plane resolution. As expected, in case of using the correction, the values of are systematically slightly higher, but the trends are identical for both cases. A continuous decrease of the as function of is evidenced for all analyzed particles and the difference in values for different particles is decreasing towards larger values of for both centrality bins. One should mention here that for the cases when values have not been reached was determined by extrapolating the fits of as function of incident energy (.
For a rotating emitting source one would expect a larger in-plane alignment for heavier fragments [7]. This effect alone can not explain the mass dependence of . Therefore a dynamical effect has to be considered besides the pure geometrical one of shadowing. Different particles, originating from different regions of the fireball [34, 53] would feel the shadowing in a different way. At large the contribution comes from larger expansion velocities, earlier expansion phase of the fireball [34, 38] and consequently higher shadowing. At lower values of , the expansion zones are less localized, especially for the light fragments due to larger contribution of the thermal velocities relative to the collective ones, the shadowing being less effective on the in-plane yields. Contaminations coming from sequential evaporation processes smear-out such effects but cannot explain the observed trends.
4 IQMD calculations
The IQMD (Isospin Quantum Molecular Dynamics) [44] is a QMD model [25] which takes into account the isospin degree of freedom for nucleon-nucleon cross section and Coulomb interaction. The main argument for using this version in the present context is based on the fact that IQMD has been successfully used for analyzing flow phenomena in heavy ion collisions [26, 27, 30, 56]. In this work two different parametrizations of the EoS are used, a hard EoS (compressibility = 380 MeV) with momentum dependence of the nucleon interaction (MDI) - HM and a soft EoS (= 200 MeV), with MDI - SM.
The events produced by the model have been filtered by the experimental filter and analyzed in a similar way as the experimental data. Table 2 is the analog of Table 1 but this time representing the resolution of the reaction plane determination for the events generated by this model (HM parametrization). The worse resolution at lower energies for calculated events is the natural consequence of lower yield for intermediate mass fragments predicted by the model. This was the reason why for the calculations we used the true reaction plane.
| Beam Energy | 90 | 120 | 150 | 250 | 400 |
|---|---|---|---|---|---|
| CM2 | 0.005 | 0.087 | 0.378 | 0.771 | 0.859 |
| CM3 | 0.036 | 0.309 | 0.576 | 0.837 | 0.887 |
| ER4 | 0.081 | 0.395 | 0.579 | 0.800 | 0.863 |
| ER5 | 0.074 | 0.161 | 0.266 | 0.498 | 0.543 |
The model was used to estimate the accuracy of the reaction plane corrections [46, 47] and it has been found that the correction used in the present study works fine in what concerns the sidewards flow, but it is overestimated for the squeeze-out signal, especially for the cases 0.4. We also found that applying the correction in the rotated frame slightly overestimates the real squeeze-out signal.
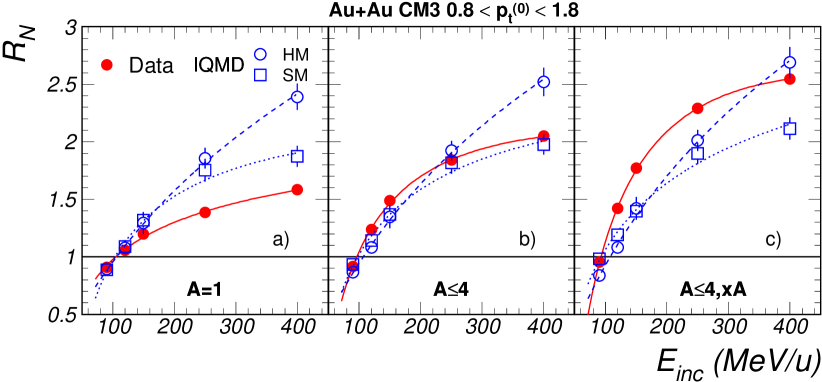
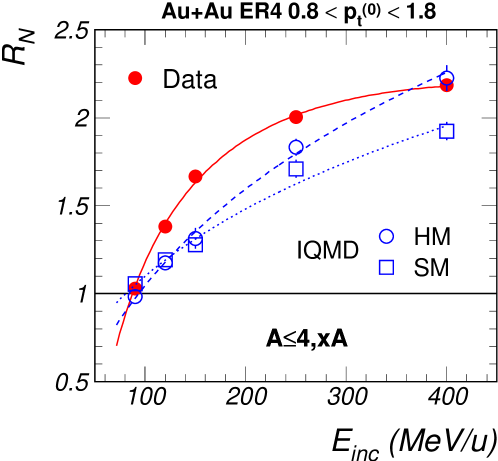
As mentioned already, it is well known that the IQMD model underpredicts the composite particles yield [57, 35] and this drawback is especially important for our energy range. To establish the most meaningful way of comparison, in Fig. 20 we compare the excitation function of the squeeze-out ratio () for data and the model for three ways of particle selection: a) protons only, b) all particles up to alphas and c) a coalescence-type, summing and weighting the azimuthal distribution by each particle’s atomic number (including up to alphas here as well). It was shown within the IQMD model [30] that the sensitivity of the squeeze-out signal to EoS is present only for high transverse momenta. With our selection, , at the higher energies we do see a dependence of the squeeze-out on the EoS. Although the model predicts an increase of the squeeze-out signal with particle mass [26], because the protons are dominating in IQMD the model values for the three cases show only small variations. This is clearly not the case with the data, where the inclusion of the composites, without or with weighting, is increasing the squeeze-out signal significantly. For protons the model predicts larger squeeze-out than the experimental values which compensates the lower yield of composite particles produced by a coalescence mechanism, so that integrating over A4 particles the agreement with the experiment is good. However, Fig. 20 shows that the nucleonic squeeze-out type of flow predicted by the model and the coalescence mechanism used to produce fragments do not explain the experimental observations. This conclusion holds for the ER4 centrality as well. In Fig. 21 we present for this centrality the comparison for A4 particles weighted by their mass. Apart of different magnitudes, the behavior is similar to the one presented in Fig. 20c. All these facts show the importance of a comparison between the experiment and model either for each particle or for coalescence-type (as in Fig. 20c and Fig. 21) and not simply summing-up all particles, when different effects could compensate each other and the agreement is artificially good.
Although at low energies the compressibility should indeed not play an important role, there is a systematic difference between the two parametrizations, the HM version predicting a higher in-plane alignment. Similar trends have been observed at 100A MeV for Au+Au by Aladin-Miniball Collaboration and comparisons with model predictions using BUU calculations show better agreement with a stiff EoS, momentum dependent nuclear interaction and reduced in-medium cross section () [8]. The in-plane enhancement in Ar+V system at energies below 100A MeV was studied using BUU calculations with and a stiff EoS [7]. More recently the transition region was investigated for Ca+Ca system using an isospin dependent BUU model and the dependences of on EoS, MDI and were found to be significant [14].
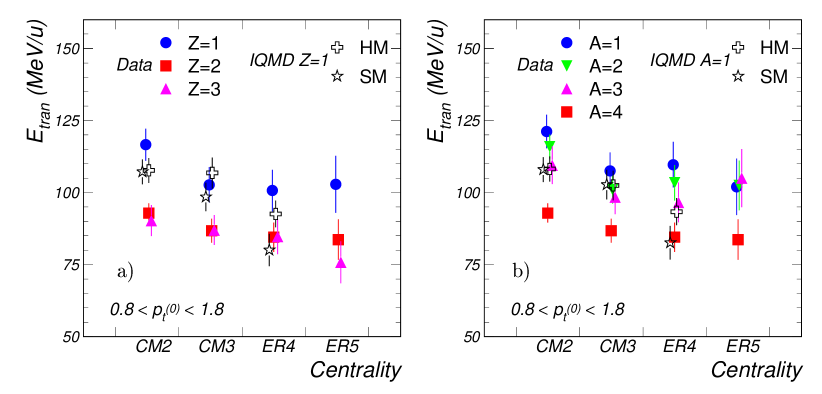
Although the number of generated events was about 2000 per 1 fm interval in the impact parameter, the statistics for particles heavier than A=1 was not sufficient to perform with reasonable accuracy a similar analysis of as the one done for the experimental data. Consequently, we have chosen to do the comparison in a broad interval and as function of centrality. The centrality dependence of the values is presented in Fig. 22, for window and particles selected according to: a) charge (Z=1-3) and b) mass (A=1-4). For Z=1 and A=1, respectively, the experimental data are compared with the IQMD model with the two versions for compressibility. The shown centrality bins (ER5, ER4, CM3 and CM2) correspond to the impact parameter intervals 0-2, 2-4, 4-6 and 6-8 fm, respectively, as it was explained in the second chapter of this paper. Systematically, the SM version predicts lower transition energies relative to HM version. The model predicts an evolution of the as function of centrality for Z=1 and A=1 particles similar to the experiment. With decreasing impact parameter the amount of energy which can be transferred in a rotational-like motion becomes smaller. At the same time the volume of the spectator matter causing the shadowing is reduced, while the number of baryons involved in the fireball region, , increases, contributing to larger expansion [51, 54, 55, 37]. All these effects play a role in the observed experimental azimuthal distributions. However, the centrality dependence of the suggests that the reduction of the rotational motion of the fireball is the main source of the observed effect. One could observe in Fig. 22 a less pronounced dependence on centrality for Z=1 particles relative to the heavier ones. A possible explanation would be that at higher centralities, the three sources of emitting particles, the projectile spectator, the target spectator and the participant zone, are less separated, the mixed contribution being enhanced for lighter reaction products. The contribution from sequential processes brings an additional smearing of anisotropies, increasing artificially the value for lighter particles.
5 Conclusions
Using a new generation of data collected with the complete FOPI experimental device we presented a systematic study of the excitation function of the azimuthal distributions around midrapidity. For Au+Au system for which the most complete excitation function was measured, starting with 90A MeV, a clear transition from in-plane (rotational-like) to out-of-plane (squeeze-out) was evidenced to take place going from lower to higher energies. The incident energy at which this transition takes place, called , was studied as function of mass of reaction products, their scaled transverse momentum () and centrality. Special attention was payed to the sidewards flow angle () determination used to define the rotated reference frame in which all these studies have been done.
In general one could say that a systematic decrease of the values with increasing the mass of the analyzed fragment, the transverse momentum and centrality of the collision was observed. values being the incident energies where the effect of the rotation of a compound system created by the mean field, expansion of a hot and compressed participant zone built-up by many consecutive nucleon-nucleon interactions and the shadowing effect of the colder spectator regions compensate each other, it seems to be an experimental observable which could distinguish between different theoretical models and different approximations used by them. Studying an expanding-rotating hot and compressed fireball in the presence of the shadowing objects can give additional information on the expansion dynamics. The observed decrease of the as a function of the mass of the emitted fragments can be the result of a complex dynamics, indicating that heavier particles for which the thermal contribution is less important are better localized in the expansion process using selection than the lighter ones. When integrating over a large range in momenta, our values are in a good agreement with previous studies which found the transition to take place around 100A MeV.
Detailed comparisons with the IQMD model predictions evidenced the necessity to avoid any kind of fragment mixture in order to draw significant conclusions. Squeeze-out ratio for protons and coalescence-type revealed that nucleonic out-of-plane flow and the coalescence mechanism used by the model to create complex fragments can not explain the experimental observations. The low statistics of IQMD generated events did not allow a similar analysis of as for the experiment. Integrating on , the systematic decrease of values with increasing the collision centrality is reproduced by the model. Although systematically the hard EoS gives larger values, closer to the experimental values, the small difference relative to the soft EoS is not sufficient to draw definite conclusions on the EoS.
Appendix: Experimental values
In this Appendix we present the values of the coefficient for different particle types and ranges in normalized transverse momenta. Remind that these values are the ones obtained from the fit of the experimental data with expression 4, namely without including the correction for the reaction plane resolution. In parentheses we quote the absolute errors on the last digit of the respective number.
| A | 90 | 120 | 150 | 250 | 400 | |
|---|---|---|---|---|---|---|
| 0.8-1.0 | 1 | 0.034(9) | 0.044(9) | 0.020(9) | -0.030(6) | -0.110(6) |
| 2 | 0.07(1) | 0.06(1) | -0.02(1) | -0.230(7) | -0.400(8) | |
| 3 | 0.08(1) | 0.01(1) | -0.12(1) | -0.48(1) | -0.71(1) | |
| 1.0-1.2 | 1 | 0.047(8) | 0.030(9) | -0.004(9) | -0.110(6) | -0.210(7) |
| 2 | 0.06(1) | 0.00(1) | -0.12(1) | -0.400(9) | -0.59(1) | |
| 3 | 0.05(2) | -0.09(2) | -0.31(2) | -0.71(2) | -0.87(2) | |
| 1.2-1.4 | 1 | 0.044(9) | 0.013(9) | -0.060(9) | -0.180(7) | -0.310(8) |
| 2 | 0.04(1) | -0.07(2) | -0.24(2) | -0.55(1) | -0.71(2) | |
| 3 | 0.03(2) | -0.27(4) | -0.55(5) | -0.88(2) | -0.81(6) | |
| 1.4-1.6 | 1 | 0.03(1) | -0.050(9) | -0.12(1) | -0.310(8) | -0.44(1) |
| 2 | 0.01(2) | -0.24(3) | -0.40(3) | -0.72(2) | -0.89(3) |
| A | 90 | 120 | 150 | 250 | 400 | |
|---|---|---|---|---|---|---|
| 0.8-1.0 | 1 | 0.018(9) | 0.022(9) | 0.007(9) | -0.030(6) | -0.060(6) |
| 2 | 0.04(1) | 0.04(1) | -0.04(1) | -0.200(6) | -0.310(7) | |
| 3 | 0.06(1) | -0.04(1) | -0.18(1) | -0.45(1) | -0.62(1) | |
| 1.0-1.2 | 1 | 0.021(8) | 0.025(9) | -0.001(9) | -0.070(6) | -0.140(6) |
| 2 | 0.05(1) | -0.01(1) | -0.12(1) | -0.340(7) | -0.470(9) | |
| 3 | -0.00(2) | -0.15(2) | -0.35(2) | -0.63(2) | -0.77(2) | |
| 1.2-1.4 | 1 | 0.023(8) | -0.010(9) | -0.060(9) | -0.140(7) | -0.230(8) |
| 2 | 0.01(1) | -0.11(2) | -0.26(2) | -0.48(1) | -0.60(1) | |
| 3 | -0.01(2) | -0.29(3) | -0.51(3) | -0.78(3) | -0.89(3) | |
| 1.4-1.6 | 1 | 0.014(9) | -0.040(9) | -0.14(1) | -0.230(8) | -0.35(1) |
| 2 | -0.03(2) | -0.20(2) | -0.39(2) | -0.62(2) | -0.71(2) | |
| 3 | -0.10(5) | -0.49(6) | -0.60(6) | -0.8(2) | - |
| A | 90 | 120 | 150 | 250 | 400 | |
|---|---|---|---|---|---|---|
| 0.8-1.0 | 1 | 0.021(9) | 0.034(9) | 0.012(9) | -0.026(6) | -0.068(6) |
| 2 | 0.04(1) | 0.04(1) | -0.05(1) | -0.19(1) | -0.24(1) | |
| 3 | 0.04(1) | -0.04(1) | -0.12(1) | -0.32(1) | -0.48(1) | |
| 1.0-1.2 | 1 | 0.019(8) | 0.037(9) | 0.008(9) | -0.068(6) | -0.12(1) |
| 2 | 0.04(1) | -0.02(1) | -0.09(1) | -0.24(1) | -0.37(1) | |
| 3 | -0.02(2) | -0.10(2) | -0.30(2) | -0.49(1) | -0.61(2) | |
| 1.2-1.4 | 1 | 0.014(8) | 0.018(9) | -0.052(9) | -0.13(1) | -0.21(1) |
| 2 | 0.02(2) | -0.06(2) | -0.17(2) | -0.42(1) | -0.49(1) | |
| 3 | -0.05(3) | -0.22(3) | -0.35(3) | -0.66(2) | -0.75(2) | |
| 1.4-1.6 | 1 | 0.029(9) | -0.074(9) | -0.09(1) | -0.20(1) | -0.26(1) |
| 2 | -0.04(2) | -0.20(2) | -0.25(2) | -0.52(2) | -0.58(2) |
| A | 90 | 120 | 150 | 250 | 400 | |
|---|---|---|---|---|---|---|
| 0.8-1.0 | 1 | 0.03(1) | 0.02(2) | 0.00(2) | -0.01(2) | -0.03(1) |
| 2 | 0.03(1) | 0.03(1) | -0.01(2) | -0.09(2) | -0.15(1) | |
| 3 | 0.02(1) | 0.00(2) | -0.05(2) | -0.11(1) | -0.23(1) | |
| 1.0-1.2 | 1 | 0.00(1) | 0.01(1) | -0.01(2) | -0.04(2) | -0.05(2) |
| 2 | 0.01(1) | 0.00(1) | -0.04(2) | -0.12(2) | -0.21(2) | |
| 3 | 0.00(2) | -0.04(2) | -0.13(2) | -0.25(2) | -0.34(2) | |
| 1.2-1.4 | 1 | 0.01(1) | -0.03(2) | -0.05(2) | -0.08(2) | -0.11(2) |
| 2 | 0.01(2) | -0.03(2) | -0.11(2) | -0.19(2) | -0.28(2) | |
| 3 | 0.01(2) | -0.08(2) | -0.14(2) | -0.36(2) | -0.39(4) |
| Centrality | Z | 90 | 120 | 150 | 250 | 400 |
|---|---|---|---|---|---|---|
| CM2 | 1 | 0.040(4) | -0.022(4) | -0.084(4) | -0.240(3) | -0.330(3) |
| 2 | 0.02(1) | -0.23(2) | -0.43(2) | -0.82(2) | -0.93(2) | |
| 3 | 0.01(1) | -0.37(4) | -0.64(5) | -0.84(4) | - | |
| CM3 | 1 | 0.022(4) | -0.034(3) | -0.120(3) | -0.241(2) | -0.298(3) |
| 2 | -0.04(1) | -0.33(1) | -0.56(1) | -0.80(1) | -0.89(1) | |
| 3 | -0.06(2) | -0.43(2) | -0.72(3) | -0.97(3) | - | |
| ER4 | 1 | 0.017(6) | -0.029(5) | -0.10(4) | -0.190(3) | -0.240(3) |
| 2 | -0.05(1) | -0.29(1) | -0.49(1) | -0.68(1) | -0.78(1) | |
| 3 | -0.09(3) | -0.40(2) | -0.61(2) | -0.84(2) | -0.88(4) | |
| ER5 | 1 | 0.008(6) | -0.010(9) | -0.05(1) | -0.10(1) | -0.14(1) |
| 2 | -0.02(1) | -0.15(2) | -0.29(2) | -0.43(2) | -0.54(2) | |
| 3 | -0.06(2) | -0.18(5) | -0.36(4) | -0.48(4) | -0.63(5) |
| Centrality | A | 90 | 120 | 150 | 250 | 400 |
|---|---|---|---|---|---|---|
| CM2 | 1 | 0.034(6) | -0.001(4) | -0.050(4) | -0.170(6) | -0.260(6) |
| 2 | 0.052(6) | -0.010(6) | -0.110(6) | -0.361(4) | -0.50(1) | |
| 3 | 0.06(1) | -0.05(1) | -0.19(1) | -0.55(1) | -0.74(2) | |
| 4 | 0.02(1) | -0.23(2) | -0.43(2) | -0.82(2) | -0.93(3) | |
| CM3 | 1 | 0.017(6) | -0.013(4) | -0.070(8) | -0.160(4) | -0.221(4) |
| 2 | 0.025(6) | -0.05(1) | -0.15(1) | -0.34(1) | -0.43(1) | |
| 3 | 0.03(1) | -0.10(1) | -0.27(2) | -0.52(1) | -0.66(1) | |
| 4 | -0.04(1) | -0.33(2) | -0.56(2) | -0.80(2) | -0.89(2) | |
| ER4 | 1 | 0.018(8) | -0.007(9) | -0.061(8) | -0.110(6) | -0.160(6) |
| 2 | 0.023(8) | -0.03(1) | -0.11(1) | -0.27(1) | -0.33(1) | |
| 3 | 0.00(1) | -0.06(1) | -0.20(2) | -0.39(1) | -0.52(1) | |
| 3 | -0.05(1) | -0.29(2) | -0.49(2) | -0.68(2) | -0.78(2) | |
| ER5 | 1 | 0.006(6) | -0.005(9) | -0.027(9) | -0.044(8) | -0.079(8) |
| 2 | 0.011(8) | -0.03(1) | -0.05(1) | -0.13(1) | -0.20(1) | |
| 3 | 0.01(1) | -0.04(2) | -0.09(2) | -0.17(1) | -0.29(2) | |
| 4 | -0.02(1) | -0.15(1) | -0.29(1) | -0.43(1) | -0.54(2) |
References
- [1] W.K. Wilson et al., Phys. Rev. C 41 (1990) R1881.
- [2] H.H. Gutbrod et al., Phys. Lett. B 216 (1989) 267.
- [3] M. Demoulins et al., Phys. Lett. B 241 (1990) 476.
- [4] H.H. Gutbrod et al., Phys. Rev. C 42 (1990) 640.
- [5] R. Popescu et al., Phys. Lett. B 331 (1994) 285.
- [6] A. Buţă et al., GSI Scientific Report 1994, 95-1 (1995) 57.
- [7] W.K. Wilson et al., Phys. Rev. C 51 (1995) 3136.
- [8] M.B. Tsang et al., Phys. Rev. C 53 (1996) 1959.
- [9] A. Andronic, FOPI Collaboration, Proc. International Research Workshop on Heavy Ion Physics at Low, Intermediate and Relativistic Energies using 4 Detectors, ed. M. Petrovici et al. (World Scientific, Singapore, 1997) p. 209.
- [10] A. Buţă et al., ref. [9], p. 137.
- [11] N. Bastid, FOPI Collaboration, Nucl. Phys. A 622 (1997) 573.
- [12] P. Crochet, FOPI Collaboration, Nucl. Phys. A 624 (1997) 755.
- [13] W.Q. Shen et al., Phys. Rev. C 57 (1998) 1508.
- [14] Y.-M. Zheng et al., Phys. Rev. Lett. 83 (1999) 2534.
- [15] F. Garcias et al., Phys. Lett. B 255 (1991) 311.
- [16] H. Stöcker et al., Phys. Rev. C 25 (1982) 1873.
- [17] D. Brill et al., Phys. Rev. Lett. 71 (1993) 336.
- [18] L.B. Venema et al., Phys. Rev. Lett. 71 (1993) 835.
- [19] P. Senger, ref. [9], p. 313; Y. Shin et al., Phys. Rev. Lett. 81 (1998) 1576.
- [20] Y. Leifels et al., Phys. Rev. Lett. 71 (1993) 963.
- [21] D. Lambrecht et al., Z. Phys. A 350 (1994) 115.
- [22] D. Brill et al., Z. Phys. A 355 (1996) 61.
- [23] S. Wang et al., Phys. Rev. Lett. 76 (1996) 3911.
- [24] G.M. Welke et al., Phys. Rev. C 38 (1988) 2101.
- [25] J. Aichelin, Phys. Rep. 202 (1991) 233.
- [26] C. Hartnack et al., Phys. Lett. B 336 (1994) 131.
- [27] C. Hartnack et al., Mod. Phys. Lett. A 9 (1994) 1151.
- [28] S.M. Kiselev, Phys. Lett. B 265 (1991) 229.
- [29] S. Bass et al., Phys. Rev. C 51 (1995) 3343.
- [30] S. Bass et al., Z. Phys. A 352 (1995) 171.
- [31] W. Reisdorf and H.G. Ritter, Annu. Rev. Nucl. Part. Sci. 47 (1997) 663.
- [32] S.C. Jeong, FOPI Collaboration, Phys. Rev. Lett. 72 (1994) 3468.
- [33] W.C. Hsi et al., Phys. Rev. Lett. 73 (1994) 3367.
- [34] M. Petrovici, FOPI Collaboration, Phys. Rev. Lett. 75 (1995) 5001.
- [35] W. Reisdorf, FOPI Collaboration, Nucl. Phys. A 621 (1997) 493.
- [36] A. Gobbi, FOPI Collaboration, Nucl. Instr. and Meth. in Phys. Res. A 324 (1993) 156.
- [37] A. Andronic et al., GSI Scientific Report 1996, 97-1 (1997) 52; GSI Scientific Report 1997, 98-1 (1998) 55.
- [38] M. Petrovici, FOPI Collaboration, ref. [9], p. 216.
- [39] J. Ritman, FOPI Collaboration, Nucl. Phys. B (Proc. Suppl.) 44 (1995) 708.
- [40] D. Pelte, FOPI Collaboration, Z. Phys. A 357 (1997) 215.
- [41] N. Herrmann, FOPI internal communication.
- [42] A. Andronic, PhD Thesis, National Institute for Physics and Nuclear Engineering, Bucharest (1998).
- [43] G. Poggi, FOPI Collaboration, Nucl. Phys. A 586 (1995) 755.
-
[44]
C. Hartnack, PhD Thesis, University of Frankfurt,
GSI Report 93-05 (1993).
C. Hartnack et al., Eur. Phys. J. A 1 (1998) 151. - [45] N. Herrmann, FOPI Collaboration, Nucl. Phys. A 553 (1993) 739c.
- [46] P. Danielewicz and G. Odyniec, Phys. Lett. B 157 (1985) 146.
- [47] J.-Y. Ollitrault, nucl-ex/9711003 (1997), Nucl. Phys. A 638 (1998) 195.
- [48] M. Gyulassy et al., Phys. Lett. B 110 (1982) 185.
- [49] J. Gosset et al., Phys. Lett. B 247 (1990) 233.
- [50] P. Danielewicz, discussion during INT-94-3, Seattle.
- [51] P. Danielewicz and Q. Pan, Phys. Rev. C 46 (1992) 2002.
- [52] F. Rami, FOPI Collaboration, Nucl. Phys. A 646 (1999) 367.
- [53] R. Kotte, FOPI Collaboration, Eur. Phys. J. A 6 (1999) 185.
- [54] M.A. Lisa et al., Phys. Rev. Lett. 75 (1995) 2662.
- [55] R. Pak et al., Phys. Rev. C 54 (1996) 1681.
- [56] S. Soff et al., Phys. Rev. C 51 (1995) 3256.
- [57] M.B. Tsang et al., Phys. Rev. Lett. 71 (1993) 1502.
- [58] D.J. Magestro et al., Phys. Rev. C 61 (2000) 021602(R).