The RHIC Zero Degree Calorimeters
, , , , ,
1 Introduction
High Energy collisions of nuclei usually lead to the emission of evaporation neutrons from both “beam” and “target” nuclei. At the RHIC heavy ion collider with 100GeV/u beam energy, evaporation neutrons diverge by less than milliradians from the beam axis. Neutral beam fragments can be detected downstream of RHIC ion collisions (and a large aperture Accelerator dipole magnet) if 4 mr but charged fragments in the same angular range are usually too close to the beam trajectory. In this ’zero degree’ region produced particles and other secondaries deposit negligible energy when compared with that of beam fragmentation neutrons.
The purpose of the RHIC zero degree calorimeters (ZDC’s) is to detect neutrons emitted within this cone along both beam directions and measure their total energy (from which we calculate multiplicity). The ZDC coincidence of the 2 beam directions is a minimal bias selection of heavy ion collisions. This makes it useful as an event trigger and a luminosity monitor[1] and for this reason we built identical detectors for all 4 RHIC experiments. The neutron multiplicity is also known to be correlated with event geometry [2] and will be used to measure collision centrality in mutual beam interactions.
2 Design Goals
The RHIC ZDC’s are hadron calorimeters. Their longitudinal segmentation (2 , ) is determined by practical, mechanical considerations. Electro-magnetic energy emission into this region is predicted to be negligible so this measurement is not emphasized in our design. Since the spatial distribution of neutrons emitted in the fragmentation region carries only limited information about the collision, the calorimeters are built without transverse segmentation.

The Forward Energy resolution goal was determined by the need to cleanly resolve the single neutron peak in peripheral nuclear collisions. The natural energy spread of emitted single neutrons[1] being approximately a resolution of at GeVappeared reasonable.
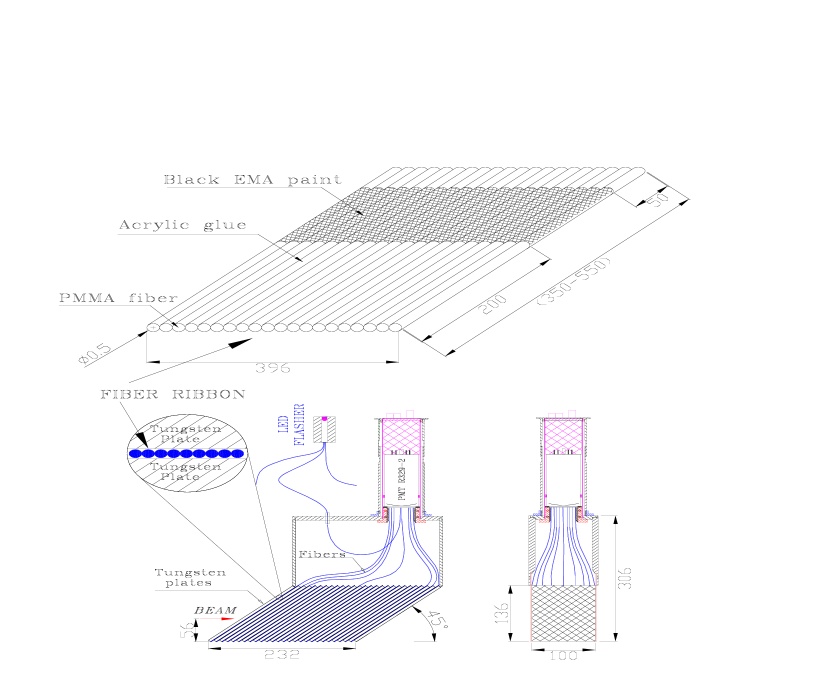
The limited available space between the RHIC beams at the ZDC location imposes the most stringent constraint on the calorimeter design. As can be seen from Figure 1, the total width of the calorimeters is only cannot exceed 10 cm (equal to 1 nuclear interaction length () in tungsten). We designed the ZDC’s to minimize the loss in energy resolution due to shower leakage, which can cause fluctuation in measured shower energy through dependence on position of impact and random fluctuations in shower development.
Finally, the ZDC’s are required to withstand a dose of rad., which is the expected exposure during several years of RHIC operation[3].
3 Simulations
We simulated shower development, light production and transport in the optical components using Geant 3.21 [4] for 2 basic sampling calorimeter designs:
-
1.
Pb absorber with scintillator sampling
-
2.
Pb, Cu or absorber, each with undoped fiber optical ribbons in the sampling layer
The ZDC sampling technique which we adopted for this project, is sensitive to Cerenkov light produced by charged shower secondaries in a commercial, PMMA based [12] communication grade optical fiber with characteristics given in a single free parameter was used to match the (wavelength dependent) optical fiber attenuation coefficient and photomultiplier quantum efficiency to the observed signal from testbeam ’s. Hadronic shower simulation is based on Geisha [4] with a low energy cutoff of 0.5 MeV on electrons and photons and 1 MeV on hadrons.
| Absorber | Space for fibers | Modules/Layers | |
|---|---|---|---|
| Prototype W-ZDC | Tungsten | 1.0 mm | 4(8;218) |
| (100x150x5 mm3) | 27 | ||
| Prototype Cu-ZDC | Copper | 1.0 mm | 8(7.5;79) |
| (100x150x10 mm3) | 10 | ||
| Production ZDC | Tungsten alloy | 1.4 mm | 3(5.1;149) |
| (100x187x5 mm3) | 27 |
| Outer Diam | Material/Index | |
|---|---|---|
| Core | 0.45 mm | PMMA/1.49 |
| Cladding | 0.50 | fluorine doped/1.40 |
| Surface Prep | 0.60 | White Silicone Rubber/ EMA |
The fiber sampling layers, in all cases, consist of a single ribbon of 0.5mm diameter fibers as shown in Fig.5. We chose an orientation of relative to the incident beam direction which roughly coincides with the Cerenkov angle of =1 particles in PMMA. PMMA fibers are readily available with a numerical aperture(NA) of 0.5 (defined as the fractional solid angle which is transmitted in the fiber). This aperture corresponds to a maximum angle of . Quartz fibers generally have a smaller aperture.
In our simulations we studied:
-
1.
the effects of transverse shower leakage
-
2.
energy resolution dependence on sampling frequency and photostatistics
-
3.
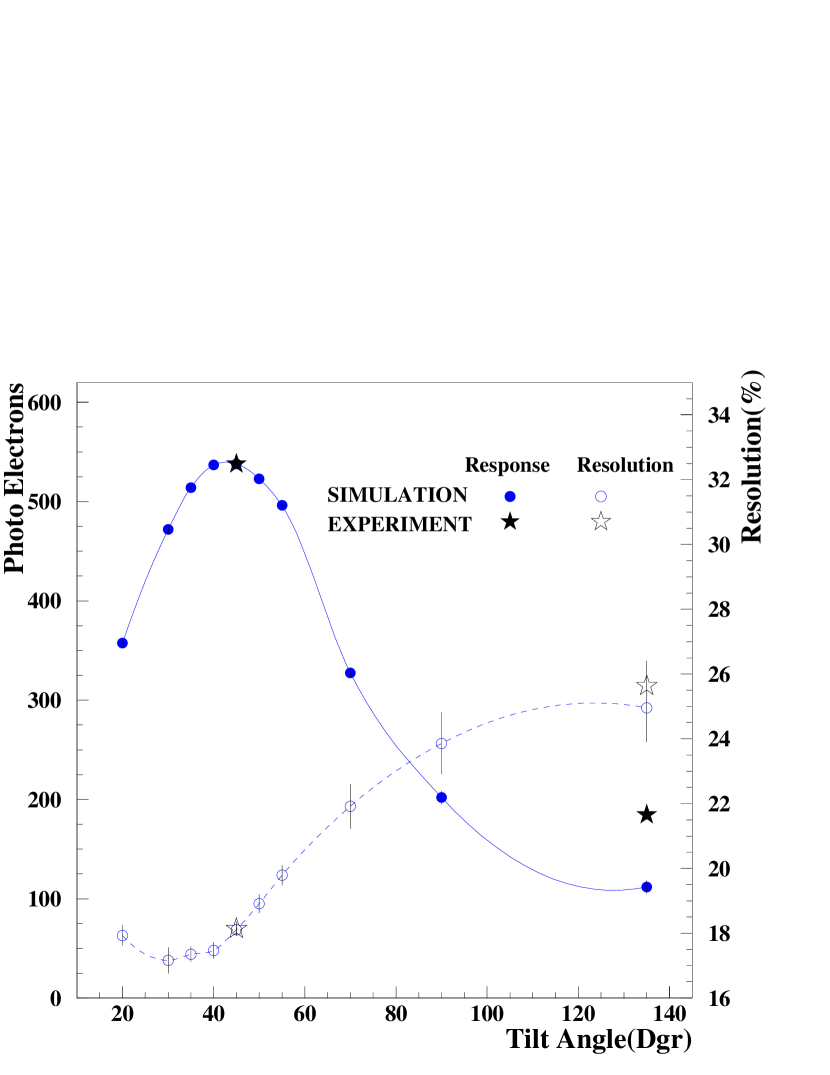
dependence on fiber orientation
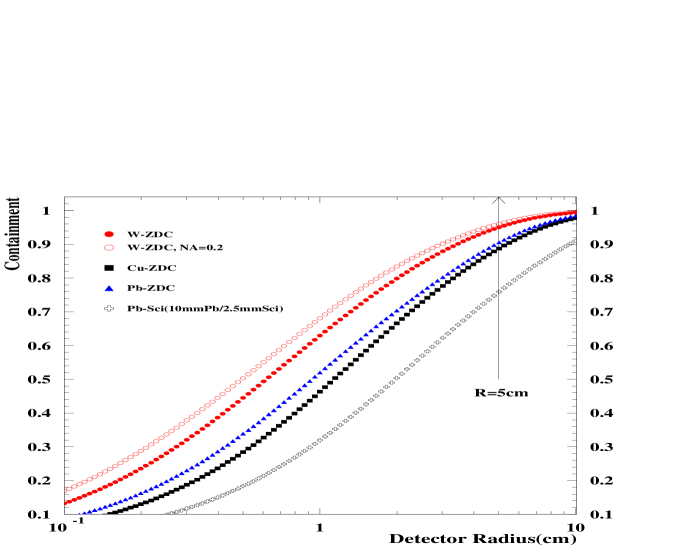
Figure 2 illustrates the main advantage of the zdc(Cerenkov) vs. scintillator sampling technique. We plot the fraction of the calorimeter signal (photons transported in the scintillator or fiber) produced as a function of radius from 100 GeV protons impacting the calorimeter. A radius of 5 cm (the maximum space allowable at the RHIC location) contains 75% of the shower signal in the case of a Pb/Scintillator calorimeter with 10mm(Pb) and 2.5mm(Scint) layers. The same dimension Pb calorimeter with Cerenkov sampling yields 91% containment. In general the Cerenkov technique with Pb absorber achieves a given level of containment with a factor of 2 smaller radius than with scintillator.
Changing from Pb to absorber yields almost another a factor of 2 reduction in containment radius. On the other hand, reducing the fiber numerical aperture in the sampling layer produces only a negligible change.
3.1 Cerenkov light Production and Capture
Because the optical fibers only transport Cerenkov light emitted nearly aligned with the fiber axis, this detector is most sensitive to charged particles which cross at approximately to the fiber axis. The lower energy shower component, which is more diffuse, is therefore suppressed.
This filtering effect is reduced by multiple coulomb scattering of electrons and by the increased path length traversed by particles with less than angle to the fiber direction.
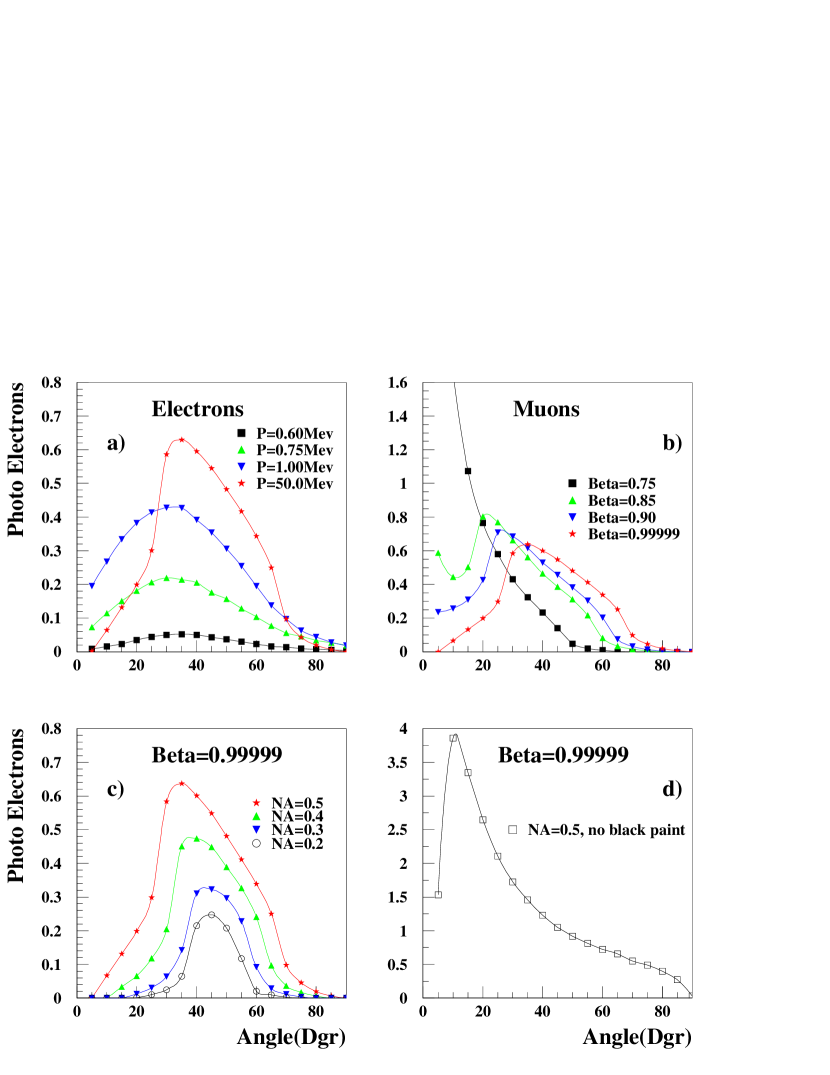
In Figure 3 we plot the average photoelectron yields for muons and electrons traversing a ribbon of 0.5mm diameter fibers as a function of incidence angle. Comparing Figures 3a and 3b we see that multiple coulomb scattering has a significant effect on the response to low energy electrons. The improved angular filtering that could be obtained with lower NA fibers (see fig. 3c) is largely offset by this effect and the lower light yield which results from small aperture.
Fig. 3d illustrates the effect of “cladding modes” which we suppress by applying an ExtraMural Absorber (latex based black paint) over the cladding layers of our fibers.
3.2 Relative response to electrons and hadrons
Figure 4 shows the calculated response of our zdc modules to electrons and protons as a function of beam energy. The response to beam energy (100 GeV) protons is a factor of 2 lower than for electrons of the same energy. In this sense, our design is extremely non-compensating. This lack of compensation is the dominant source of energy resolution of the calorimeter for 100 GeV protons since the response changes with fluctuations in the energy fraction carried by ’s in the hadronic shower.
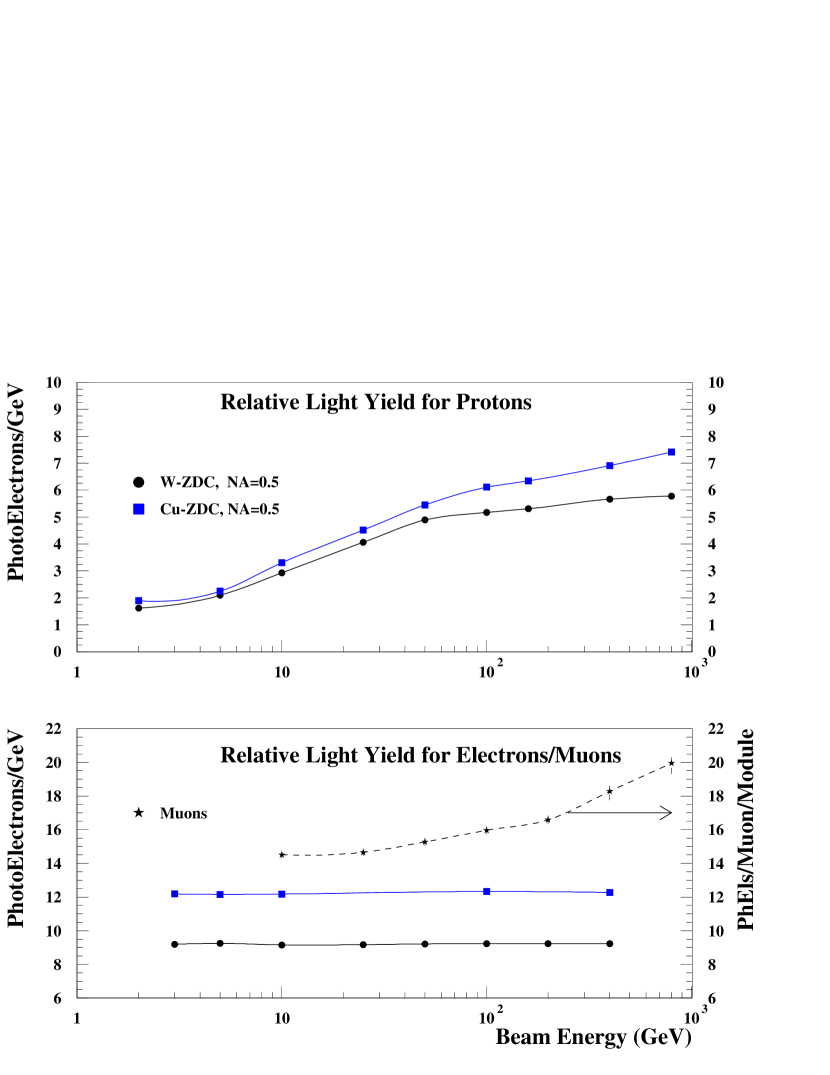
3.3 Linearity
In our application, where the calorimeter is used to count beam energy neutrons, linearity is not a design consideration. It is clear from figure 4 that , while the response to electrons is linear with energy, the hadron response is not. Response to neutrons and protons approaches zero at low energies. Also shown in figure 4 is the response to muons, which is energy independent up to GeV/c at which point radiative energy loss becomes significant. We use cosmic ray and beam muons for detector pre-calibration.
3.4 Energy resolution
The role of the main components of the energy resolution is illustrated in Table 3, where we fit simulated calorimeter response to 50–800 GeV proton induced showers to a stochastic plus a constant term. Our results are a poor fit to a quadratic sum.
| Absorber | PhEls | “e/h” | Stochastic | Constant |
|---|---|---|---|---|
| per 100Gev | ratio | term(%) | term(%) | |
| W (2.5mm) | 1036 | 1.79 | 69.67.9 | 10.10.7 |
| W(5.0mm) | 518 | 1.78 | 84.64.8 | 9.10.5 |
| W(10mm) | 256 | 1.78 | 92.48.2 | 8.80.6 |
| Cu(10mm) | 611 | 2.01 | 111.77.0 | 9.30.6 |
| Pb(10mm) | 422 | 1.80 | 91.08.9 | 9.50.6 |
If we were to increase the sampling frequency from 1/2 to twice our design value of 1 per 5mm tungsten absorber there would be a negligible change in resolution at 100 GeV. This configuration would reduce the stochastic term due to photostatistics from 6 to 3% but leave the dominant resolution term, due to non-compensation, unchanged.
4 Module Construction
For 10 cm wide modules with 5mm absorber plates, a convenient longitudinal segmentation is 1 module per 2 nuclear interaction lengths of absorber. The total fiber area matches that of a standard PMT.
For the prototype modules we obtained 2.5 mm thick cast plates from a Russian manufacturer and bonded them in pairs. For the production modules we obtained machined plates of tungsten alloy with threaded mounting holes from a US manufacturer[10]. The thickness uniformity of our plates is 0.1mm.
The fiber ribbons were wound on a mandrill and then impregnated with a low viscosity white silicone rubber glue[9]. The glue covers the active region of the fibers (200 mm) and protects the fiber surface in the region of the fiber/absorber sandwich. The light guide section of the remaining fibers is treated with an extramural absorber to suppress cladding modes in the fiber. The fiber ends closest to the PMT are collected into an acrylic compression fitting and impregnated with epoxy (Bicron BC-600) . After the epoxy cured the fiber bundle was polished using a diamond tipped cutting tool on a milling machine.
The far end of the fibers were rough cut and left untreated. Our optical simulations assume no reflection at this end.
We removed 3 fibers at random from the ribbons in each module and coupled them to a single external optical connector for PMT gain monitoring. This allowed for stable optical connections of all modules in the calorimeter stack to a single light flasher and therefore reliable tracking of relative PMT gain.
As illustrated in Fig. 5, the fiber ribbons were trimmed to different lengths depending on their positions along the module. Lengths were adjusted to compensate for the difference in arrival time between the front and back of the module. We kept the length of the acrylic fibers to a minimum because we were concerned about additional light production in fibers outside the absorber region- primarilly due to shower leakage at the top of the calorimeter.
We selected a 12-stage general purpose PMT (Hamamatsu R329-2)[13] and mounted it with a 0.5mm air gap from the fiber bundles. PMT’s were selected for photocathode non-uniformity over the 39mm diameter area corresponding to the fiber bundle size. Linearity of the PMT/ voltage divider combination is also an important criterion for this project since the calorimeters will be used to measure up to 40 or so beam energy neutrons in collisions of gold ions.
5 Precalibration
All modules were tested for relative light yield using cosmic muons incident along the beam axis and a standard PMT with calibrated response. Very little variation () was observed among the 24 tungsten modules we eventually installed for this project.
During testbeam operation we also installed trigger counters to select a small contamination of muons which were present in the proton beam. Muons traversing the full calorimeter were used to adjust relative gains of the 4 PMT’s in the prototype calorimeter.
6 Testbeam performance
The calorimeters were mounted on a table with remote - (transverse to the beam) positioning in the CERN North area, downstream of experiment NA49. The beam size and position was defined to cm using a 1cm square scintillation counter directly upstream of the table.
The main purpose of the beam test was to study the response and resolution of the calorimeter as a function of position.
The and 160 GeV/c protons were selected using a beam Cerenkov counter. The beam energy spread was typically 1%. PMT current pulses were integrated and digitized using a standard commercial ADC (LRS 2249w).
7 Results
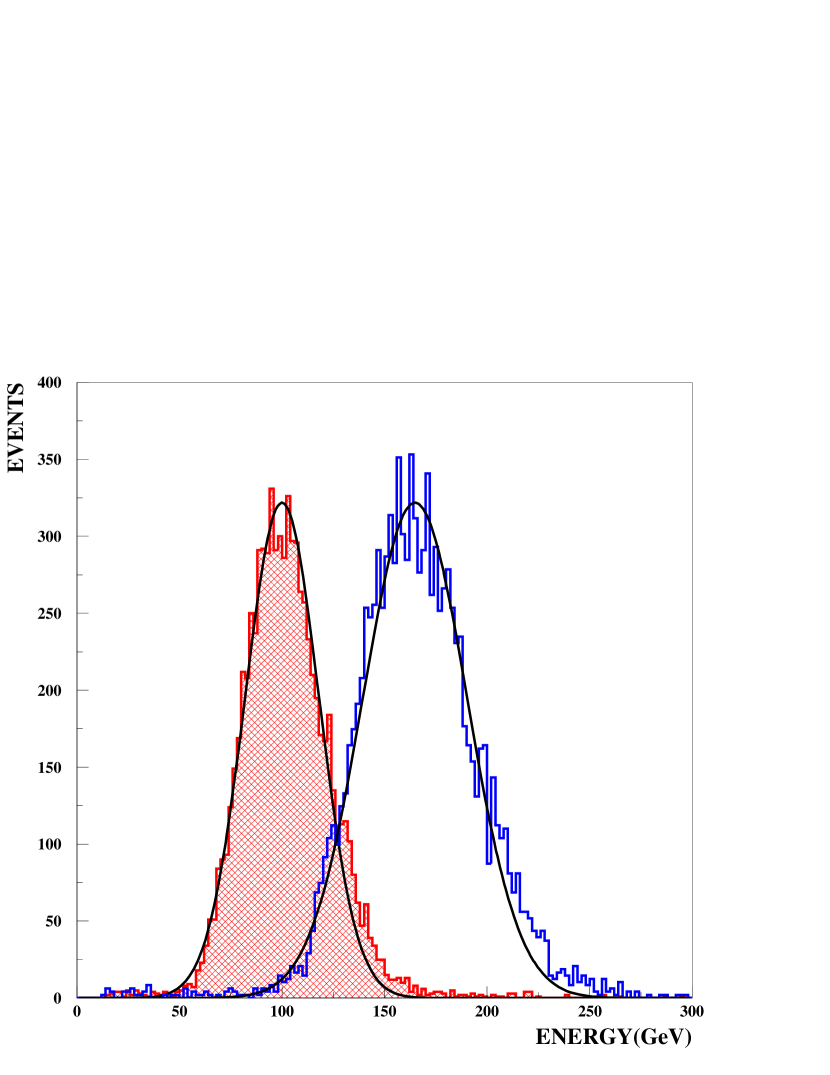
Figure 6 shows the measured lineshapes with 100 and 160 GeV incident protons. Our energy scale is normalized using the 100 GeV point. Also shown in Fig. 6 are the expected distributions based on Geant simulation. The distributions are well represented by a gaussian resolution function and the response is linear over this limited energy range.
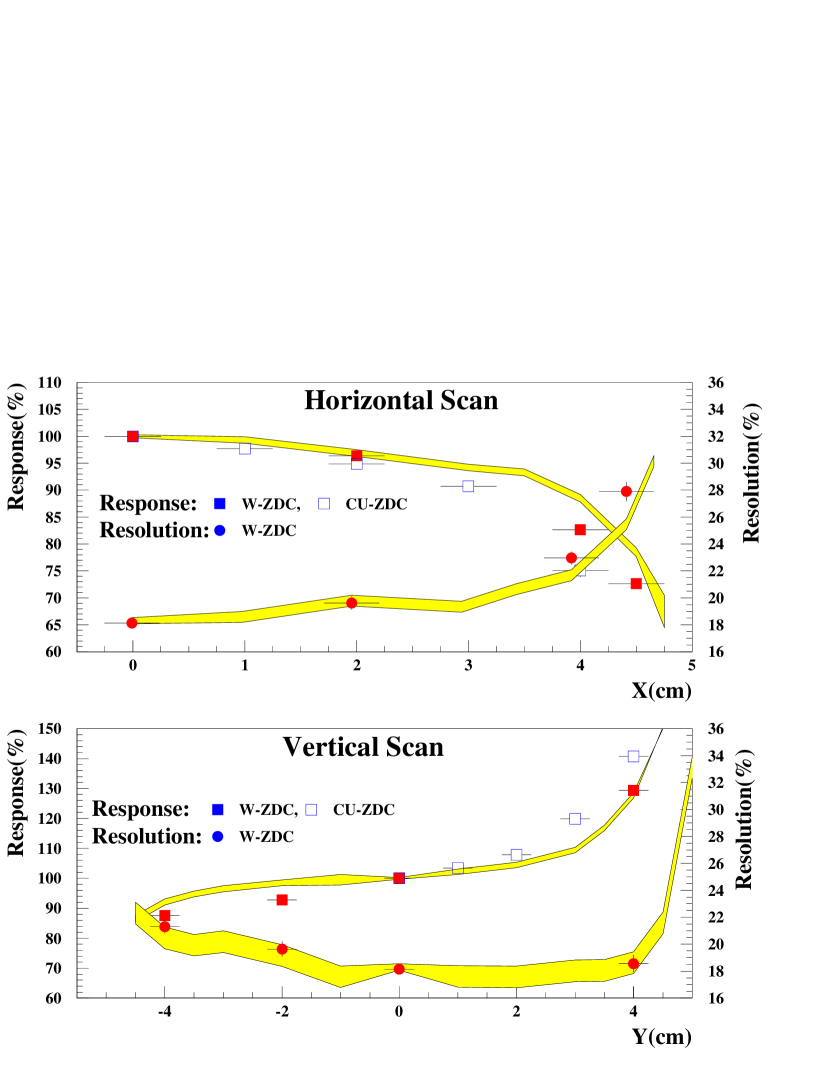
In Figure 7 we plot the prototype calorimeter response vs. impact position for both and Cu module types. The position scans show essentially uniform response to within 1cm of the calorimeter edge along the horizontal direction -in good agreement with simulation. In the vertical scans there is an abrupt increase in response near the upper edge of the modules. Our simulation reproduces this edge effect. It can be traced to shower leakage into the fibers above the absorber.
In order to improve module uniformity in the “beam region” we increased the height of the module in our final production design from 10 cm to 13.6 cm.
The tungsten calorimeter uniformity and energy resolution were essentially unchanged when the energy deposited in the 4th module was neglected. Typically 1–2% of the energy is seen in this module. The energy resolution at 100 GeV changes from 17.6 to 19% when it is removed.
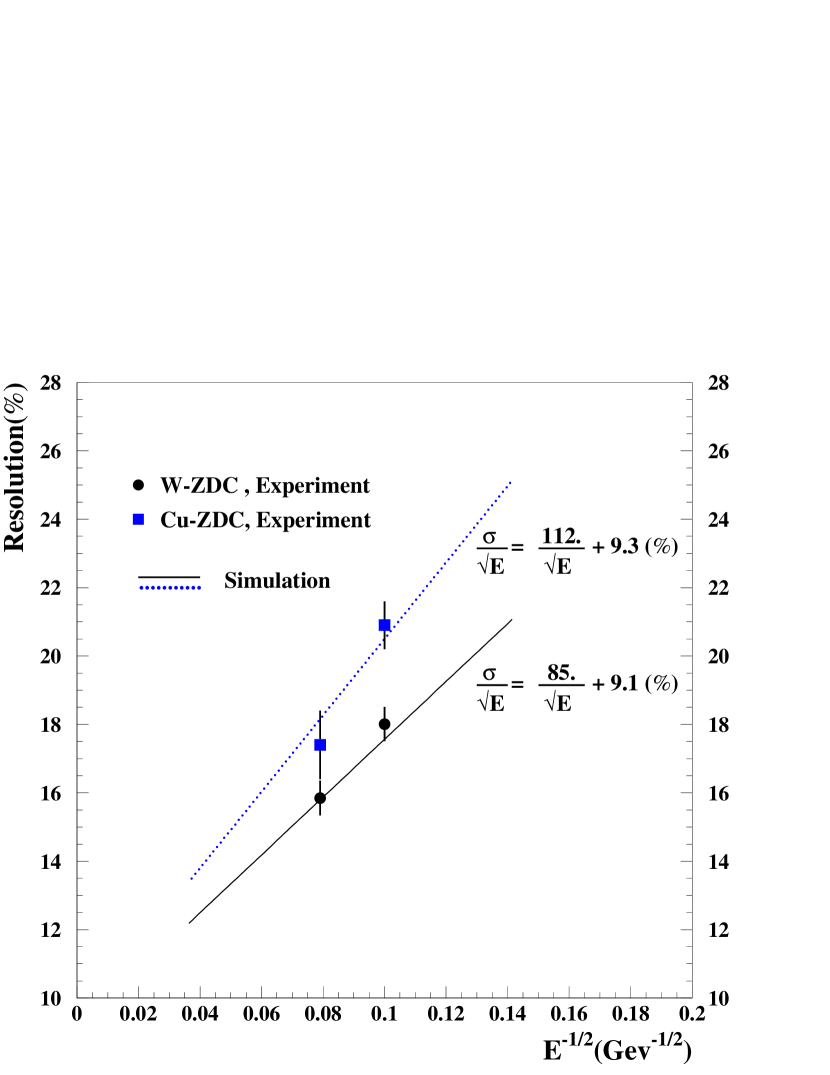
In Figure 8 we plot the resolution (r.m.s./mean) for both prototypes (using the full 8 ) at 100 and 160 GeV and compare them to simulation. Part of the resolution of this calorimeter is due to the unequal response to electrons and photons relative to hadrons. This introduces a limiting resolution due to fluctuations in the shower composition (ie vs charged ). Hence the non-zero intercept in Fig. 8.
Our calorimeter is designed to measure beam energy neutrons incident at the front face ( to the fiber direction). A by-product of the directional response of the calorimeter is that it is relatively insensitive to background particles from “beam halo” and other sources. In order to demonstrate this suppression, we inverted the calorimeter in the testbeam ( to fiber direction). The expected performance is shown in Fig. 9 together with the measured response in the 2 configurations. The small discrepancy in the data could be accounted for by a 10% reflection coefficient at the open ends of the fiber.
7.1 Timing Resolution
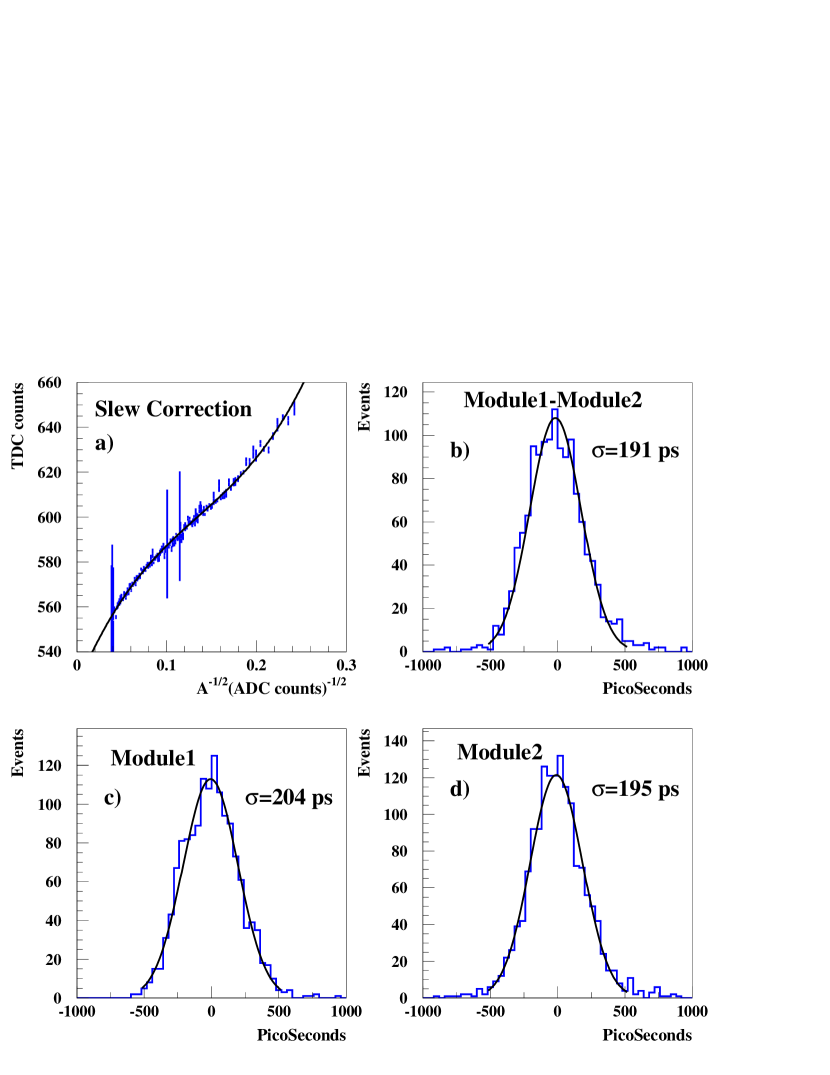
The ZDC signal formation is intrinsically fast. The main spread in transit time of light emitted in the fibers results from propagation along the fibers and depends on the vertical position of shower particles. A design goal of the calorimeters is to achieve better than 200 psec time-of-flight resolution. Time-of-flight measurement from the interaction to each of the ZDC’s is useful since it can be used to determine the origin of beam interactions (which is proportional to the time difference).
In practice, the arrival time of the shower will be measured by digitizing the time at which 1 or more PMT signals cross a threshold. We corrected the measured time taking into account the signal risetime(2.5 nsec) and the measured amplitude.
Fig. 10a shows a fit to the testbeam data from which we determine the slew correction. In fig. 10b we plot the time difference between signals from modules 1 & 2. In figures 10c,d we plot the time difference of the two module signals compared to the beam defining scintillation counters. The resolution of the beam defining scintillators is no better than that of the zdc but it is plausible , based on figure 10b, that the intrinsic ZDC resolution is and it is certainly better than 200 psec. With a 150 psec resolution the interaction point is measured to an error of 3 cms which is perfectly adequate for our application.
7.2 Radiation tolerance
PMMA is not a particularly radiation tolerant plastic. It is known to lose transparency more readily than Polystyrene, for example. Earlier measurements on acrylic fibers [11] showed about a factor of 2 decrease in attenuation length per rad of gamma irradiation. Doses at the ZDC location in RHIC have been estimated at 10krad/yr. This is confirmed by dosimetry studies during RHIC commissioning.
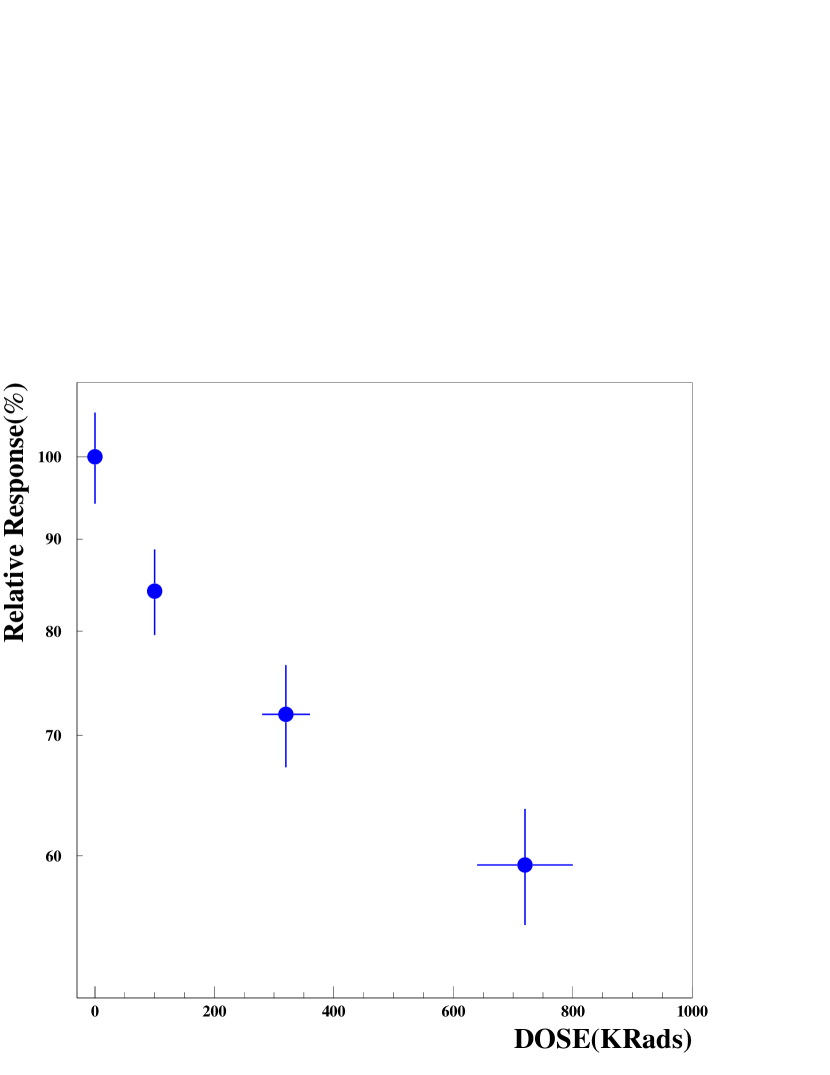
We exposed one of our prototype modules to much higher integrated doses at a reactor[14]. Approximately 2/3 of the total dose was due to gamma rays and the remainder was due to neutrons The module light output was measured using cosmic ray muons before and after 3 successive exposures up to a maximum of 700 krad (7000Gy). The results are plotted in fig. 13, from which we conclude that the useful lifetime of the calorimeters will be krad.
8 Production Design Choices
The Copper and Tungsten modules both had adequate performance for our application. The tungsten module yields 1-2% better energy resolution at 100 GeV and slightly better flatness of response over the calorimeter face. We chose to proceed with the Tungsten module design primarily because of the modularity and other aspects of the mechanical design. Also the modules are more compact, which is an advantage given our limited space. The module height was increased in the production design to reduce shower leakage into the fiber bundles. Also the calorimeter depth was reduced from 8 to since the shorter calorimeter gives essentially identical performance.
9 Discussion
Studies of the Cerenkov/fiber sampling technique with electrons [8] and have been reported elsewhere. One device [5] was built and operated in a fixed target experiment. Here we report first measurements with a design hadron calorimeter and the first application of this method at a collider.
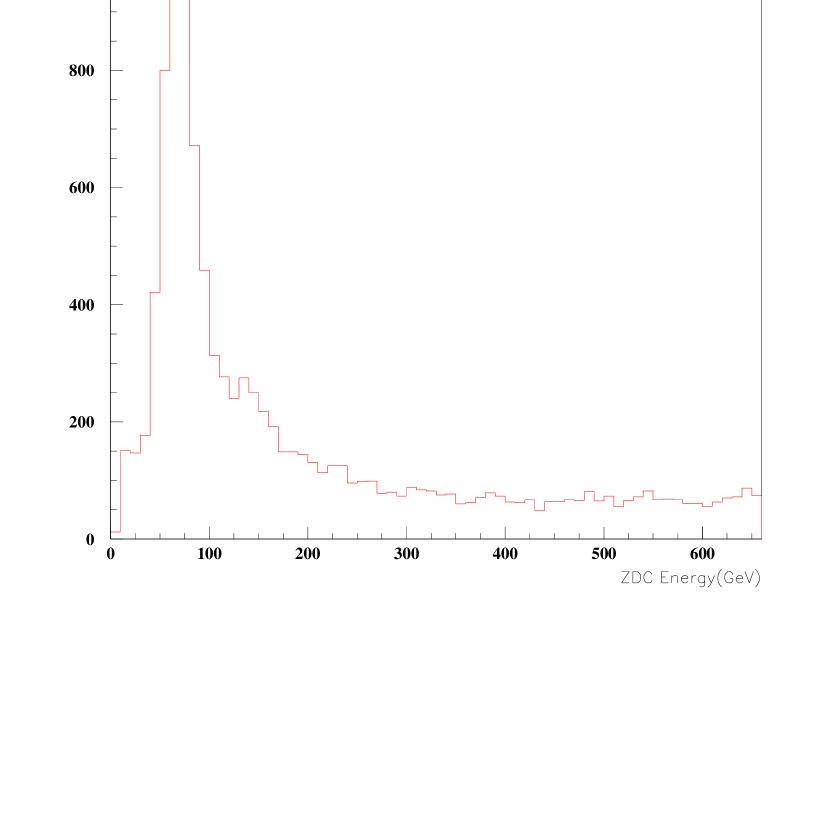
During the first colliding beam operation at RHIC, with Gold Ions accelerated to and stored at 65GeV/nucleon beam energy, the ZDC’s have been used for beam tuning and as a trigger by the RHIC experiments. Figure 12 shows an online Energy distribution from one of the calorimeters in the PHENIX experiment. The single neutron peak, which is seen clearly in this distribution, has been used to confirm the energy calibration of the calorimeters.
10 Acknowledgements
We wish to thank Phillipe Gorodetzky for many useful discussions throughout this project. We also thank Alice Mignerey and Bill Christie for assistance at various stages. The kind assistance of the NA49 collaboration which allowed us to share their beamline and counting house is also acknowledged. This work has been partially supported under DOE grant #DE-AC02-98CH10886 and DE-FG03-93ER40773 .
References
- [1] A.J. Baltz, C. Chasman and S.N. White, “Correlated forward - backward dissociation and neutron spectra as luminosity monitor in heavy ion colliders,” Nucl. Instrum. Meth. A417, 1 (1998), nucl-ex/9801002.
- [2] H. Appelshauser et al. [NA49 Collaboration], “Spectator nucleons in Pb + Pb collisions at 158-A-GeV,” Eur. Phys. J. A2, 383 (1998).
- [3] A.J.Stevens, private communication.
- [4] “GEANT. Detector description and simulation tool” CERN Program Library Long Writeup W5013,CERN Geneva (1993)
- [5] R.Arnaldi et al. Nucl. Instrum. Meth. A411 , (1998) 1.
- [6] N.Akchurin et al. Nucl. Instrum. Meth. A409 ,(1998) 593.
- [7] S.N. White, “Forward measurements in RHIC and LHC heavy ion collisions,” Nucl. Instrum. Meth. A409, 618 (1998).
- [8] M. Lundin et al., “On the electromagnetic energy resolution of Cerenkov fiber calorimeters,” Nucl. Instrum. Meth. A372, 359 (1996).
- [9] Manufactured by ETI, Fields Landing, Ca. 95537.
- [10] Kulite Tungsten Corp. , 160 E. Union Ave., E.Rutherford, NJ 07073.
- [11] J.P.de Brion- Comparative Study of Aging of PMMA and PS optical Fibers. CEN- Saclay report DPHPE 86-07(1986).
- [12] Raytella fiber, Toray Industries, 600 Third Ave. NYC 10016.
- [13] ”Photomultipler Tubes and Assemblies For Scintillation Counting And High Energy Physics”, 1998 Catalog, Hamamatsu Photonics.
- [14] Nuclear Science Center at Texas A&M.