A network analysis of committees in the
United States House of Representatives
Abstract
Network theory provides a powerful tool for the representation and analysis of complex systems of interacting agents. Here we investigate the United States House of Representatives network of committees and subcommittees, with committees connected according to “interlocks” or common membership. Analysis of this network reveals clearly the strong links between different committees, as well as the intrinsic hierarchical structure within the House as a whole. We show that network theory, combined with the analysis of roll call votes using singular value decomposition, successfully uncovers political and organizational correlations between committees in the House without the need to incorporate other political information.
Introduction
Much of the detailed work in making United States law is performed by Congressional committees and subcommittees. This contrasts with parliamentary democracies such as Great Britain and Canada, where a larger part of the legislative process is directly in the hands of political parties or is conducted in sessions of the entire parliament. While the legislation drafted by committees in the U.S. Congress is subject ultimately to roll call votes by the full House and Senate, the important role played by committees and subcommittees makes the study of their formation and composition vital to understanding the work of the American legislature.
Several contrasting theories of committee assignment strategies have been developed in the political science literature (mostly through qualitative studies, although there have been some quantitative ones as well) [1, 2, 3, 4, 5, 6], but there is no consensus explanation of how committee assignments are initially determined or of how they are modified from one session of Congress to the next. A question of particular interest is whether political parties assign committee memberships essentially at random or if important Congressional committees can be seen using objective analysis to be “stacked” with partisan party members.
The work presented here approaches these issues using a different set of analytical tools from those previously employed. We use the tools of network theory, which have been successfully applied in recent years to characterize a wide variety of complex systems.[7, 8]. As we show, network theory is particularly effective at uncovering structure among committee and subcommittee assignments without the need to incorporate any specific knowledge about committee members or their political positions.
Although there has been only limited previous work on networks of Congressional committees, there is a considerable body of literature on other collaboration networks, such as the boards of directors of corporations [9, 10, 11, 12, 13], which occupy a position in the business world somewhat analogous to that occupied by committees in Congress. It has been shown that board memberships and the networks they create play a major role in the spread of attitudes, ideas, and practices through the corporate world, affecting political donations [10], investment strategies [14], and even the stock market on which a company is listed [15]. Studies of the structure of corporate networks have shed considerable light on the mechanisms and pathways of information diffusion [16, 17, 18], and it seems plausible that the structure of congressional committees would be similarly revealing.
Networks of committees
We study the U.S. House of Representatives and construct bipartite or “two-mode” networks based on assignments of Representatives to committees and subcommittees (henceforth called just “committees” for simplicity) in the 101st–108th Houses (1989–2004). (Table 1 lists the House leadership during this period.) These networks have two types of nodes, Representatives and committees, with edges connecting each Representative to the committees on which they sit.
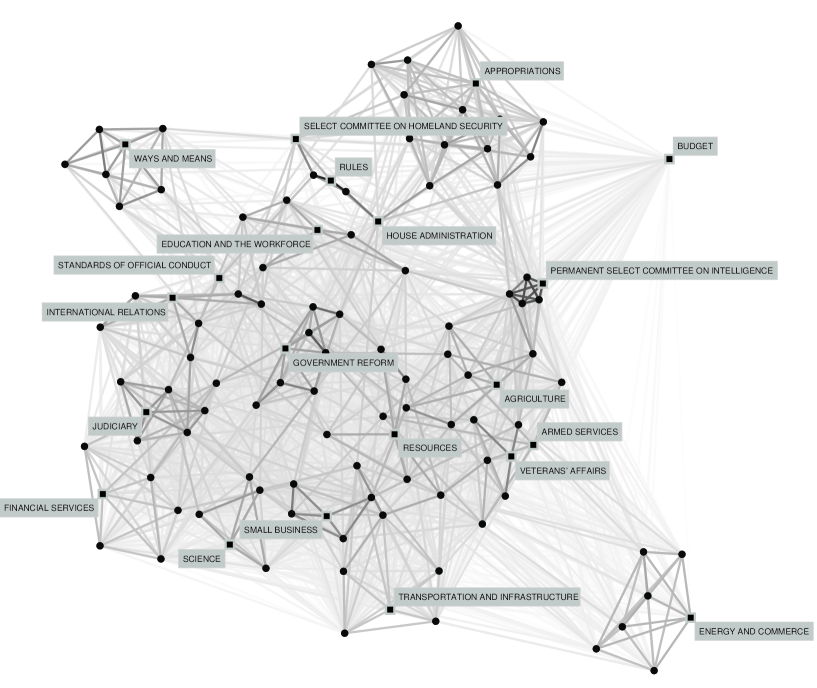
We project these two-mode committee assignment networks onto one-mode networks whose nodes represent the committees and whose edges represent common membership or “interlocks” between committees. Figure 1 shows a visualization of the network of committees for the 107th House of Representatives (2001–2002), an example which we analyze in some depth.
The more common members two committees have, the stronger their connection in the network. We quantify the strength of connection by the normalized interlock, defined as the number of common members divided by the expected number of such common members if committees of the same size were randomly and independently assigned from the members of the House. Committees with as many common members as would be expected by chance have normalized interlock 1, those with twice as many have interlock 2, those with none have interlock 0, and so forth.
Some of the connections depicted in Fig. 1 are expected and unsurprising. For instance, one finds that sets of subcommittees of the same larger committee share many of the same members, thereby forming a group or clique in the network. For example, the four subcommittees of the 107th Permanent Select Committee on Intelligence each include at least half of the full 20-member committee and at least one third of each of the other subcommittees. These tight connections result in normalized interlocks with values in the range 14.4–23.6, which are substantially higher than average and cause these five nodes to be drawn close together in the graph visualization, forming the small pentagon in the middle right of Fig. 1.
We also find more surprising connections between committees. For instance, the 9-member Select Committee on Homeland Security, formed in June 2002 during the 107th Congress in the aftermath of the terrorist attacks of September 11, 2001, is observed to have a strong connection to the 13-member Rules Committee (with a normalized interlock of 7.4 from two common members), which is the committee charged with deciding the rules and order of business under which legislation will be considered by other committees and the full House (see thomas.loc.gov). The Homeland Security Committee is also connected to the 7-member Legislative and Budget Process Subcommittee of Rules by the same two common members (with normalized interlock 13.7). In the 108th Congress (not depicted here), the Homeland Security Committee swelled to 50 members but maintained a close association with the Rules Committee (with normalized interlock of 4.1 from 6 common members).
Structure of the House
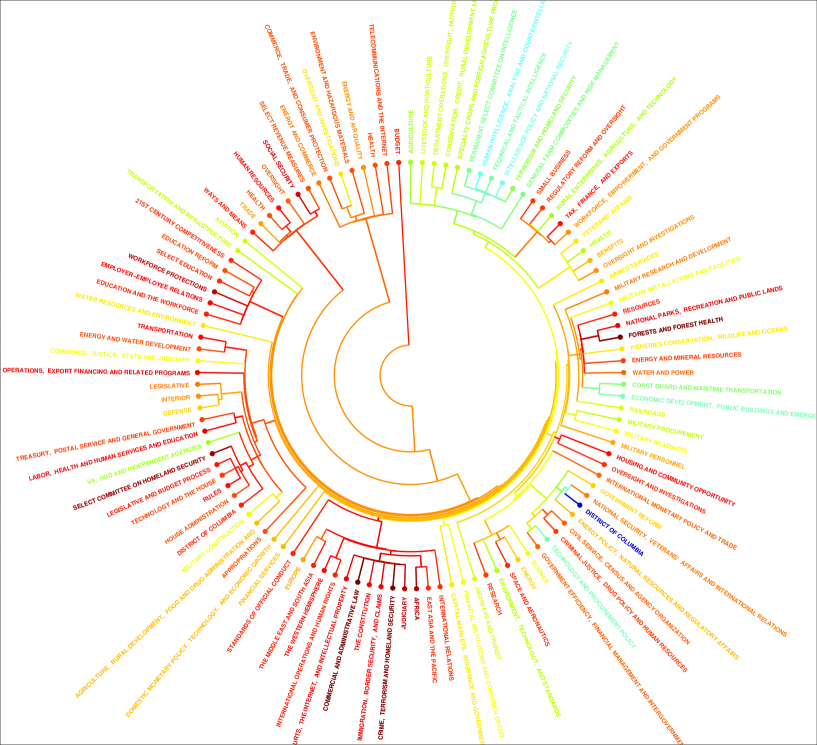
Connections between committees can be quantified in greater detail by applying the technique of single linkage clustering.[19] Starting with the complete set of committees for a given Congress, committees are joined together sequentially starting with the pair with the greatest normalized interlock, followed by the next greatest, and so forth. This process generates “clusters” of committees, which can be represented using a tree or dendrogram, such as that shown in Fig. 2 for the 107th House. There appear to be essentially four hierarchical levels of clusters within this dendrogram: subcommittees, committees, groups of committees, and finally the entire House.[20] (There is also some indication of a weaker fifth level of organization corresponding to groups of subcommittees inside larger standing committees.)
Here, we are primarily interested in the third hierarchical level—the connections between committees. For example, we see near the 8 o’clock position in Fig. 2 a tightly grouped cluster that includes the House Rules Committee and the Select Committee on Homeland Security. Because assignments to select committees are ordinarily determined by drawing selectively from legislative bodies with overlapping jurisdiction, one might naively expect a close connection between the Select Committee on Homeland Security and, for example, the Terrorism and Homeland Security Subcommittee of the Intelligence Select Committee, which was formed originally as a bipartisan “working group” and was designated on September 13, 2001 by House Speaker Dennis Hastert [R-IL] as the lead congressional entity assigned to investigate the 9/11 terrorist attacks (see www.homelandsecurity.org/journal/articles/kaniewskilegislative.htm). However, the 107th Homeland Security Committee shares only one common member (normalized interlock 2.4) with the Intelligence Select Committee (located near the 1 o’clock position in Fig. 2) and has no interlock with any of the four Intelligence subcommittees.
Voting patterns
A further twist can be introduced by considering how the network of interlocks between committees is related to the political positions of their constituent Representatives. One way to characterize political positions is to tabulate individuals’ voting records on key issues, but such a method is subjective by nature and a method that involves less personal judgment on the observer’s part is preferable. Here we use a singular value decomposition (SVD)[21] of voting records.[22, 23, 24] Other data mining methods can also be used (see http://www.ailab.si/aleks/Politics/).
We define an voting matrix with one row for each of the Representatives in the House and one column for each of the votes taken during the session. For instance, the 107th House had Representatives (including mid-term replacements) and took roll call votes. The element is if Representative voted “yea” on vote and if he or she voted “nay”. If a Representative did not vote because of absence or abstention, the corresponding element is .
The SVD identifies groups of Representatives who voted in a similar fashion on many votes. The grouping that has the largest mean-square overlap with the actual groups voting for or against each measure is given by the leading (normalized) eigenvector of the matrix , the next largest by the second eigenvector, and so on [24, 21]. If we denote by the corresponding eigenvalues (which are provably non-negative) and by the normalized eigenvectors of (which have the same eigenvalues), then it can be shown that
| (1) |
and that the matrix with elements
| (2) |
approximates the full voting matrix , with the sum of the squares of the errors on the elements equal to , which vanishes in the limit . Assuming the quantities , which are called the singular values, are ordered such that , this means that will be an excellent approximation to the original voting matrix if the singular values fall off sufficiently rapidly with increasing .
Alternatively, one can say that the th term in the singular value decomposition (1) accounts for a fraction of the sum of the squares of the elements of the voting matrix. For the 107th House, we find that the leading eigenvector accounts for about 45.3% of the voting matrix, the second eigenvector accounts for about 29.6%, and no other eigenvector accounts for more than 1.6%. Thus, to an excellent approximation, a Representative’s voting record can be characterized by just two coordinates, measuring the extent to which they align (or do not align) with the groups represented by the first two eigenvectors. That is,
| (3) |
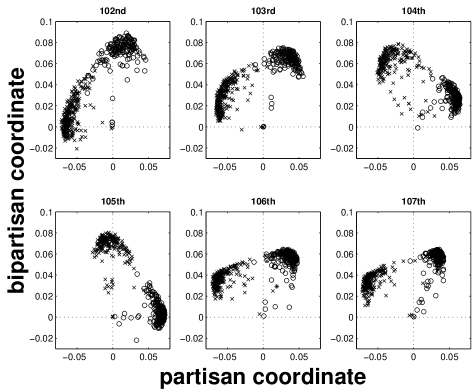
is a good approximation to . Similar results are obtained for other sessions of Congress, with two eigenvectors giving a good approximation to the voting matrix in every case. It has been shown previously using other methods that Congressional voting positions are well-approximated by just two coordinates (see voteview.com), but the SVD does so in a particularly simple fashion directly from the roll call data. In Fig. 3, we plot the two coordinates for every member of the House of Representatives for each of the 102nd–107th Congresses.
We find that the leading eigenvector††††††This holds for the 101st–105th Houses. The leading and second eigenvectors switch roles in the 106th and 107th Houses. corresponds closely to the acknowledged political party affiliation of the Representatives, with Democrats () on the left and Republicans () on the right in the plots. We therefore call this the “partisan coordinate” and Representatives who score highly on it—either positively or negatively—tend often to vote with members of their own party. From the partisan coordinate, we also compute a measure of “extremism” for each Representative as the absolute value of their partisan coordinate relative to the mean partisan score of the full House. That is, we define the extremism of a Representative by , where is the Representative’s partisan coordinate and is the mean of that coordinate for the entire House (which is usually skewed slightly towards the majority party). In Table 2, we list the most and least partisan Representatives from each party computed from the roll call of the 107th House. We also compare our rank orderings to those obtained using an alternative method, the Optimal Classification (OC) technique of Poole and Rosenthal[23] (also applied only to the 107th House).
In contrast, the second eigenvector groups essentially all Representatives together regardless of party affiliation and thus appears to represent voting actions in which most members of the House either approve or disapprove of a motion simultaneously. We call this the “bipartisan coordinate,” as Representatives who score highly on it tend often to vote with the majority of the House.
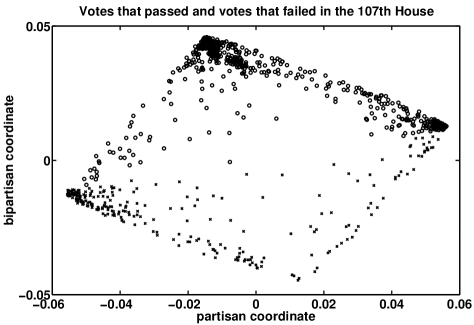
Using our SVD results, we can also calculate the positions of the votes (as opposed to the voters) along the same two leading dimensions to quantify the nature of the issues being decided. We show this for the 107th House in Fig. 4. One application of this analysis is a measurement of the reproducibility of individual votes and outcomes. By reconstituting the voting matrix using only the information contained in the two leading singular values and the corresponding eigenvectors and subsequently summing the resulting approximated votes over all Representatives, we derive a single score for each vote. Making a simple assignment of “pass” to those votes that have a positive score and “fail” to all others successfully reconstructs the outcome of of the total votes, or about 99.4%. (Overall, , or about 74.2%, of the votes passed, so simply guessing that every vote passed would be considerably less effective.) If we throw out known absences and abstentions, the analysis still identifies of the results correctly. Even with the most conservative measure of this computation’s success rate, in which we throw out abstentions and absences first and then examine individual Representatives’ yeas/nays (approximately 92.7% of which are correctly identified by the sign of the elements in the projection of the voting matrix), the two-dimensional reconstruction still identifies , or about 94.8%, of the votes correctly. We have repeated these calculations for the 101st–106th Houses and found similar results in each case. (The remarkable accuracy of SVDs in reconstructing votes was previously observed for the example of the U.S. Supreme Court [24].)
The SVD analysis gives a simple way of classifying Representatives’ voting positions without making subjective judgments. In Fig. 2, we have combined our clustering analyses of committees with the SVD results by color-coding each committee according to the mean “extremism” of its members, so that committees populated by highly partisan members of either party appear in red and committees containing more moderate Representatives appear in blue. Taking again the examples of Intelligence and Homeland Security, the figures immediately identify the former as moderate and the latter as more partisan. Indeed, the Select Committee on Homeland Security has a larger mean extremism than any of the 19 standing Committees and has the 4th largest mean extremism among the 113 committees of the 107th House. This is perhaps not so surprising when we see that its constituent Representatives included the House Majority Leader, Richard Armey [R-TX], and both the Majority and Minority Whips, Tom DeLay [R-TX] and Nancy Pelosi [D-CA]. However, this characterization of the committee was made mathematically, using no knowledge beyond the roll call votes of the 107th House. As another example, the 107th House Rules Committee is the 2nd most extreme of the 19 standing committees (after Judiciary) and ranks 18th out of 113 committees overall. By contrast, the Permanent Select Committee on Intelligence of the 107th House has a smaller mean extremism than any of the 19 standing Committees, and Intelligence and its four subcommittees all rank among the 10 least extreme of all 113 committees.
Conclusions
To conclude, a network theory approach coupled with an SVD analysis of roll call votes is demonstrably useful in analyzing organizational structure in the committees of the U.S. House of Representatives. We have found evidence of several levels of hierarchy within the network of committees and—without incorporating any knowledge of political events or positions—identified some close connections between committees, such as that between the House Rules Committee and the Select Committee on Homeland Security in the 107th Congress, as well as correlations between committee assignments and Representatives’ political positions. Our analysis of committee interlocks and voting patterns strongly suggests that committee assignments are not determined at random (i.e., that some committees are indeed “stacked”) and also indicates the degree of departure from randomness. We have discussed here a few observations in detail, but a rich variety of other results can be derived from similar analyses. We hope that further studies using similar techniques will provide key insights into the structure of the House of Representatives and other political bodies.
Acknowledgements
We gratefully acknowledge Thomas Callaghan, Michael Cohen, Gordon Kingsley, and Scott Page for useful conversations during this research. This work was supported in part by the National Science Foundation, including CMW’s contribution through an NSF VIGRE Research Experiences for Undergraduates program and MAP’s visiting faculty position at Georgia Tech. We also thank Michael Abraham for developing some of the computer code used in this research and Thomas Bartsch, Steven Lansel, Tom Maccarone, Slaven Peleš, Steve Van Hooser, and Julia Wang for critical readings of the manuscript. We also thank the two anonymous referees whose constructive comments improved this manuscript greatly. We obtained the roll calls for the 102nd–107th Congresses from the Voteview website (voteview.com) the roll calls for the 101st Congress from the Inter-University Consortium for Political and Social Research (see www.icpsr.umich.edu) and the committee assignments for the 101st–108th Congresses from the web site of the House of Representatives Office of the Clerk (see clerk.house.gov).
References
- [1] Boyce, John R. & Bischak, Diane P. (2002) The Journal of Law, Economics, & Organization 18(1), 1–38.
- [2] Niskanen, William A. (1971) Bureaucracy and Representative Government (Aldine-Atherton, Chicago, IL).
- [3] Gilligan, Thomas W. & Krehbiel, Keith (1987) Journal of Law, Economics, & Organization 3, 287–335.
- [4] Krehbiel, Keith (1990) American Political Science Review 84, 149–163.
- [5] Cox, Gary W. & McCubbins, Matthew D. (1993) Legislative Leviathan: Party Government in the House (University of California Press, Berkeley, CA).
- [6] Shepsle, Kenneth A. & Weingast, Barry R., eds. (1995) Positive Theories of Congressional Institutions: A comparison of rational choice models of Congress (University of Michigan Press, Ann Arbor, Michigan).
- [7] Strogatz, Steven H. 8 March (2001) Nature 410, 268–276.
- [8] Newman, M. E. J. (2003) SIAM Review 45(2), 167–256.
- [9] Mariolis, P. (1975) Social Science Quarterly 56, 425–439.
- [10] Useem, Michael (1984) The Inner Circle: Large corporations and the rise of business political activity in the US and UK (Oxford University Press, Oxford).
- [11] Mintz, B. & Schwartz, M. (1985) The Power Structure of American Business (University of Chicago Press, Chicago, Illinois).
- [12] Robins, Garry L. & Alexander, Malcolm (2004) Journal of Computational and Mathematical Organization Theory 10, 69–94.
- [13] Mizruchi, Mark S. (1996) Annual Review of Sociology 22, 271–298.
- [14] Haunschild, P. R. (1993) Administrative Science Quarterly 38, 564–592.
- [15] Rao, H., Davis, G. F., & Ward, A. (2000) Administrative Science Quarterly 45, 268–292.
- [16] Davis, Gerald F., Yoo, Mina, & Baker, Wayne E. (2003) Strategic Organization 1(3), 301–326.
- [17] Burt, Ronald S. (2005) Brokerage and Closure: An Introduction to Social Capital (Oxford University Press, Oxford).
- [18] Burt, Ronald S. (2004) American Journal of Sociology 110, 349–399.
- [19] Johnson, Stephen C. (1967) Psychometrica 32, 241–254.
- [20] Strahler, A. N. (1952) Bulletin of the Geological Society of America 63, 1117–1142.
- [21] Golub, Gene H. & Van Loan, Charles F. (1996) Matrix Computations (The Johns-Hopkins University Press, Baltimore, Maryland), Third edition.
- [22] Poole, Keith T. & Rosenthal, Howard (1997) Congress: A Political-Economic History of Roll Call Voting (Oxford University Press, Oxford, United Kingdom).
- [23] Poole, Keith T. & Rosenthal, Howard (2000) Political Analysis 8, 211–237.
- [24] Sirovich, Lawrence June 24 (2003) Proceedings of the National Academy of Sciences 100(13), 7432–7437.
- [25] Kamada, Tomihisa & Kawai, Satoru (1989) Information Processing Letters 31, 7–15.
Congress Speaker Majority Leader Minority Leader Majority Whip Minority Whip 101st (89–90) T. S. Foley R. A. Gephardt R. H. Michel T. Coelho, W. H. Gray III D. Cheney, N. L. Gingrich 102nd (91–92) T. S. Foley R. A. Gephardt R. H. Michel W. H. Gray III, D. E. Bonior N. L. Gingrich 103rd (93–94) T. S. Foley R. A. Gephardt R. H. Michel D. E. Bonior N. L. Gingrich 104th (95–96) N. L. Gingrich R. K. Armey R. A. Gephardt T. D. DeLay D. E. Bonior 105th (97–98) N. L. Gingrich R. K. Armey R. A. Gephardt T. D. DeLay D. E. Bonior 106th (99–00) J. D. Hastert R. K. Armey R. A. Gephardt T. D. DeLay D. E. Bonior 107th (01–02) J. D. Hastert R. K. Armey R. A. Gephardt T. D. DeLay N. Pelosi 108th (03–04) J. D. Hastert T. D. DeLay N. Pelosi R. Blunt S. Hoyer
Least Partisan Farthest Left Farthest Right K. Lucas [R] J. D. Schakowsky [D] T. G. Tancredo [R] C. A. Morella [R] J. P. McGovern [D] J. B. Shadegg [R] R. M. Hall [D] H. L. Solis [D] J. Ryun [R] R. Shows [D] L. C. Woolsey [D] B. Schaffer [R] G. Taylor [R] J. F. Tierney [D] P. Sessions [R] C. W. Stenholm [D] S. Farr [D] S. Johnson [R] R. E. Cramer [D] N. Pelosi [D] B. D. Kerns [R] V. H. Goode [R] E. J. Markey [D] P. M. Crane [R] C. John [D] J. W. Olver [D] W. T. Akin [R] C. C. Peterson [D] L. Roybal-Allard [D] J. D. Hayworth [R]