Mode Selection in the Spontaneous Motion of an Alcohol Droplet
Abstract
An alcohol (pentanol) droplet exhibits spontaneous agitation on an aqueous solution, driven by a solutal Marangoni effect. We found that the droplet’s mode of motion is controlled by its volume. A droplet with a volume of less than shows irregular translational motion, whereas intermediate-sized droplets of show vectorial motion. When the volume is above , the droplet splits into smaller drops. These experimental results regarding mode selection are interpreted in terms of the wave number selection depending on the droplet volume.
pacs:
47.20.Dr,87.19.St,47.20.Ma,68.05.-nIt is well known that an oil-water system exhibits spontaneous agitation, called the Marangoni effect Scriven and Sternling (1960), which is driven either by a thermal gradient Schwabe et al. (1992) or a chemical concentration gradient Kovalchuk et al. (1999); Kovalchuk and Vollhardt (2000, 2004). We focus here on the latter system, i.e., a solutal Marangoni effect under isothermal conditions. A rich variety of spontaneous agitation on oil-water interface has been reported both experimentally Yoshikawa and Magome (1993); Sumino et al. (2005); Nakata et al. (1997); Kitahata and Yoshikawa (in press); Bain et al. (1994); Santos et al. (1995); Kitahata et al. (2002); Bekki et al. (1990, 1992) and theoretically de Genne (1998); Thiele et al. (2004). It has been shown that the nature of the self-agitation is sensitively dependent on the shape and size of the container, i.e., on the boundary condition Yoshikawa and Magome (1993); Sumino et al. (2005); Nakata et al. (1997). In the present study, we show that an alcohol droplet driven by a solutal Marangoni effect selects a certain mode of motion critically depending on its size. This mode selection is interpreted in terms of competition between the droplet size and the critical wave number in the instability by the Marangoni effect.
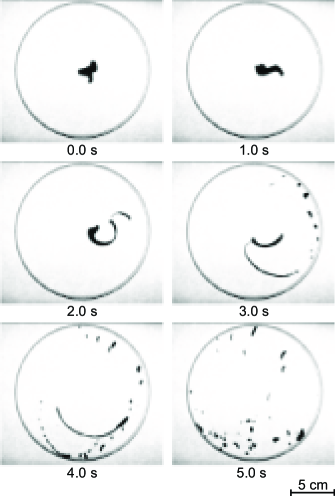
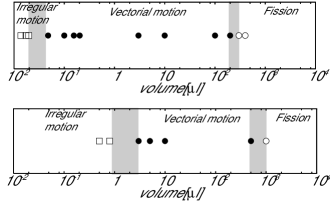
Different modes of spontaneous motion of alcohol droplets are exemplified in Figs. 1 and 2, where the droplets stained with ink (Pilot Corporation, Tokyo; INKSP-55-B) are agitating on of aqueous phase containing pentanol in a petri dish with a diameter of . The motion of the droplet was monitored with a high-speed video camera (RedLake MASD Inc., San Diego; Motion Scope PCI) at 60 frames per second at room temperature, and then analyzed by image-processing software. When the volume is less than , the droplet maintains a circular shape during irregular translational motion, as shown in Fig. 1(b). When the volume is between 0.1 and , the droplet shows an asymmetric morphology and exhibits directional motion by maintaining its shape, as in Fig. 1(c), where the speed is almost constant. The average speed in vectorial motion is greater than that in the irregular translational motion of the smaller droplet. When the volume is above , the droplet splits into smaller droplets as in Fig. 2. Figure 3 shows a phase diagram of the modes of droplet motion with a change in the volume.
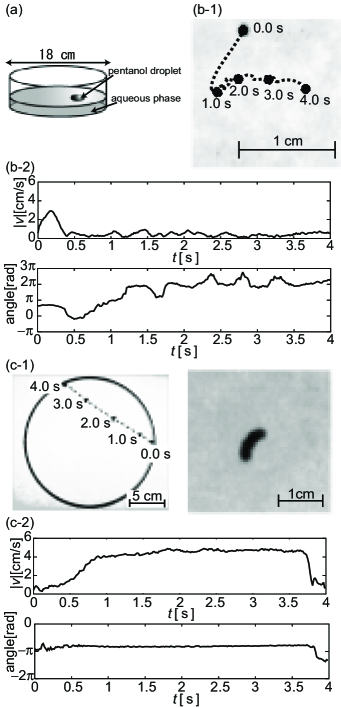
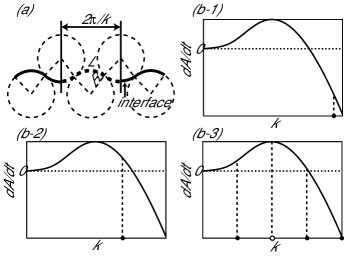
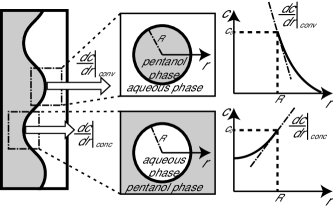
The experimental trend in volume-dependent mode-selection can be interpreted by considering the wave-length due to the Marangoni instability and the length scale of the droplet. When a droplet is large enough to accept the characteristic length of Marangoni instability, it exhibits morphological deformation. Once the droplet is deformed, the variation in curvature around its periphery causes asymmetry in the surface tension, which drives the directional motion of the droplet. In the experiment in Fig. 1(c), the concentration gradient of pentanol in the convex region of the droplet is higher than that in the concave region of the droplet due to diffusion depending on the shape of the boundary. Therefore, the interfacial tension gradient in the convex region is higher than that in the concave region and the droplet is forced to move toward the direction from the concave region to the convex region Nakata et al. (1997). This spontaneous motion has the effect of maintaining the shape anisotropy. In contrast, in the case of a smaller droplet, the circular shape is maintained under Marangoni instability, and the emergence of a large acceleration force is inhibited. As a result, the average speed of such a circular droplet is less than that of a larger droplet and the spontaneous agitation is rather irregular. The interface is significantly destabilized only when the wave number of the self-agitation due to the Marangoni effect is less than the inverse of a certain wave number, . This mode selection is shown schematically in Fig. 4(b).
Next, we calculate the wave number when the interface is destabilized by a solutal Marangoni effect by considering a small perturbation (, ). When a wave is induced along the interface, generally the wave tends to be damped due to interfacial tension, the strength of which per unit length is . On the other hand, the concentration gradient in the convex region of the wave is higher than that in the concave region due to diffusion depending on the shape of the boundary. Therefore, the interfacial tension gradient in the convex region is higher than that in the concave region and the difference in the interfacial tension gradient induces wave growth. The force strength per unit length is . When , the wave becomes unstable. To simplify the treatment, we adopt the approximation that the shape of the wave consists of parts of a circle, as in Fig. 4(a).
In this case, the radius of the circle, , and the length of the interface per wave length, , are derived as
| (1) |
| (2) |
Supposing that is proportional to ,
| (3) |
where is a constant.
is proportional to the difference between the interfacial tension gradients in the convex and concave regions. Assuming that the interfacial tension gradients are proportional to the concentration gradients of pentanol,
| (4) |
where is the concentration gradient perpendicular to the interface in the convex region, is that in the concave region, and is a constant. The dynamics of the concentration of pentanol on the surface of the aqueous phase, , are given by
| (5) |
where is the diffusion coefficient of pentanol on the surface, is the evaporation rate of pentanol, is the dissolution rate of pentanol, is the concentration at the gas-liquid equilibrium and is the concentration at the surface-bulk equilibrium in the aqueous phase. We impose the Dirichlet condition at the pentanol-water interface, i.e., at the interface, where is the concentration of the water-rich part under the coexistence condition. The stationary solutions with rotational symmetry of Eq. 5 (Fig. 5) are adopted in order to evaluate . Thus, at the convex region,
| (6) |
and at the concave region,
| (7) |
where , and , , , are modified Bessel functions. Therefore,
| (8) | |||||
Here, we assume . When ,
| (9) |
and when ,
| (10) | |||||
This means when , and when . Since at ,
| (11) |
From the above discussion, it is clear that the perturbation increases when . This means that for larger , is smaller, i.e., the critical volume at the mode transition increases.
To verify this analysis, we performed experiments where was changed by covering the dish and increasing the pentanol concentration in the aqueous phase. When the dish was covered and increased, the motion of a droplet with a volume of changed from vectorial motion to irregular translational motion (data not shown). When the concentration of the aqueous phase was and increased, the critical volume at which the mode change is induced increases as shown in Fig. 3. These results correspond well to our theoretical expectation.
In the present study, we found that mode selection in the spontaneous motion of an alcohol droplet is induced by a change in the droplet volume. This mode selection is achieved as the result of the competition in the length scale between the droplet size and the wavelength of the instability due to the Marangoni effect. The characteristic wavelength is a function of rates of evaporation and dissolution. The present results may shed light on how biological motors realize chemo-mechanical energy transduction under isothermal conditions with high efficiency Shrödinger (1944); Mehta et al. (1999); Yasuda et al. (2001).
We would like to thank Mr. M. I. Kohira (Chuo University, Japan) and Prof. M. Nagayama (Kanazawa University, Japan) for their helpful discussion and advice. This work was supported in part by a Grant-in-Aid for the 21st Century COE (Center for Diversity and Universality in Physics) from the Ministry of Education, Culture, Sports, Science and Technology of Japan.
References
- Scriven and Sternling (1960) L. E. Scriven and C. V. Sternling, Nature 187, 186 (1960).
- Schwabe et al. (1992) D. Schwabe, U. Möller, J. Schneider, and A. Scharmann, Phys. Fluids A 4, 2368 (1992).
- Kovalchuk et al. (1999) V. I. Kovalchuk, H. Kamusewitz, D. Vollhardt, and N. M. Kovalchuk, Phys. Rev. E 60, 2029 (1999).
- Kovalchuk and Vollhardt (2000) N. M. Kovalchuk and D. Vollhardt, J. Phys. Chem. B 104, 7987 (2000).
- Kovalchuk and Vollhardt (2004) N. M. Kovalchuk and D. Vollhardt, Phys. Rev. E 69, 016307 (2004).
- Yoshikawa and Magome (1993) K. Yoshikawa and N. Magome, Bull. Chem. Soc. Jpn. 66, 3352 (1993).
- Sumino et al. (2005) Y. Sumino, N. Magome, T. Hamada, and K. Yoshikawa, Phys. Rev. Lett. 94, 068301 (2005).
- Nakata et al. (1997) S. Nakata, Y. Iguchi, S. Ose, M. Kuboyama, T. Ishii, and K. Yoshikawa, Langmuir 13, 4454 (1997).
- Kitahata and Yoshikawa (in press) H. Kitahata and K. Yoshikawa, Physica D (in press).
- Bain et al. (1994) C. D. Bain, G. D. Burnett-Hall, and R. R. Montgomerie, Nature 372, 414 (1994).
- Santos et al. (1995) F. D. D. Santos, and T. Ondarçuhu, Phys. Rev. Lett. 75, 2972 (1995).
- Kitahata et al. (2002) H. Kitahata, R. Aihara, N. Magome, and K. Yoshikawa, J. Chem. Phys. 116, 5666 (2002).
- Bekki et al. (1990) S. Bekki, M. Vignes-Adler, E. Nakache, and P. M. Adler, J. Colloid Interface Sci. 140, 492 (1990).
- Bekki et al. (1992) S. Bekki, M. Vignes-Adler, and E. Nakache, J. Colloid Interface Sci. 152, 314 (1992).
- de Genne (1998) P. G. de Genne, Physica A 249, 196 (1998).
- Thiele et al. (2004) U. Thiele, K. John, and M. Bär, Phys. Rev. Lett. 93, 027802 (2004).
- Shrödinger (1944) E. Shrödinger, What is Life? (Cambridge University Press, Cambridge, 1944).
- Mehta et al. (1999) A. D. Mehta, R. S. Rock, M. Rief, J. A. Spudich, M. S. Mooseker, and R. E. Cheney, Nature 400, 590 (1999).
- Yasuda et al. (2001) R. Yasuda, H. Noji, M. Yoshida, K. Kinoshita Jr., and H. Itoh, Nature 410, 898 (2001).