NONPERIODIC OSCILLATIONS OF PRESSURE
IN
A SPARK IGNITION COMBUSTION ENGINE
M. WENDEKER, G. LITAK, J. CZARNIGOWSKI AND K. SZABELSKI
Department of Mechanics, Technical University of Lublin, Nabystrzycka 36, 20-618 Lublin, Poland
Abstract
We report our results on non-periodic experimental time series of pressure in a spark ignition engine. The experiments were performed for a low rotational velocity of a crankshaft and a relatively large spark advance angle. We show that the combustion process has many chaotic features. Surprisingly, the reconstructed attractor has a characteristic butterfly shape similar to a chaotic attractor of Lorentz type. The suitable recurrence plot shows that the dynamics of the combustion is a nonlinear multidimensional process mediated by stochastic noise.
Keywords: Spark ignition engine, combustion, variability, inttermitency
1 Introduction
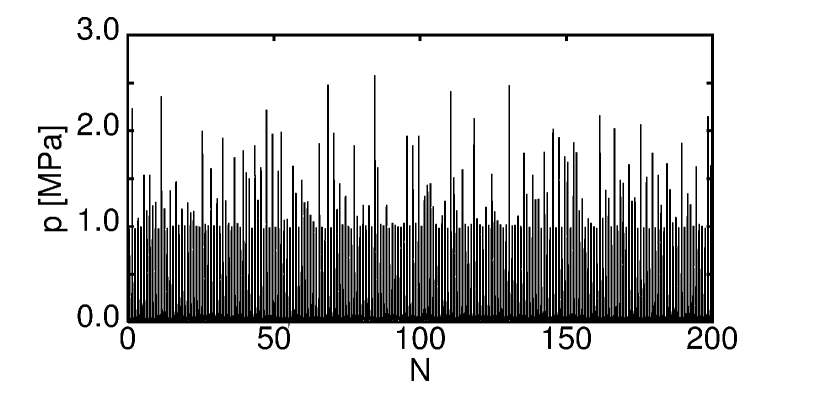
The cycle-to-cycle combustion variability has been a subject of interest for many years [Heywood 1988, Hu 1996]. Noise in pressure time dependence is a factor which makes an engine control difficult [Wendeker & Czarnigowski 2000]. To make the progress some papers concentrated on stochastic models formulation [Roberts et al. 1997, Wendeker et al. 1999]. However, as identified by Heywood [1988], the sources of fluctuations involve various process conditions such as: aerodynamics in the cylinder during combustion, the amount of fuel, air and recycled exhaust gases supplied to the cylinder and a mixture composition near the spark plug. It is possible that many different disturbances influence the process making it stochastic but one should note that high sensitivity on the process conditions is characteristic for nonlinear phenomena and deterministic chaos. In that case the pressure variations might originate from a complex dynamics leading, presumably with some stochastic component, to nonperiodic behaviour [Daw et al. 1996 and 1998, Wendeker 2002]. Thus, the crusial problem is to understand the nonlinear dynamics of the process observing the internal pressure inside the cylinder [Antoni et al. 2002]. In the present note we discuss experimental results of a direct measurement of pressure [Czarnigowski 2002]. Namely, we start our analysis with study of the measured time series of pressure. The crankshaft frequency was stabilized by a electromechanical brake to the value =10Hz (=600 RPM). Note, in a combustion process one of each two cycles of a crankshaft rotation are coincided with combustion leading to pressure parametrically driven oscillation with a period s. In Fig. 1 we show a typical time history of combustion internal pressure for (). We took such process conditions (a low rotational velocity and a large advance angle ) purposely to make nonperiodicity of time history more transparent [Wendeker et al. 2002]. Our task in the next sections will be to examine it by using tools for nonlinear analysis.
2 Nonlinear Analysis
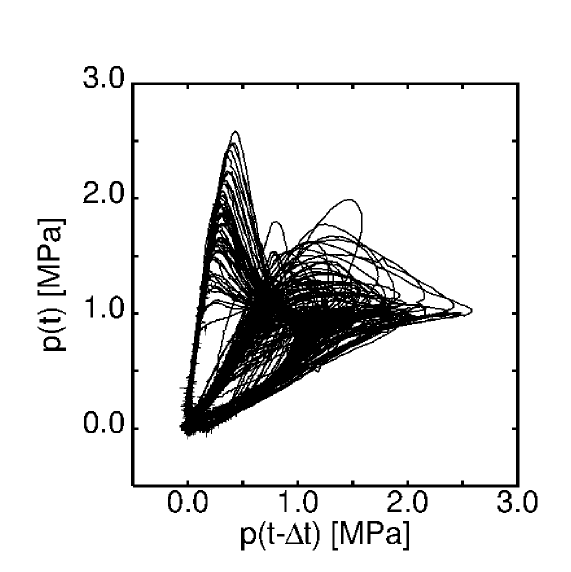
Our first step is reconstruction of the dynamic attractor. Having time series limited only to 200 cycles it is not possible to perform full analysis of embedding and correlation dimension of the dynamical process [Kantz & Scheiber 1997, Abarbanel 1996] so we decided to do a simplified study. In Fig. 2 we show a two dimensional attractor obtained using a time delay procedure introduced by Takens [Takens 1981]. Thus, we introduce a new vector p:
| (1) |
but here we will use only the minimal set of variables: p(t) and p(t-(t). The time delay is slightly smaller than the driving period . Surprisingly, the reconstructed attractor (Fig. 2) has a characteristic butterfly shape similar to a chaotic attractor of a Lorentz system [Lorentz 1963]. Realy, it shows some deterministic characteristics. For instance, it consists of two well defined closed lops. The motion along first and second loops with possible random switch between them creates a new question how much of determinism is included in prsesure dynamics. In aim to solve this problem we decided to examine recurrence plots. This method, originally introduced by Eckmann et al. [1987], is capable to distinguish deterministic system from stochastic one. It has been already applied successfully to various nonlinear systems [Casdagli 1997, Kantz & Scheiber 1997]. In order to make a recurrence plot for trajectory on reconstructed phase space (Fig. 2) we calculate the distance between each pair of measured , where is a sampling time. Following Eckmann et al. [1987] we define a new matrix R with elements:
| (2) |
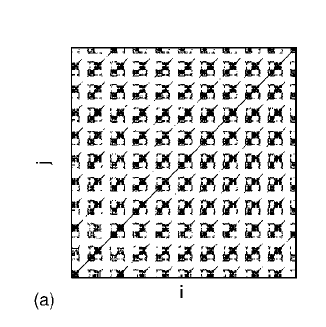
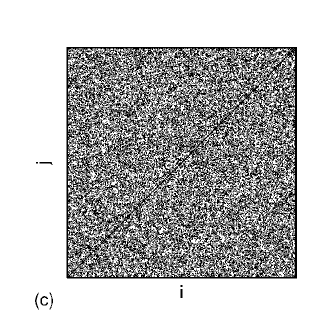
where denotes the Heaviside step function and is a small positive number. Its value () is usually assumed to be a few percents of the maximal distance between and . R is a square matrix, which has the size , where is a number of measured points in the collected experimental data. After defining we plot black point in plane if only . In this way black regions can indicate close returns of trajectories or some flat regions is time dependence when a recurrence plot correspond to shorter intervals. The suitable plots for studied time history were plotted in Fig. 3a and b.
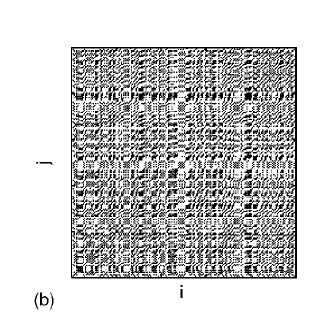
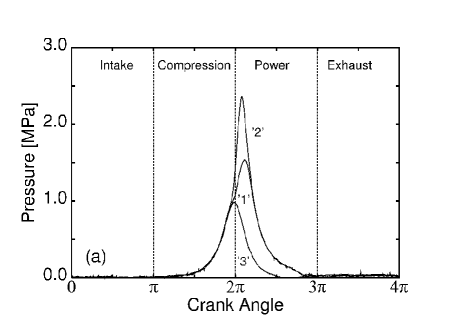
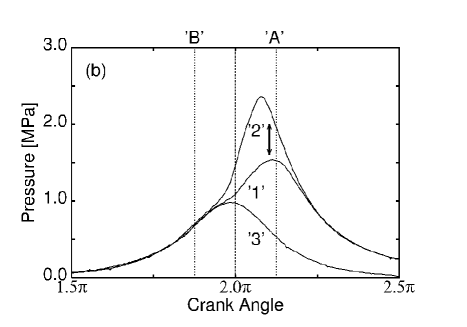
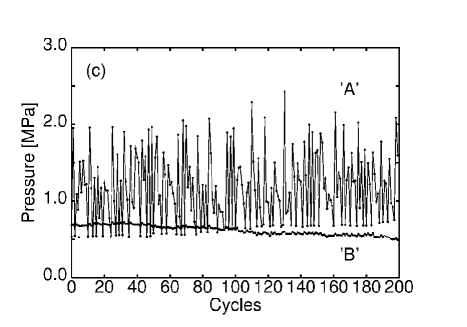
On the other hand, Fig. 3c shows the recurrence plot for series of numbers obtained from a random numbers generator with a uniform distribution. To be more specific, in Fig. 3a, we show a recurrence plot for 10 sequential cycles of the engine work. The regular patterns identify deterministic flow in this scale. Note however, that the unstable region of a pressure fluctuation corresponding to white regions is connected only with some specific time interval of combustion. It is clearly depicted in Fig. 4a where we plotted following stroke phases of each combustion cycle: intake of gases, compression, power creation and finally exhaust of gases and combustion products. The recurrence plot in Fig. 3b was plotted for a larger scale of 200 cycles. In this case we used only chosen experimental data pints for a given crank angle . In this new scale the plot is not so much regular as Fig. 3a but still differs from the case of random numbers (Fig. 3c). First of all it possesses patterns of vertical and horizontal black stripes. Such structure can be identified as belonging to chaotic behaviour. Note, that size of matrix (Eq. 2) was limited, by the available short time series, to only . Obviously, in larger time scale we expect black stripes to be represented by corresponding vertical and horizontal lines. Another problem is connected with stochastic noise which may disturb the time correlations in that picture. In Fig. 4a we show also three time histories selected from the studied experimental time series of pressure (Fig. 1). One can easily note that curves ’1’ and ’2’ correspond to combustion with different, rather high, efficiency while the curve ’3’ is a case where the combustion is very small or even not present at all. This effect around a top point of compression (top dead center) for a crank angle is even better visible. In this purpose we magnified that region in Fig. 4b. Clearly, one can see the difference of pressure between (note ’A’ and ’B’ dashed lines in Fig. 4b). For better clarity, we have also plotted (Fig. 4c) the time series of points connected with these two different phases (’A’ and ’B’) of the engine work. Only in case of combustion (curve ’A’ in Fig. 4c) we see the fluctuation of pressure. Really, this justify of our choice of combustion sensitive dada to a recurrence plot in Fig. 3b. The lack of clear white regions in Fig. 3b can be the result of higher (than 2) embeding dimension of the dynamical system and the output signal modulation visible in Fig. 4c.
3 Intermittency as a Route to Chaos in a Combustion Process
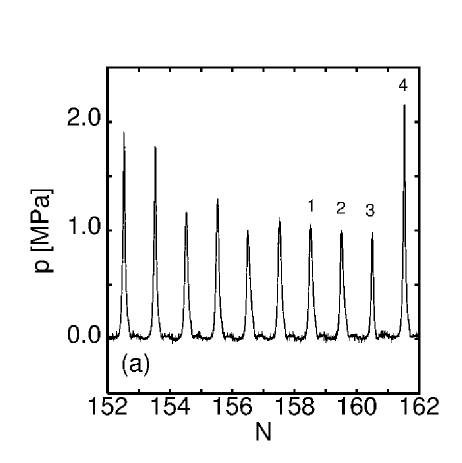
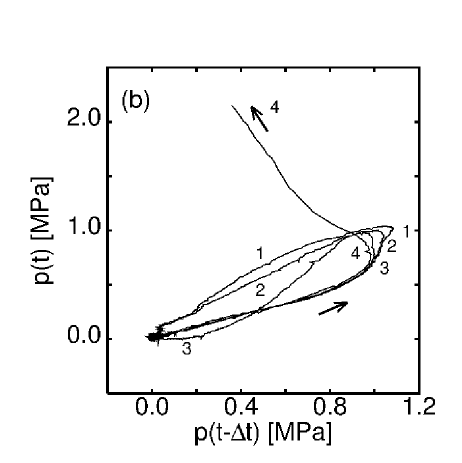
Both, the curve ’A’ in Fig. 4c and the previously presented dynamical attractor (Fig. 2) show some features typical for systems showing intermittent chaos [Pomeau & Manneville 1980, Chatterjee & Malik 1996]. To clarify this point we plotted once again a time history of a studied case for a shorter time interval (few cycles) in Fig. 5a. Note that after a sequence of a steady flow (with very weak combustion) in cycles marked as 1, 2, 3 we have sudden jump of pressure in the next cycle (marked by 4 in Fig. 5a). In Fig. 5b we have resolved this behaviour plotting trajectory of system for these 4 cycles. Interestingly the sudden jump of pressure can be associated with escape from the present trajectory. Such jump is a characteristic phenomenon for an intermittency mechanism of a chaotic motion. Note, the above behaviour is typical for that system as trajectory presented in Fig. 5a. is a part of that plotted in Fig. 2. Our system is already in a chaotic state so we can find only some short intervals which behave in this way. Interestingly, these jumps of high efficient combustion follows the sequence of cycles with weak combustion (Fig. 5a, Fig. 4c). Physically, this means that it happens if the amount of residual exhaust gases from preceding combustion cycles are absent in the cylinder and, simultaneously, the present mixture of fuel and air amounts is rich. Such explanation is consistent with the simple nonlinear model derived by Daw et al. [1996 and 1998]. According to their finding the residual gases alter the in-cylinder fuel-air ratio and finally the combustion efficiency in succeeding cycles.
4 Conclusions and Last Remarks
Summering our results we would like to add that we examined the oscillations of internal combustion pressure in an engine cylinder. It has appeared that, in some conditions, intermittency is capable to drive the system into a chaotic region. The strange attractor presented in Fig. 2 (and Fig. 5b) has many features typical for systems showing intermittent chaos. Moreover the recurrence plots indicate that the system is not likely to be stochastic, but we cannot exclude some influence of random disturbances. Our results throw some new light on the problem of noise present in combustion engines and can also give a new concept to fight with it. However to be more sure about the physical situation one should perform studies of longer time series. This can enable us to use other more sophisticated techniques of nonlinear dynamics analysis [Kantz & Scheiber 1997, Abarbanel 1996]. Such work is in progress and results will be reported in a separate publication
References
Abarbanel, H.D.I. [1996] Analysis of Observed Chaotic Data (Springer-Verlag, New York).
Antoni, I., Daniere, J., Guillet, F. [2002] ”Effective vibration analysis of ic engines using cyclostationaryrity. part II - new results on the reconstruction of the cylinder pressures”, J. Sound Vibr. 257, 839-856.
Casdagli, M.C. [1997] ”Recurrence plots revisited”, Physica D 108, 12-44.
Chatterjee, S., Malik, A.K. [1996] ”Three Kinds of Intermittency in a Nonlinear System”, Phys. Rev. E 53, 4362-4367.
Czarnigowski J. [2002] unpublished, PhD Thesis, Technical University of Lublin.
Daw, C.S., Finney, C.E.A., Green Jr., J.B., Kennel, M.B., Thomas, J.F. and Connolly, F.T. [1996] ”A simple model for cyclic variations in a spark-ignition engine”, SAE Paper 962086.
Daw, C.S., Kennel, M.B., Finney, C.E.A., Connolly, F.T. [1998] ”Observing and modeling nonlinear dynamics in an internal combustion engine”, Phys. Rev. E 57, 2811-2819.
Eckmann, J.-P., Kamphorst, S.O. and Ruelle, D. [1987] ”Recurrence Plots of Dynamical Systems”, Europhysics Letters 5, 973-977.
Heywood, J.B. [1988] Internal Combustion Engine Fundamentals (McGraw-Hill, New York).
Hu, Z. [1996] ”Nonliner instabilities of combustion processes and cycle-to-cycle variations in spark-ignition engines”, SAE Paper 961197.
Kantz, H., Scheiber, T. [1997] Nonlinear Time Series Analysis (Cambridge University Press, Cambridge).
Lorentz, E.N. [1963] ”Deterministic nonperiodic flow”, J. Atmos. Sci. 20, 130.
Pomeau, Y., Manneville, P. [1980] ”Intermittent transition to turbulence in dissipative systems” Commun. Math. Phys. 74, 189.
Roberts, J.B., Peyton-Jones, J.C., Landsborough, K.J. [1997] ”Cylinder Pressure Variations as a Stochastic Process”, SAE Paper 970059.
Takens, F. [1981] Lecture Notes in Mathematics 898 (Springer, Heidelberg).
Wendeker, M., Niewczas, A., Hawryluk, B. [1999] ”A stochastic model of the fuel injection of the si engine”, SAE Paper 00P-172.
Wendeker, M., Czarnigowski, J. [2000] ”Hybrid air/fuel control using the adaptive estimation and neural network”, SAE Paper 2000-01-1248.
Wendeker, M., Czarnigowski, J., Litak, G., Szabelski, K. [2002] ”Chaotic combustion in spark ignition engines”, preprint nlin.CD/0212050.
Figure Captions
-
1.
Figure 1. Experimental time series of pressure in a combustion process for a crankshaft frequency RPM and a spark advance angle . Note, time is represented by sequential cycles .
-
2.
Figure 2. A ’butterfly’ attractor reconstructed from the experimental time series of pressure. .
-
3.
Figure 3. Recurrence plots of the examined combustion process: in a small scale of 10 cycles (Fig. 3a), and the scale of 200 cycles for selected points chosen for the same crank angle (Fig. 3b). Fig. 3c shows the recurrence plot for the series of numbers from random numbers generator with a uniform distribution.
-
4.
Figure 4. Time history of combustion presented in Fig. 1 plotted for three chosen cycles (Fig. 4a) and magnification of it (Fig. 4b) around the top dead point (for a crank angle ). Fig. 4c shows a sequence of pressure values for given crank angle (for B and A as before and after ignition, respectively).
-
5.
Figure 5. Interval of the time history of pressure versus time, in terms of cycles N, (Fig. 5a) selected from the examined time series (Fig. 1). The trajectory of succeeding cycles 1,2,3,4 marked in Fig. 5a is presented in Fig. 5b.