MEASUREMENT AND PHENOMENOLOGY OF THE PROTON STRUCTURE FUNCTION FROM ZEUS AT HERA
Measurements of the proton structure function in the range from ZEUS 1995 shifted vertex data and from 1996 and 1997 ZEUS data are presented. From the former and other ZEUS data the slopes at fixed and at fixed are derived. data at below are described successfully by a combination of generalised vector meson dominance and Regge theory. Using a NLO QCD fit the gluon density in the proton is extracted in the range from ZEUS 1994 and 1995 data. For it is found that the sea distribution is still rising at small whereas the gluon distribution id strongly suppressed. It is shown that these observations may be understood from the behaviour of the and data themselves.
1 Introduction
Measurements of the low and medium aaathe negative of the square of the four-momentum transfer between the positron and the proton neutral current (NC) deep inelastic scattering (DIS) cross sections at HERA have revealed the rapid rise of the proton structure function as Bjorken- decreases below . At low down to ZEUS data allows study of the ‘transition region’ as in which perturbative QCD (pQCD) must break down. At high , NC DIS measurements are sensitive to details of the QCD evolution of parton densities, electroweak couplings and the propagator mass of the gauge boson. Furthermore, such measurements allow the searches for physics beyond the Standard Model, such as resonance searches or contact interactions.
2 Phenomenology of at low and low
2.1 Phenomenology of the low region
The primary purpose is to use NLO DGLAP QCD on the one hand and the simplest non-perturbative models on the other to explore the transition region and through probing their limitations to shed light on how the pQCD description of breaks down. One way to understand the rise in at low is advocated by Glück, Reya and Vogt (GRV94) who argue that the starting scale for the evolution of the parton densities should be very low and at the starting scale the parton density functions should be non-singular. The observed rise in , with a parameterisation valid above , is then generated dynamically. On the other hand, at low one might expect that the standard NLO evolution given by the DGLAP equations breaks down because of the large terms that are not included. Such terms are taken into account by the BFKL formalism, which in leading order predicts a rising at low . The rise comes from a singular gluon density, , with in the range to -0.5. Clearly accurate experimental results on at low and the implied value of are of great interest.
At some low value of pQCD will break down and non-perturbative models must be used to describe the data. At low and large centre-of-mass energy, , the total cross-section is given by
| (1) |
where and are the cross-sections for transversely and longitudinally polarised virtual photons respectively. Two non-perturbative approaches are considered, the generalised vector meson dominance model (GVMD) and a Regge-type two component Pomeron+Reggeon approach a la Donnachie and Landshoff (DL) to give a good description of hadron-hadron and photoproduction total cross-section data.
2.2 Measurement of with Shifted Vertex Data
The shifted vertex data correspond to an integrated luminosity of taken in a special running period, in which the nominal interaction point was offset in the proton beam direction by , away from the detecting calorimeter. Compared to the earlier shifted vertex analysis, for the 1995 data taking period the calorimeter modules above and below the beam were moved closer to the beam, thus extending the shifted vertex range down to .
The double differential cross-section for single virtual-boson exchange in DIS is given by
| (2) | |||||
| (3) |
where R is related to the longitudinal structure function by and gives the radiative corrections to the Born cross-section, which in this kinematic region is at most . The parity violating term arising from the exchange is negligible in the range of this analysis. Further details about the data analysis can be found in ref. .
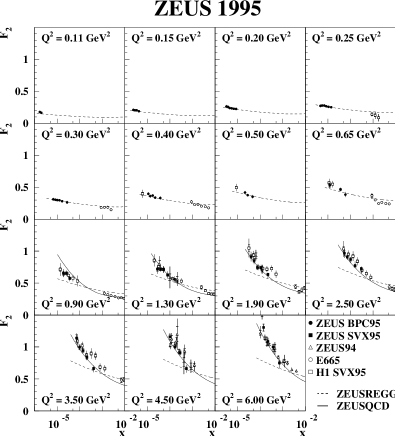
Fig. 1 shows the results for as a function of in bins of between 0.65 and (ZEUS SVX95) together with ZEUS measurements at very low (ZEUS BPC95) and at larger those from the ZEUS94. There is good agreement between the different ZEUS data sets in the region of overlap. Also shown are data from the shifted vertex measurements by H1 (H1 SVX95) and fixed target data from E665. The steep increase of at low observed in the higher bins softens at the lower values of this analysis. The curves shown will be discussed later in the text.
2.3 The low region
We first give an overview of the low region, , taking ZEUS SVX95, BPC95 and ZEUS94 data. Using Eq. 1 we calculate values from the data. The DL model predicts that the cross-section rises slowly with energy , and this behaviour seems to be followed by the data at very low . Above , the DL model predicts a shallower rise of the cross-section than the data exhibit. For values of around and above, the GRV94 curves describe the qualitative behaviour of the data, namely the increasing rise of with , as increases. This suggests that the perturbative QCD calculations can account for a significant fraction of the cross-section at the larger values.
For the remainder of this section we concentrate on non-perturbative descriptions of the ZEUS BPC95 data. Since BPC95 data are binned in and we first rewrite the double differential cross-section of Eq. 3 as where and has been defined by Eq. 1. The virtual photon has flux factor and polarisation . Keeping only the continuum states in the GVMD at a fixed the longitudinal and transverse cross-section are related to the corresponding photoproduction cross-section by
| (4) |
where the parameter is the ratio for vector meson (V) proton scattering and is the effective vector meson mass. Neither nor are given by the model and they are either determined from a fit to data or by other approaches. As we do not have much sensitivity to and it is small (0.2 - 0.4) we set it here to zero. We thus have 9 parameters to be determined by fitting the BPC data to the simplified GVMD expression in 8 bins of between 104 and 251 GeV. The fit is reasonable and its quality might also be judged from the upper plot in Fig. 2. The value obtained for is . The resulting extrapolated values of are shown as a function of in the lower plot of Fig. 2, along with measurements from HERA and lower energy experiments. The extrapolated BPC data lie somewhat above the direct measurements from HERA. They are also above the cross section prediction of the DL model. It should be clearly understood that the data derived from the BPC95 data are not a measurement of the total photoproduction cross-section but the result of a physically motivated ansatz.

The simple GVMD approach just described gives a concise account of the dependence of the BPC data but it says nothing about the energy dependence of . To explore this aspect of the data we turn to a two component Regge model
where and denote the Pomeron and Reggeon contributions. The Reggeon intercept is fixed to the value 0.5 which is compatible with the original DL value and by the re-evaluation of Cudell et al. With such an intercept the Reggeon contribution is negligible at HERA energies. Fitting the extrapolated BPC95 data alone yields a value for . Fitting both terms to the real photoproduction data (with ) and BPC95 data yields . Including in addition the two original measurements from HERA as well gives . All these values of are larger than the value of 1.08 used originally by DL, but we note that the best estimate of Cudell et al. is , which within the errors is consistent with our result. The final step in the analysis of the BPC data is to combine the GVMD fitted dependence with the Regge model energy dependence
The parameters and are fixed to their previous values of 0.53 and 0.5, respectively. The 3 remaining parameters are determined by fitting to real photoproduction data and the original BPC data. The description of the low data given by this DL style model is shown in Fig. 1. Data in the BPC region is well described. At larger values the curves fall below the data. Also shown in Fig. 1 for are the results of a NLO QCD fit (full line) as described in Sec. 2.5.
2.4 slopes:
To quantify the behaviour of as a function of and at low we calculate the two slopes from the ZEUS SVX95, BPC95 and ZEUS94 data sets.
At a fixed value of and at small the behaviour of can be characterised by , with taking rather different values in the Regge and BFKL approaches. is calculated from horizontal slices of ZEUS data between the HERA kinematic limit and a fixed cut of , here including E665 data. In a given bin is calculated from the mean value of weighted by the statistical errors of the corresponding values. The same procedure is applied to the theoretical curves shown for comparison.
Figure 3 shows the measured values of as a function of . From the Regge approach one would expect and independent of . Data for is consistent with this expectation. The linked points labelled DL are calculated from the Donnachie-Landshoff fit and as expected from the discussion of the previous section are somewhat below the data. For , increases slowly to around 0.3 at values of . Qualitatively the tendency of to increase with is described by a number of pQCD approaches. The linked points labelled GRV94 are calculated from the NLO QCD GRV94 fit. Although the GRV94 prediction follows the trend of the data it tends to lie above the data, particularly in the range .


Within the framework of pQCD, at small the behaviour of is largely determined by the behaviour of the sea quarks , whereas the is determined by the convolution of the splitting function and the gluon density, . In order to study the scaling violations of in more detail the logarithmic slope is derived from the data by fitting in bins of fixed . The statistical and systematic errors are determined as described above. The results for as a function of are shown in Fig. 3. For values of down to , the slopes are increasing as decreases. At lower values of and , the slope decreases. Comparing the rapid increase in at small with the behaviour of the , one is tempted to the naive conclusion that the underlying behaviour of the sea quark and gluon momentum distributions must be different at small , with the sea dominant and the gluon tending to zero. The failure of DL is in line with the earlier discussion. GRV94 does not follow the trend of the data when it turns over.
2.5 NLO QCD fit to data
In perturbative QCD the scaling violations of the structure function are caused by gluon bremsstrahlung from quarks and quark pair creation from gluons. In the low domain accessible at HERA the latter process dominates the scaling violations. A QCD analysis of structure functions measured at HERA therefore allows one to extract the gluon momentum density in the proton down to low values of . In this section we present NLO QCD fits to the ZEUS 1994 nominal vertex data and the SVX95 data of this paper. We are not attempting to include all available information on parton densities, but concentrating on what ZEUS data and their errors allow us to conclude about the gluon density at low .
To constrain the fits at high proton and deuteron structure function data from NMC and BCDMS are included. The kinematic range covered in this analysis is and .
The QCD predictions for the structure functions are obtained by solving the DGLAP evolution equations at NLO. These equations yield the quark and gluon momentum distributions at all values of provided they are given at some input scale . In this analysis we adopt the so-called fixed flavour number scheme where only three light flavours contribute to the quark density in the proton. The corresponding structure functions and are calculated from the photon-gluon fusion process including massive NLO corrections. The input valence distributions are taken from the parton distribution set MRS(R2). As for MRS(R2) we assume that the strange quark distribution is a given fraction of the sea at the scale . The gluon normalisation is fixed by the momentum sum rule. The input value for the strong coupling constant is set to and the charm mass is taken to be . In the QCD evolutions and the evaluation of the structure functions the renormalisation scale and mass factorisation scale are both set equal to . In the definition of the only statistical error are included and the relative normalisation of the data sets is fixed at unity. The fit yields a good description of the data as shown in Fig. 1. We have also checked that the gluon obtained from this fit to scaling violations is in agreement with the recent ZEUS measurements of charm production and in deep inelastic scattering at HERA.
Two types of systematic uncertainties have been considered in this analysis. ‘HERA standard errors’ contain statistical error on the data, experimental systematic uncertainties, relative normalisation of the different data sets and uncertainties on , the strange quark content of the proton and the charm mass. ‘Parametrisation errors’ contain uncertainties from a definition including statistical and experimental systematic errors, variations of the starting scale and an alternative, more flexible parametrisation of the gluon density using Chebycheff polynomials. The first type of errors amounts to at , , the second type yields in .
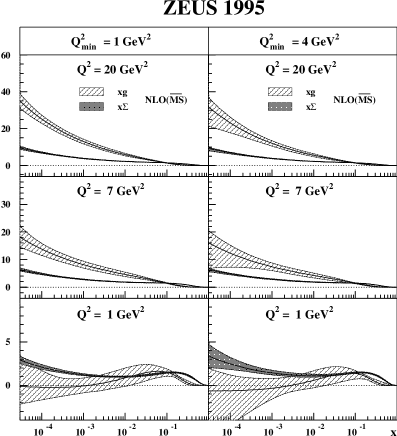
The three plots of Fig. 4 show the distribution for and as a function of for at 1, 7 and . It can be seen that even at the smallest is rising at small whereas the gluon distribution has become almost flat. These results give support to the naive conclusion of Sec. 2.4, that the sea distribution dominates at low and . At the gluon distribution is poorly determined and can, within errors, be negative at low .
3 Measurement of the Proton Structure Function from 1996 and 1997 data
3.1 Kinematics in Deep Inelastic Scattering
Recalling the double differential NC cross-section (3), but now including the corrections ( for and yields
| (5) |
Here the structure function contains contributions from virtual photon and exchange
| (6) |
where is the mass of the and , and are the contributions to due to photon exchange, exchange and interference respectively. In this analysis we determined the structure function using 1996 and 1997 data with an integrated luminosity of and , respectively.
The selection and kinematic reconstruction of NC DIS events is based on an observed positron and the hadronic final state. For further details see ref. .
3.2 Results
Monte Carlo samples are used to estimate the acceptance, migration, radiative corrections, electroweak corrections and background contributions. is then determined based on a bin-by-bin unfolding. The resulting statistical error, including the Monte Carlo statistics, ranges from 2% below to 5-6% at .
The systematic uncertainties have been estimated by varying the selection cuts, efficiencies and reconstruction techniques and redetermining the cross section including background estimates. Potential error source such as possible detector misalignment, event vertex reconstruction, calorimeter energy scale, positron identification efficiency, background contributions and hadronic energy flow have been considered. The total systematic uncertainty amounts to 3-4% except at low and high , where it grows to 12%. At the present preliminary state of the analysis we estimate an overall normalisation uncertainty of 3%.
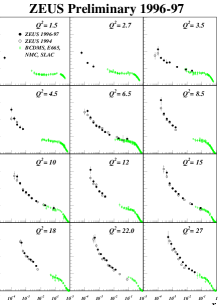
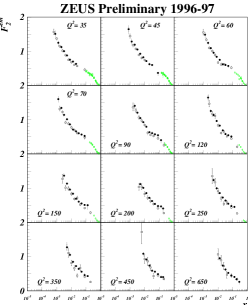
The resulting is shown as a function of for fixed in Figure 5. Results from our previous analysis, and from fixed target experiments are also shown for comparison. At low the rise in for is measured with improved precision. The coverage in has also been extended to higher , yielding extended overlap with the fixed target experiments; in the overlap region reasonable agreement has been found. The scaling violation from this analysis and the fixed target data are also shown in Figure 5. For the increase in statistics allows a measurement of in smaller bins with respect to our previous measurement. Above , the statistical error grows typically to 5-15% and dominates the total error. Overall our data are in agreement with our published data.


References
References
- [1] ZEUS Results on the Measurement and Phenomenology of at Low and Low , DESY 98-121 (August 1998) submitted to The European Physical Journal.
- [2] Measurement of the Proton Structure Function in Collisions at HERA, Submitted paper to the XXIX International Conference on High Energy Physics, Vancouver, July 23-29, 1998.