Pion-pion and pion-proton correlations - new results from CERES111Based on the Ph.D. thesis work of Dariusz Antończyk, Technical University Darmstadt, 2006
Abstract
Results of a new two-particle correlation analysis of central Pb+Au collision data at 158 GeV per nucleon are presented. The emphasis is put on pion-proton correlations and on the dependence of the two-pion correlation radii on the azimuthal emission angle with respect to the reaction plane.
pacs:
25.75.-q, 25.75.Gz, 25.70.PqI EXPERIMENT AND DATA ANALYSIS
CERES is a dilepton experiment at the CERN SPS, known for its observation of enhanced production of low mass e+e- pairs in collisions between heavy nuclei ceres-sau-pbau . The upgrade of CERES in 1997-1998 by a radial Time Projection Chamber (TPC) allowed to improve the momentum resolution and the particle identification capability while retaining the cylindrical symmetry (Fig. 1).
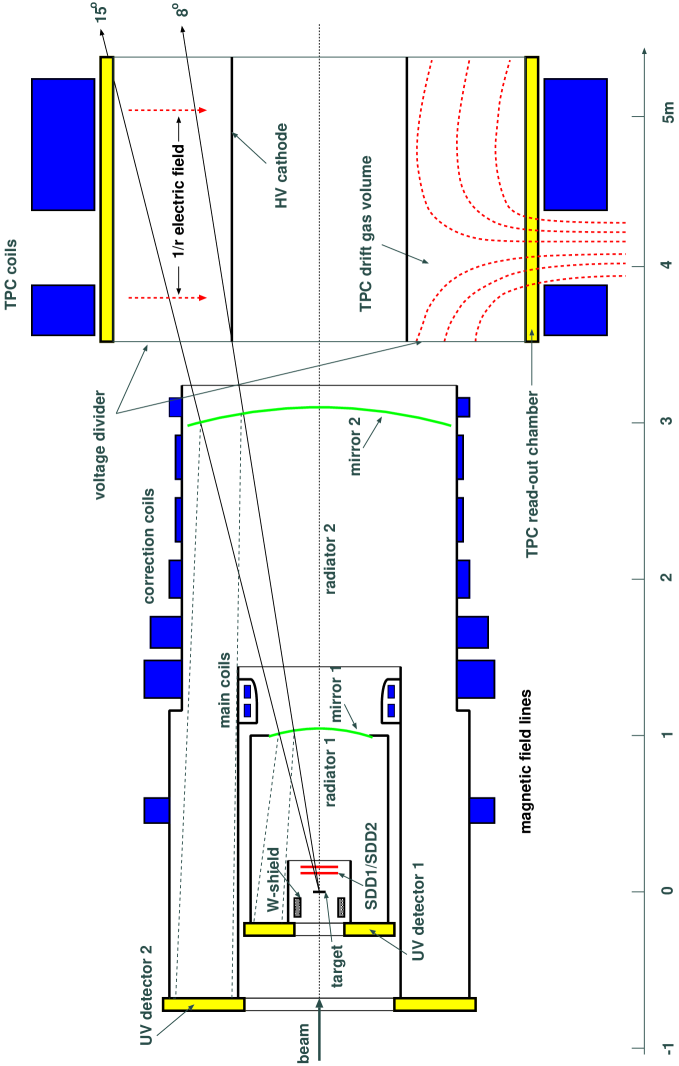
The TPC also opened the possibility of measuring hadrons. The upgraded experiment has been described in detail elsewhere ceres .
The measurement of central Pb+Au collisions at the maximum SPS energy of 158 GeV per nucleon in the fall of 2000 was the first run of the fully upgraded CERES and at the same time the last run of this experiment. About 30 million Pb+Au collision events at 158 GeV per nucleon were collected, most of them with centrality within the top 7% of the geometrical cross section = 6.94 b. Small samples of the 20% and the minimum bias collisions, as well as a short run at 80 AGeV, were recorded in addition. The first two-particle correlation analysis performed on a subset of these data resulted, among others, in an improved procedure to account for the Coulomb interaction heinz-pap and a new postulate of an universal freeze-out criterion heinz-let . The current analysis features a better momentum resolution
| (1) |
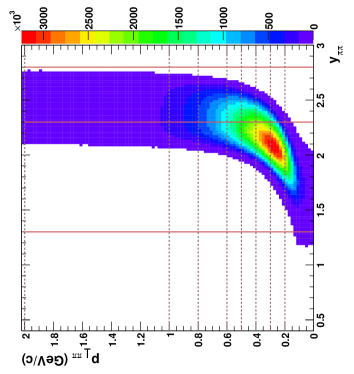
a better understanding of the two-track resolution, and was performed on the full data set. The (,) distribution of the analyzed pairs is shown in Fig. 2.
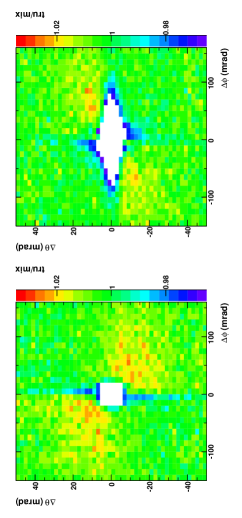
The two-track resolution cuts applied to the true pairs and to the pairs from event mixing were different for the two possible track pair topologies (Fig. 3). It should be noted that the required two-track cuts depended somewhat on the quality cuts applied to single tracks: the higher number of hits required for single tracks, the more pairs were lost because of the finite two-track resolution.
The two-pion analysis was performed in the longitudinally co-moving frame (LCMS) defined by the vanishing -component of the pair momentum. The momentum difference in this frame, q = p2-p1, was decomposed into the “out”, “side”, and “long” components following the Bertsch-Pratt convention, with pointing along the pair transverse momentum and along the beam. The non-identical correlations were analyzed in the pair c.m.s., the frame in which the pair momentum is zero. The two components there, and , were defined such that was along the pair transverse momentum, i.e. was equal to if the latter is calculated in the pair c.m.s.
II Two-pion correlations
The and correlation functions, defined as the three-dimensional distributions of pion pairs from the same event q, normalized to the analogous distributions of pairs constructed from different events (event mixing), were fitted by
| (2) |
The normalization factor is needed because the number of pairs from event mixing is arbitrary. The correlation strength 1 reflects the tails of the source distribution caused by the pions from long-lived resonances, the finite -resolution, and the contamination of the pion sample by other particle species. The fit parameters, with the indices , being {out, side, long}, are related to the size of the source emitting pions of given momentum mike-overview and will be called here HBT radii. The factor, , accounts for the mutual Coulomb interaction between the pions and was calculated by averaging the nonrelativistic Coulomb wave function squared over a realistic source size. The Coulomb factor was attenuated by similarly as the rest of the correlation function peak; the importance of this approach was demonstrated in heinz-pap . The fits were performed by the minimum negative loglikelihood method with the Poissonian number of true pairs and were done separately for each pair (,y) bin. The HBT radii obtained from the fit were corrected for the finite momentum resolution. The correction was determined by Monte Carlo and was rather insignificant for and ; for it gets as large as 20% for the highest bin of the pair . The obtained HBT radii show a strong dependence (Fig. 4).
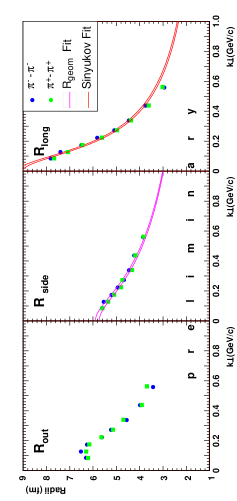
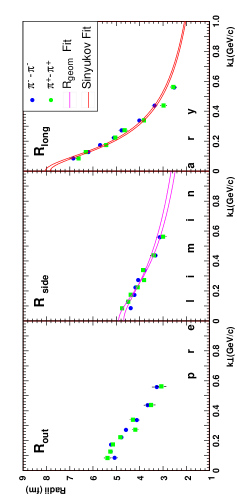
The and radii were fitted with rside ; rlong
| (3) | |||||
| (4) |
with the freeze-out temperature fixed to be 120 MeV. The results of the fit are shown in Fig. 5.
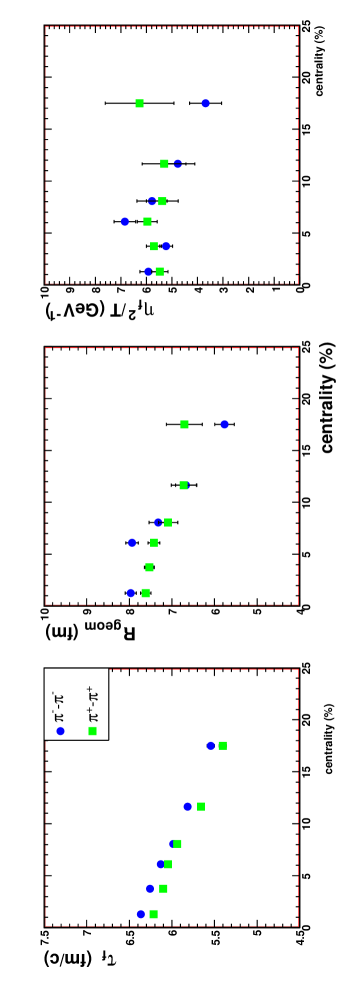
The obtained expansion time of 5.5-6.5 fm, geometrical source size of 6-8 fm, and transverse expansion rapidity of 0.7-0.8, in reasonable agreement with the results of the previous analysis of a subset of data heinz-pap , indicate a long-living, longitudinally and transversally expanding pion source.
III Azimuthal angle dependent HBT
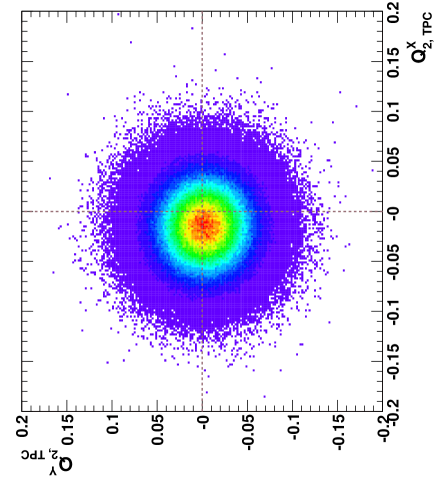
A fireball created in a collision with a finite impact parameter is elongated in the direction perpendicular to the reaction plane. In the course of expansion, with the pressure gradient larger in-plane than out-of-plane, the initial asymmetry should get reduced or even reversed. A dependence of the two-pion correlations on the pair emission angle with respect to the reaction plane would be a signature of the source eccentricity at the decoupling time. The azimuthal angle of the reaction plane was estimated by the preferred direction of the particle emission aka elliptic flow. The particles were weighted with their transverse momentum:
| (5) | |||||
| (6) |
The raw distribution is shown in Fig. 6. The reaction plane angle was calculated (modulo ) from the calibrated components via
| (7) |
The resolution of the so determined reaction plane angle, estimated via the subevevent method, was 31-38o.
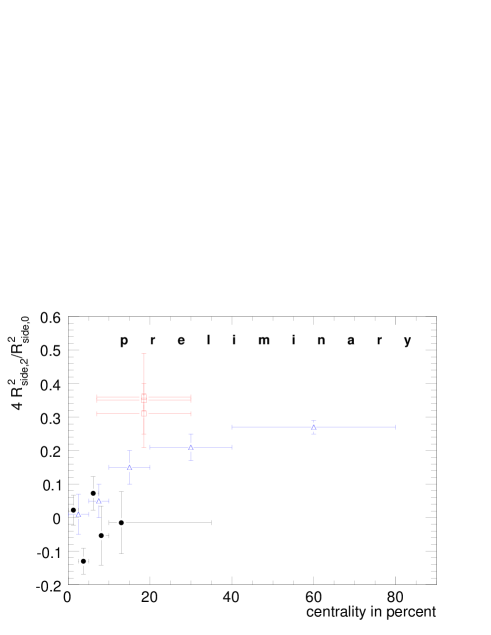
With the event plane known (within the resolution) event-by-event the pion pairs can be sorted into 8 bins covering according to their azimuthal angle with respect to the reaction plane . During event mixing it was required that the two events had a similar reaction plane angle . The eight correlation functions were fitted as described in Section II, and the resulting , , , and the cross-terms are plotted versus . The squared source radii were then fitted with
| (8) |
with denoting {out,side,long}. While the ’s obtained coincide with the results of the standard HBT analysis presented in Section II the second Fourier components ’s represent the eccentricity of the observed pion source. The normalized second Fourier component of is shown in Fig. 7. As far as the limited centrality range allows to judge the measured anisotropy is consistent with zero, in contrast to the out-of-plane elongated pion source observed both at the AGS ags and at RHIC rhic . The source eccentricity, thus, seems to be joining the exclusive club of heavy ion observables which behave non-monotonically with the collision energy, the other members being the flow and the strangeness-to-entropy ratio.
IV Pion-proton correlations
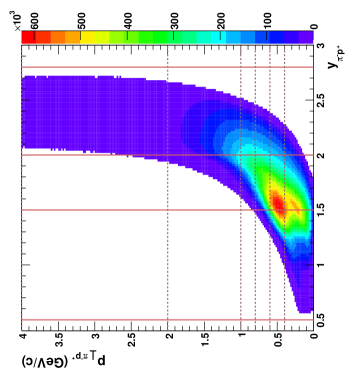
For the top central 7% of the geometrical cross section the high event statistics allows to perform the proton-pion correlation analysis. The shape of non-identical particle correlation functions reflects the shape of the relative source distributions . Particularly, a difference between the average freeze-out position or time of two particle species reveals itself as an asymmetry of the correlation function at small lednicky . A two-dimensional p correlation function (,) and its slice () for 50 MeV/c are shown in Fig. 8.
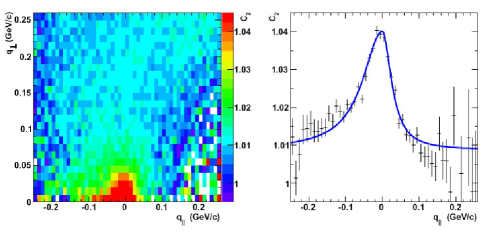
The peak at low comes from the attractive Coulomb interaction. The peak asymmetry indicates that the proton source is located at a larger radius than the pion source, or that protons are emitted earlier than pions. The asymmetry can be conveniently parametrized by fitting a Lorentz curve, which happens to match the shape, separately to the left and to the right half of the peak, and taking the ratio of the two widths:
| (9) |
where is a normalization factor and is the peak amplitude. The asymmetry is then defined as the ratio between the two widths .
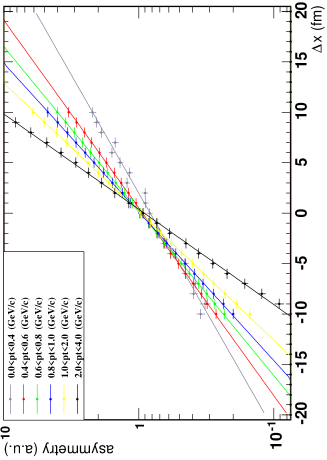
The asymmetry was translated to a spatial displacement between the proton and pion sources using a Monte Carlo pair generator with realistic source sizes and the Coulomb wave function squared as a weighting factor for each pair. The relation between the two quantities is shown in Fig. 9.
The resulting displacement as a function of the transverse pair momentum is shown in the right panel of Fig. 10. In the left panel the raw asymmetry is shown. The asymmetry and the displacement derived from it vanish in the limit of small pair as is expected for symmetry reasons.
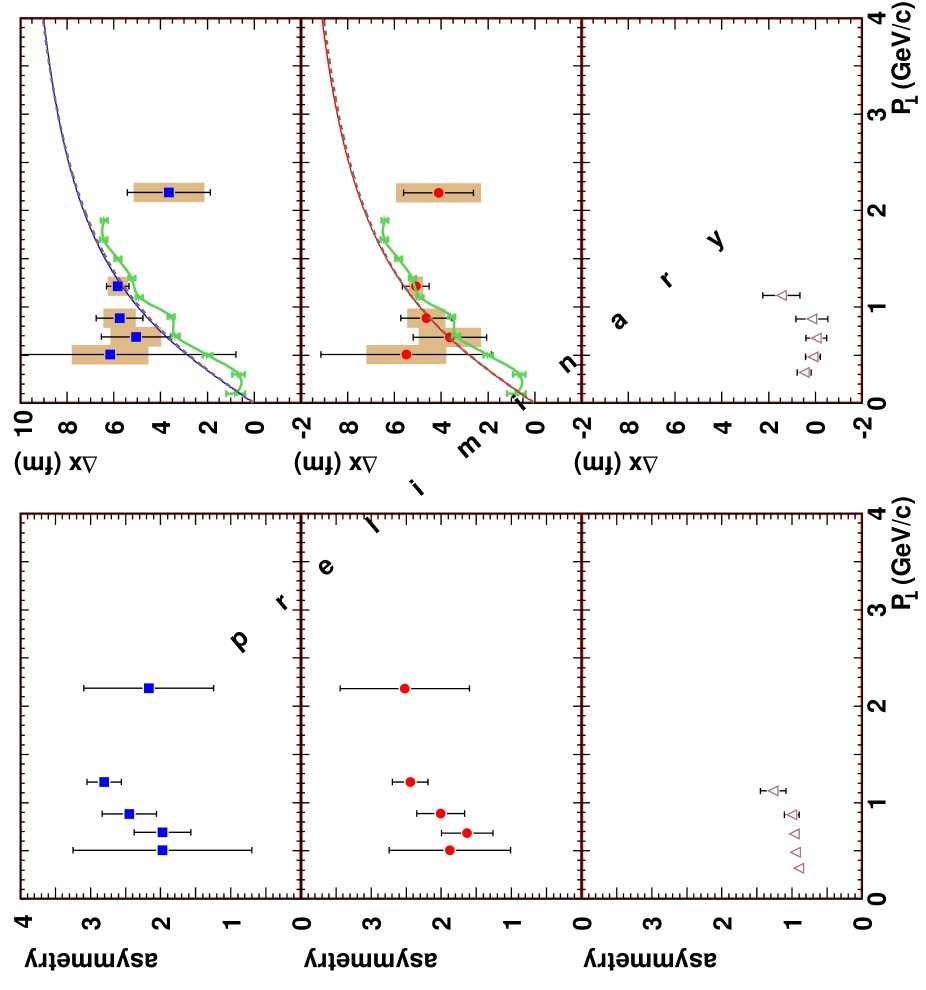
The displacement is rather similar to the spatial displacement seen in UrQMD v.1.3 urqmd (green line). The red and blue lines represent a simultaneous fit to () and () using, respectively, Eq.(3) and the formula derived in deltax :
| (10) |
with the pair transverse mass
| (11) |
and the pair transverse velocity
| (12) |
The relation between the rapidity and the velocity of transverse flow, which occur in the and fit formulas, respectively, is
| (13) |
The fit yields a of 0.65-0.70 and a of about 7.5 fm. The fit is dominated by the data with their small error bars but it reproduces the values quite well. This indicates that the finite displacement between the sources of pions and protons has a similar origin as the dependence of , namely the transverse flow. Other, possibly more interesting, contributions to it cannot be addressed with the present statistics of the data.
V Blast-wave parametrization
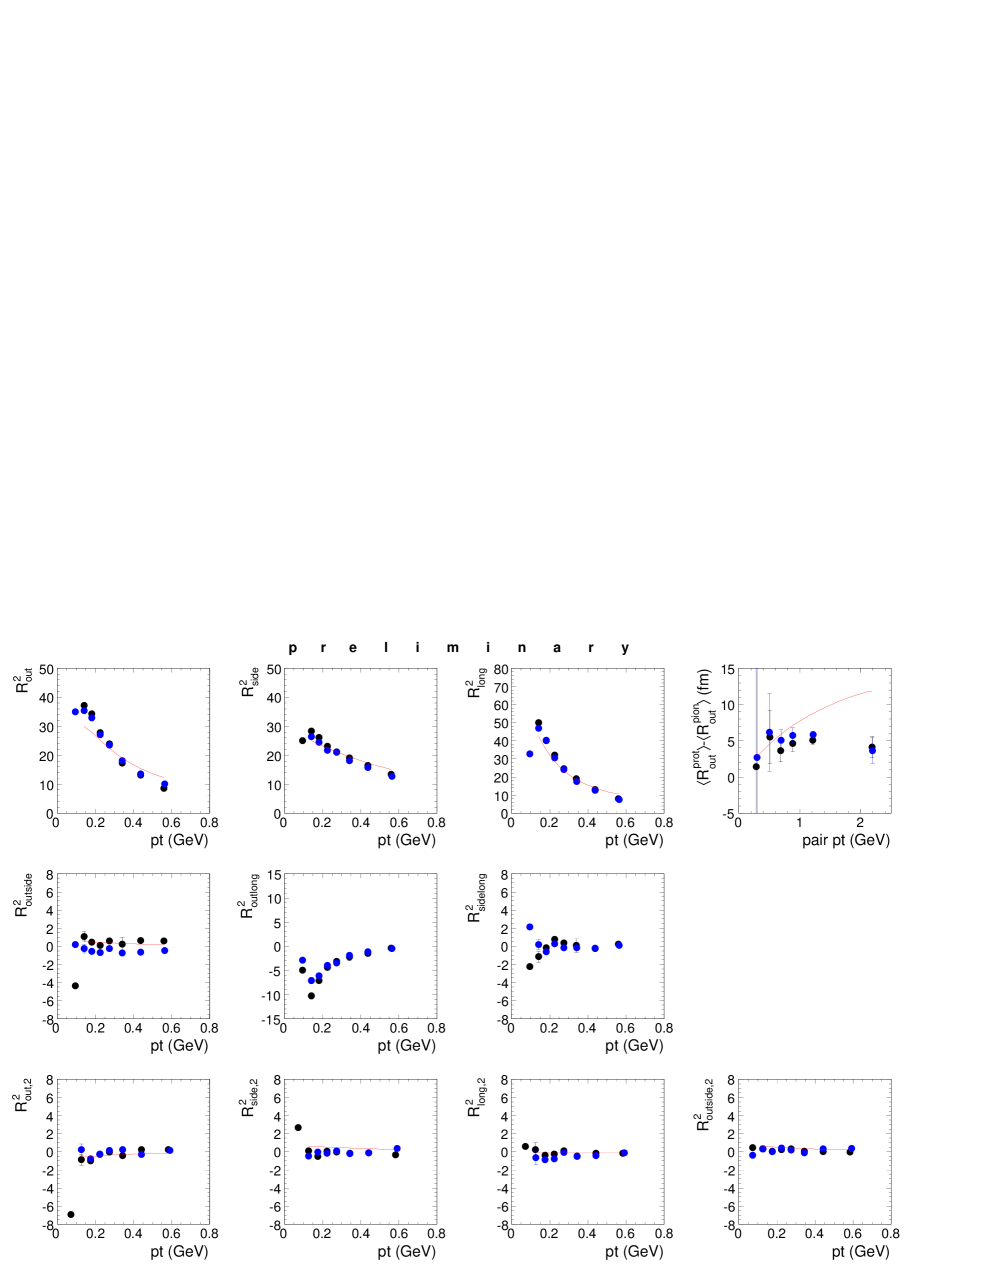
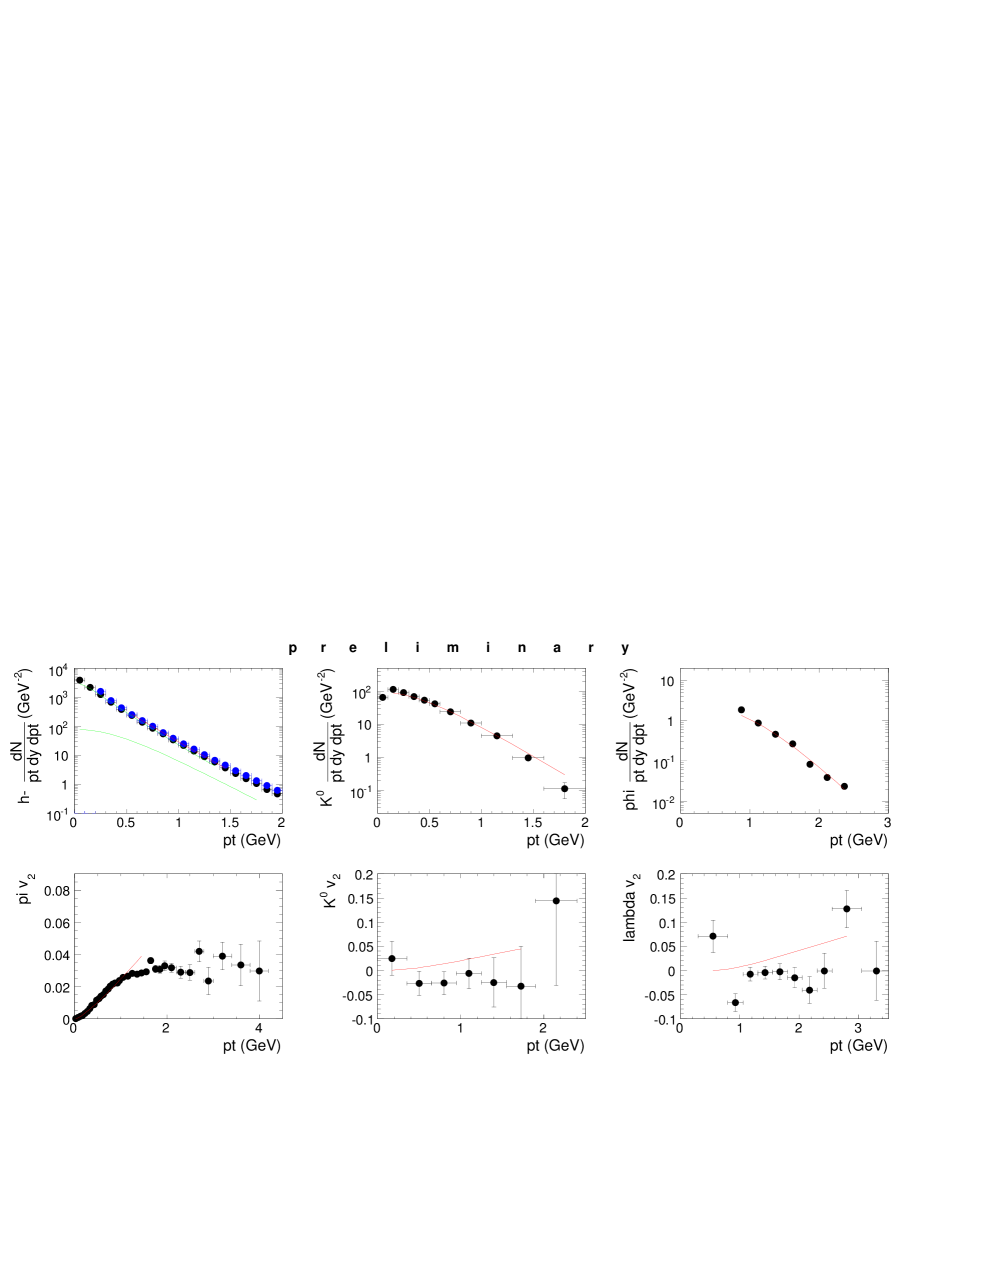
While it is notoriously difficult to describe many observables of heavy ion collisions within the same theoretical approach, in recent years simple hydrodynamics-inpired parametrizations turn out to be quite successful in this aspect. The blast-wave model of mike-blast , with its 8 parameters adjusted accordingly, nicely reproduces the transverse momentum spectra, the elliptic flow, and the two-particle correlations of CERES, including the emission angle dependence (or, rather, the lack of it). The transverse spectra and the elliptic flow coefficients from the top 7% of for several hadron species are shown along with the blast-wave model lines in Fig. 11. In Fig. 12 the two-particle correlation results are compared to the calculations performed with the blast-wave model with the same parameter values. The agreement is rather good. Two of the eight parameters of the model were fixed: the freeze-out temperature MeV and the sharpness of the emission volume (sharp). The other six parameters, adjusted to the data by the simplex method, include the transverse flow rapidity of 0.88 and 0.85 in-plane and out-of-plane, respectively; the source radius of (11.26, 11.42) fm; the emission time (i.e. the duration of the expansion) of 7.4 fm, and the duration of emission fm/c. The nearly-circular source was enforced by the smallness of the second Fourier component of the HBT radii (bottom part of Fig. 12).
VI Summary
In summary, the new high-statistics CERES hadron data allow for state of the art analysis of two-particle correlation data. The pion source anisotropy, accessible via the dependence of the two-pion HBT radii on the emission angle with respect to the reaction plane, is unexpectedly small compared to the analogous results obtained at lower and higher energies. The pion-proton correlations indicate that the proton source is located at a larger radius than the pion source, or that protons are emitted earlier than pions. The amount of the displacement, and its functional dependence on the transverse momentum of the two involved particles, corroborate the transverse expansion picture deduced from the behavior of the HBT radius. Finally, the blast-wave parametrization is able to describe simultaneously the transverse spectra and the elliptic flow coefficients of several hadron species, and the two-particle correlations.
This work was supported by the German BMBF, the U.S. DoE, the Israeli Science Foundation, and the MINERVA foundation. The data analysis was performed by D. Antończyk as a part of his Ph.D. thesis work. The author (DM) thanks the workshop organizers for the invitation and for the good and inspiring atmosphere of the meeting.
References
- (1) G. Agakichiev et al. (CERES), Phys. Rev. Lett. 75 (1995) 1272 and Eur. Phys. J. C41 (2005) 475.
- (2) D. Miskowiec, Nucl.Phys.A774, 43-50 (2006); A. Marin, J. Phys. G30, S709 (2004); Nucl. Instr. Meth., in preparation.
- (3) D. Adamova et al., Nucl. Phys. A714, 124 (2003).
- (4) D. Adamova et al., Phys. Rev. Lett. 90, 022301 (2003).
- (5) M.A.Lisa, S.Pratt, R.Soltz, and U.Wiedemann, Ann. Rev. Nucl. Part. Sci. 55, 357 (2005).
- (6) S.Chapman, J.R.Nix, and U.Heinz, Phys. Rev. C52, 2694 (1995); T.Csörgő and B.Lörstad, Phys. Rev. C54, 1390 (1996); R.Scheibl and U. Heinz, Phys. Rev. C59, 1585 (1999).
- (7) A.N.Makhlin and Yu.M.Sinyukov, Z. Phys. C39, 69 (1988); S.V.Akkelin and Yu.M.Sinyukov, Phys. Lett. B356, 525 (1995); M.Herrmann and G.F.Bertsch, Phys. Rev. C51, 328 (1995); U.A.Wiedemann, P.Scotto, and U.Heinz, Phys. Rev. C53, 918 (1996).
- (8) M.A. Lisa et al., Phys. Lett. B496, 1 (2000).
- (9) J.Adams et al., Phys. Rev. C72, 014904 (2005).
- (10) R.Lednicky, V.L.Lyuboshitz, B.Erazmus, and D.Nouais, Phys. Lett. B373, 30 (1996).
- (11) S.A.Bass et al., Prog. Part. Nucl. Phys. 41, 225 (1998); M. Bleicher et al., J. Phys. G: Nucl. Part. Phys. 25, 1859 (1999).
- (12) S.V.Akkelin and Yu.M.Sinyukov, Z. Phys. C72, 501 (1996); R.Lednicky, Phys. Atom. Nucl. 67, 72 (2004).
- (13) F.Retiere and M.A.Lisa, Phys. Rev. C70, 044907 (2004).