The implications of final L3 measurement of
Jiří Chýla
Center for Particle Physics, Institute of Physics, Academy of Sciences of the Czech Republic
Na Slovance 2, 18221 Prague 8, Czech Republic, e-mail: chyla@fzu.cz
Abstract
The excess of data on the total cross section of production in collisions over QCD predictions, observed by L3, OPAL and DELPHI Collaborations at LEP2, has so far defied explanation. The recent final analysis of L3 data has brought important new information concerning the dependence of the observed excess on the collisions energy . The implications of this dependence are discussed.
In [1] we discussed various aspects of the theoretical description of production in collisions which might be relevant for explanation of the excess of data on over QCD predictions, observed in [2, 3, 4]. The conclusions closed with the observation that in order to understand this excess “the separation of data into at least two bins of the hadronic energy , say GeV and GeV, could be instrumental in pinning down the possible mechanisms or phenomena responsible for the observed excess.”
In the meantime final analysis of L3 data on the production in collisions at LEP2 has appeared [5]. In this paper the distribution of the excess of data over the theoretical prediction [6] is plotted, for both the electron and muon samples, as a function of the visible collision energy . These plots, reproduced in Fig. 1a,b, show that the excess comes predominantly from low , roughly GeV.
To exploit this information the knowledge of the correlation between the true and the visible energy is needed. Such correlation was studied by L3 for the analogous case of production in collisions in [7]. Unfortunately, no such study is either available or foreseen [8] for the case of production. We can therefore make only rough estimate based on the results shown in Fig. 1c. They indicate that the excess from the region GeV translates roughly to GeV, with more than half of it coming from GeV, i.e. GeV. With this information on the kinematic region wherefrom comes most of the excess measured at hand, what can be said about its possible origins?
In [1] we have introduced several measures characterizing the -dependence of the four individual contributions to : pure QED term and three QCD corrections, direct photon and single and double resolved photon contributions. Two of them, namely
| (1) |
quantify how much of a given contribution comes from the region up to or above it, whereas gives the relative importance of individual contributions at fixed . The associated plots, corresponding to pure QED term and lowest order QCD contributions to direct and resolved photon channels are displayed in Fig. 2. They reveal large difference in both shape and magnitude, which, taking into account the correlation between and can be used to draw the following conclusions from L3 data.
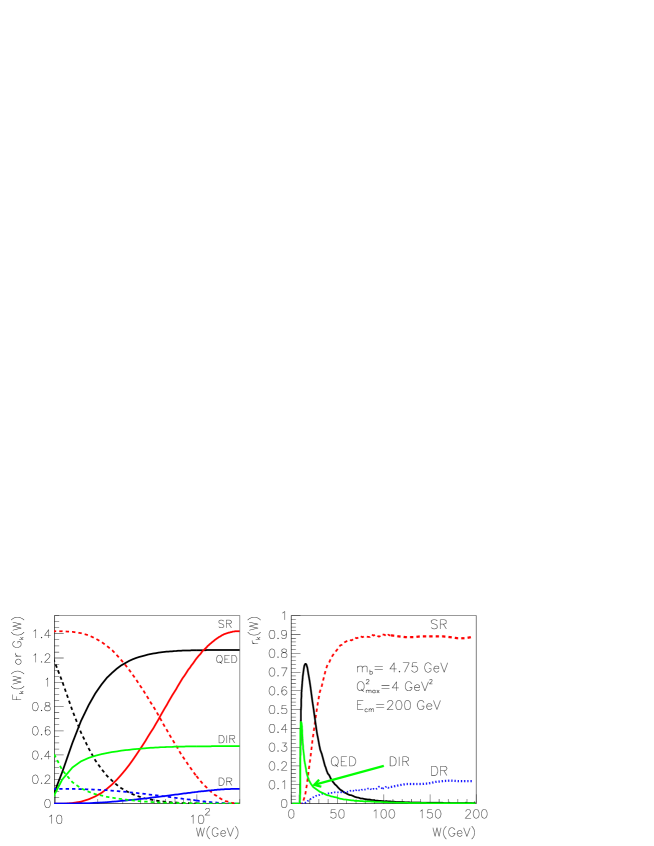
In the region GeV about 63% of the sum of the four contributions comes from the pure QED one, about 21% from direct photon and 16% from resolved photon ones (double resolved photon contribution is negligible throughout the kinematic region accessible at LEP2). To enhance significantly the theoretical prediction in this region requires very large higher QCD corrections in the latter two channels. To my mind there are two possibilities. As emphasized in [1] the part of direct photon correction proportional to (coming from diagrams like that in Fig. 3a), absent from all existing calculations like [6], is needed to make the direct photon contribution of genuine next-to-leading order in . I have no idea how large it can be but we should keep in mind that in this range the transverse momenta of quarks are small and the hard scale is thus given approximately by . This is not small, but it is not large either and so enhancement by a factor of does not seem impossible. Also, the proper (in whatever sense one understands this word) choice of the renormalization scale is likely to be crucial in this region. Because we are close to the threshold for producing the pair, the threshold corrections of the type investigated in [9, 10] for hadroproduction of pairs may also be numerically quite important. Because of a quite different initial state in collisions, it is, however, difficult to make any quantitative guess based on such calculations.
About half of the excess comes from the region GeV, where QED and direct photon contributions are negligible and the single resolved photon dominates the sum of all lowest order contributions. As the threshold corrections are likely to be less important here, we are left with the question whether the existing higher order QCD corrections to single resolved photon contribution [6] are reliable, i.e whether the “theoretical uncertainty” attached to them correctly reflects our (lack of) knowledge of all relevant effects.
In [1] we have shown that in this kinematic region the next-to-leading order calculations of this contribution, , considered as a function of two independent parameters, the renormalization scale and the factorization scale , exhibits no region of local stability. The standard choice of scales thus picks up a point where the NLO results that are inherently unstable. Moreover, the standard way of estimating the associated “theoretical uncertainty” by varying this common scale around within a factor of two is entirely ad hoc. I have furthermore argued that to make these calculations factorization scale invariant to the order considered the part of direct photon contribution of the order proportional to must also be included. This contribution, which comes from diagrams like that in Fig. 3b integrated over the region outside the singularities at and , is related to the leading and next-to-leading order single resolved photon contributions corresponding to diagrams in Fig. 3c,d.
Unfortunately, as the mentioned direct photon calculations are not available, we cannot check whether by adding them to the single resolved photon contribution, which is also proportional to , the sum will be more stable than the latter contribution alone. Neither can one estimate their numerical effect, but as in the case of the direct photon contribution of the order proportional to , it is not impossible that they might significantly enhance the existing NLO calculations and bring them thus closer to the data.

In summary, the final L3 analysis of their data on indicates that the observed excess of the data over the current QCD calculations extends over most of the accessible range, with about half of it coming from small GeV. Our conjecture is that at least part of this excess may be due to the absence of the so far uncalculated order direct photon contributions proportional to both and . In the region GeV also the threshold corrections may be numerically important. Both of the mentioned calculations are difficult, but certainly worth the efforts.
Acknowledgment
This work was supported by the project AV0-Z10100502 of the Academy of Sciences of the Czech Republic and the project LC527 of the Ministry of Education of the Czech Republic. I am grateful to Bernard Echenard and Valeri Andreev for correspondence concerning the correlation between true and visible collision energy and to Nikolaos Kidonakis for discussion of the importance of threshold corrections in general hard processes.
References
- [1] J. Chýla, Phys. Rev. D70:054001, 2004
- [2] M. Acciarri et al. (L3 Collab.): Phys. Lett. B503 (2001), 10
- [3] OPAL Collab.: OPAL Physics Note PN455, August 2000
- [4] W. Da Silva et al. (DELPHI Collab.), Nucl. Phys. B 126 (2004), 185
- [5] P. Achard et al. (L3 Collab.): Phys. Lett. B619 (2005), 71
- [6] M. Drees, M. Krämer, J. Zunft, and P. Zerwas, Phys. Lett. B 306 (1993), 371
- [7] M. Acciarri et al. (L3 Collab.): Phys. Lett. B541 (2001), 19
- [8] V. Andreev, private communication
- [9] R. Bonciani, S. Catani, M. Mangano, P. Nason: Nucl. Phys. B529 (1998), 424
- [10] N. Kidonakis, R. Vogt: Eur. Phys. J. C36 (2004), 201