Determining weak phase and probing new physics in
transitions from
Abstract
We present a method of determining weak phase in the Cabibbo-Kobayashi-Maskawa matrix from decays alone. Given a large ratio between color-suppressed and color-allowed tree diagrams extracted from global fits, is determined from the current data of and the result is in agreement with the global Standard Model(SM) fits. However, a smaller ratio from factorization based calculations gives . New physics beyond the SM can be singled out if obtained in modes is significantly different than the ones from other modes or other approaches. The effective value of from is very sensitive to new physics contributions and can be used to extract new physics parameters for a class of models which do not give contributions to strong phases significantly.
pacs:
13.25.Hw,11.30.Er, 11.30.HvI Introduction
Precisely obtaining the weak phase , and in the Cabibbo-Kobayashi-Maskawa (CKM) matrix is one of the central issues in the current studies of decays. Besides global fits to all the indirect measurements in the Standard Model (SM)Charles et al. (2004); Bona et al. (2005) or measurements on the time-dependent CP asymmetry in , the phase angles and of the unitarity triangle can also be probed from hadronic charmless decays. In the charmless decay modes with denoting a pseudo-scalar final state, the weak phase can be determined either with theoretical inputs such as QCD factorization Beneke et al. (2001); Beneke and Neubert (2003), perturbation QCD Keum et al. (2001); Keum (2002); Keum and Sanda (2003) and soft-collinear effective theories Bauer et al. (2004a, b); Grossman et al. (2005) etc, or through model independent phenomenological methods based on flavor SU(3) symmetry Zeppenfeld (1981); Savage and Wise (1989); Chau et al. (1991); Gronau et al. (1994, 1995); Gronau and Rosner (1996, 2002); Chiang (2005).
Within the flavor SU(3) symmetry, direct decay amplitudes are described by a set of flavor topological diagrams. The leading diagrams involve: a tree diagram , a color suppressed tree diagram , a flavor octet (singlet) QCD penguin diagram and a color allowed (color-suppressed) electroweak penguin diagram () etc. The hierarchical structure in the size of these diagrams simplifies the analysis and makes it powerful in exploring the hadronic decays. Recent global fits using the diagrammatic method have already shown that the weak phase can be determined with a reasonable precision and the obtained value agrees well with the one from the global CKM fit Wu and Zhou (2000a); Zhou et al. (2001); He et al. (2001); Ali et al. (2004); Chiang et al. (2004a); Wu and Zhou (2005a, b).
However, the current data also exhibit some puzzling patterns which needs further understanding. The unexpected large branching ratio of and the relative suppression of possess a big theoretical challenge and may require large nonfactorizable contributionsBuras et al. (2004a, b, c); the relative enhancement of to may lead to an enhancement of electroweak penguin which could be a signal of new physics ( see, eg. Yoshikawa (2003); Mishima and Yoshikawa (2004); Buras et al. (2004a, b, c); Wu and Zhou (2005a, b)). The recently measured mixing-induced CP asymmetries of (, though not conclusive yet, suggest a possibility that the weak phase obtained from penguin-dominant processes may deviate from the one determined from tree-dominated process Buchalla et al. (2005); Beneke (2005); Kim et al. (2005a).
The global fit to all the charmless decay modes connected by flavor SU(3) symmetry is the most consistent way to explore the weak phases and the involved hadronic decay amplitudes. However, to get more insight on the potential inconsistencies in the theory and a better understanding of the strong dynamics in hadronic decays it is usefully to divide the whole decay modes into several subsets in which the relevant parameters can be investigated individually. The comparison among the same quantities obtained from different subsets will not only provide us important cross-checks but also shed light on the origins of those puzzles and possible signals of new physics beyond the SM.
For instance, in system the three decays modes provide at most seven independent observables including three branching ratios, two direct CP asymmetries (the direct CP asymmetry for is predicted to be vanishing in SM) and two mixing-induced CP asymmetries, enough to determine the involved hadronic amplitudes , , and also the weak phase . In modes, the electroweak penguins are small and negligible. The recent fits taking weak phase as input show a good determination of all the amplitudes. The ratio of is found to be large close to 0.8Chiang et al. (2004a); He and McKellar (2004); Charng and Li (2004); Wu and Zhou (2005a, b); Kim et al. (2005b), the weak phase is determined up to a multi-fold ambiguity and one of them agrees well with the SM global fit value . In system, the available data involve four CP averaged branching ratios, three direct CP asymmetries ( the direct CP asymmetry in is predicted to be nearly zero when annihilation diagram is negligible). Plussing a mixing-induced CP asymmetry in , there are eight data points in total. The independent flavor diagrams include , and . The electro-weak penguin is significant but can be related to tree type diagrams in the SM Neubert (1999); Gronau and Rosner (2003). Other parameters in the CKM matrix elements can be chosen as angles and or the Wolfenstein parameter and . Thus the shape of the whole unitarity triangle can be in principle determined in modes aloneImbeault et al. (2004). The current data of are not enough to perform such an independent determination. Taking the SM value of weak phase and as inputs, one can extract other hadronic amplitudes. The recent fits show a even larger value of and enhancement of Baek et al. (2005); Wu and Zhou (2005b).
In the present paper, we discuss the determination of from an other important subset, the modes. The advantages of using final states over the and states are as follows
-
All the four modes are penguin dominant with appreciable tree-penguin interferences. Nonvanishing direct CP asymmetries are expected in all the four decay modes, while in () one of the direct CP asymmetry in () is predicted to be nearly zero.
-
The two neutral modes in will provides two additional data points from mixing-induced CP asymmetries in , while in there is only one.
-
Most importantly, the flavor topological structure in amplitudes allows a regrouping of penguin type diagrams in such a way that the number of independent hadronic amplitudes can be reduced to four complex parameters.
-
The electroweak penguin diagram can be included in the reduced hadronic parameters. It is not necessary to assume the SM relation between electroweak penguin and tree type diagram. This is of particular importance as the current data imply the possibility of new physics beyond the SM.
Thus in modes there will be at most ten observables available, enough to simultaneously determine all the involved diagrammatic amplitudes, the weak phase and which determine the apex of the unitarity triangle. This method distinguishes itself from the previous ones in that it makes use of the modes alone while the previous methods focus on constructing quadrangles connecting to modes using SU(3) symmetryGronau and Rosner (1996); Dighe (1996).
This paper is organized as follows, in section II, we present details of determining weak phase from modes. In section III, the implications from the current data of is discussed. We take typical values of hadronic parameters as inputs to constrain from modes. In section IV, the new physics effects on the determination is discussed. We finally conclude in section V.
II Determining from
We assume flavor SU(3) symmetry and take the following diagrammatic decomposition for decay amplitudes Dighe et al. (1996).
| (1) |
which corresponds to the flavor contents of and respectively. This is in accordance with an mixing angle of Dighe et al. (1996). Such a simple mixing scheme is a good approximation in phenomenology and is extensively used in the recent analyses of hadronic and decays Dighe et al. (1997); Fu et al. (2004); Chiang et al. (2003); Wu et al. (2005). The two penguin type diagram are given by
| (2) |
In the above expressions we assume that the color-suppressed electro-weak penguin and annihilation diagram are small and negligible. We shall also assume the -quark dominance in the penguin diagrams. With these assumptions, all the decay amplitudes depend on four complex parameters . The two weak phases and enter the expressions from direct and mixing-induced CP asymmetries as additional free parameters. Removing a overall strong phase, there are 9 real free parameters to be determined by 10 observables in modes which include four CP averaged decay rates, four direct CP asymmetries and two mixing-induced CP asymmetries in . Although the expressions of and depends on mixing scheme, the isospin symmetry guarantees that neutral() and charged () modes have the same coefficients for and also , which allows the reduction to a single penguin type parameter. Thus the number of free parameters is the same for other mixing schemes such as FKS and two-mixing angle schemes ( see, e.g. Leutwyler (1998); Feldmann (2000)).
The CP averaged branching ratio is defined through
| (3) |
where the factor stands for the life time difference in mesons and is normalized to for neutral(charged) modes with the life time for neutral (charged) mesons and . The definition of direct CP asymmetry is
| (4) |
The mixing-induced CP asymmetry is defined as
| (5) | |||||
where
| , | (6) |
with the weak phase appearing in mixing and in the SM. The coefficient is related to the direct CP asymmetry by . The latest data involving are summarized in Tab.1 Aubert et al. (2005); Abe et al. (2004); hfa
| CLEO | BaBar | Belle | WA | |
|---|---|---|---|---|
| ) | ||||
It is well known that the unusually large branching ratios of modes may require a enhancement of flavor singlet penguin diagrams , which possess an other theoretical challenge and is still under extensive theoretical study ( see, e.g.eta ). The flavour singlet contribution can be systematically calculated in QCD factorization, the results favour a smaller value with significant theoretical uncertaintiesBeneke and Neubert (2002). However, for the purpose of extracting weak phases one needs only the ratios of decay rates between neutral and charged modes in which the penguin amplitudes cancel in a great extent, making the results in sensitive to . We then define a ratio between neutral and charged decay rates as
| (7) |
The current data of gives
| (8) |
The corresponding ratio in modes gives . The ratio between tree and penguin type diagrams are parameterized as
| , | (9) |
where and are both real-valued. and are purely strong phases as the weak phase has been extracted from the definitions. We further define a ratio between color-suppressed and color-allowed tree diagrams
| (10) |
with and , which are common to both and modes.
All the parameters can be solved numerically from the above equations. They can also be solved analytically to the leading order expansion of and . Taking the modes as an example, to the leading order of and , the ratio of the decay rates is given by
| (11) |
The two direct CP asymmetries are
| (12) | ||||
| (13) |
The mixing-induced CP violation is found to be
| (14) |
In the above expressions, we use the primed quantities such as , , and to denote ratio of decay rates, direct and mixing-induced CP asymmetries respectively in modes. For process, equations similar to Eq.(11)-(14) can be constructed with the substitution of primed quantities to be unprimed ones i.e , , and etc. The Eqs.(11)-(14) together with the ones for modes provide eight equations which constrain the eight parameters,
A simultaneous determination of and will allow a reconstruction of the unitarity triangle from modes alone.
Since great success has already been achieved in the measurement of from in the two -factories and the value obtained agrees remarkably with the one from global fits to all the indirect measurements such as neutral and meson mixing and semileptonic decays etc, throughout this paper we shall take the value of Aubert et al. (2002); Abe et al. (2002)
| (15) |
from as input and focus on the determination of the less known weak phase in modes.
Following this strategy, the value of and are determined purely by direct CP asymmetries and
| (16) |
and
| (17) |
Note that the determination of requires CP asymmetry measurements for both and modes. The solution to in terms of of , and is found straight forwardly
| (18) |
Thus is determined up to discrete ambiguities. The above expression forms the base of the present paper. The weak phase does not depend on the ratio and . It only depends on the ratio between tree type diagrams and . The accuracy of depends heavily on the CP violation measurements. It also depends on the ratios of the decay rates . Note again that in this method the weak phase is determined within a closed subset of . No measurements from other modes are needed. In a typical case where is small and , the second term in the right handed side of Eq.(18) is negligible, the sign of depends on the sign of . Thus a positive nontrivially requires since the current data prefer . The value of will be enhanced if or is very small.
The main source of the uncertainties comes from the SU(3) breaking between and decay amplitudes. At present there is no robust estimates for SU(3) breaking effects. In the naive factorization approach the SU(3) breaking arises from two difference pieces in amplitudes. One is proportional to the form factors with the form factor of transition. The other one is proportional to the decay constants . This is gives an estimate that the SU(3) breaking effect is up to . It needs to be emphasised that and are treated as two independent parameters not related by SU(3) symmetry. Note that the SU(3) symmetry could be broken in a more complicated way in the strong phaseWu and Zhou (2003) and radiative corrections may give contributions not proportional to the decay constants Beneke and Neubert (2002). The accuracy of , and lies on the precision of s to be measured from modes. The branching ratios for are known to be large ( a few ), while the modes are expected to be an order of magnitude smaller due to it’s flavor structure Lipkin (1991). However, in the modes the tree-penguin interferences could be stronger and the direct CP asymmetries could be more significant. With the increasing statistics in the two -factories, the precision of ) will be improved. Higher precision measurements can be achieved in the future super- factories Hewett et al. (2004).
III Implications from the latest data
The weak phase obtained from modes can be compared with the one from other methods. The difference, if exists will shed light on the nonstandard contributions or possible new physics. At present, the data of the direct and mixing-induced CP asymmetries for are not yet available, one can not have a practical estimate of from Eq.(18). However, and can be extracted from other modes or calculated theoretically. Taking and as inputs, one can infer the value of from modes using the current data and compare it with the SM fit value. For illustrations, we consider two typical sets for the value of and
-
a)
The values of and are extracted from global and fit based on flavor SU(3) symmetry. All the recent fits prefer a large Chiang et al. (2004b); Wu and Zhou (2005a, b); He and McKellar (2004); Charng and Li (2004); Kim et al. (2005b). From an up to date fit in Ref.Wu and Zhou (2005b), one finds the following values
, (19) The large is driven by the observed large branching ratio of . The value of obtained in the and fits can be directly used in as the leading SU(3) breaking effects cancel in the ratio between and .
-
b)
The values of and are taken from QCD factorization calculations Beneke and Neubert (2003); Beneke and Jager (2005), which prefers smaller values with considerable uncertainties. In numerical estimations we take the following typical values from the latest QCD factorization estimate Beneke and Jager (2005)
, (20)
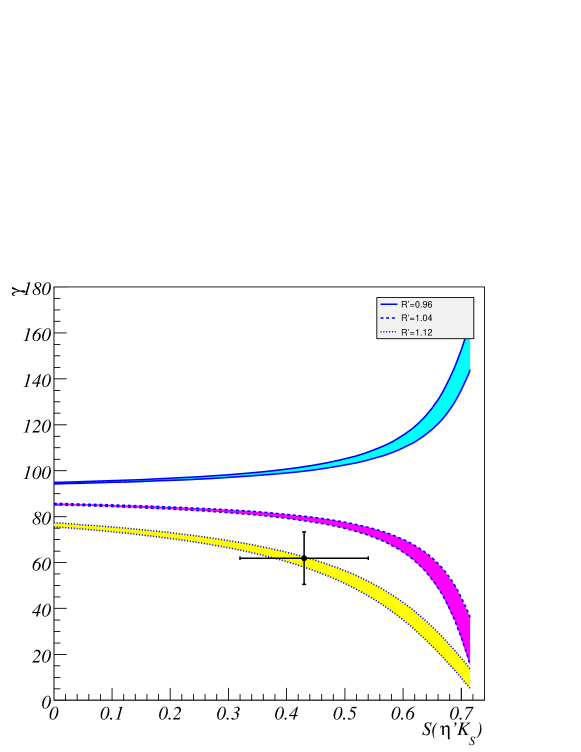
In Fig.1. we plot as a function of , taking Eq.(19) as inputs for three different values of =0.96, 1.04 and 1.12 respectively, corresponding to the allowed range. The figure shows a strong dependence of on both and . For , grows up with increasing and is always larger than the best fitted value from global CKM fit. For , it moves down to the opposite direction and reaches for . For , becomes infinity which fix at . The current data of can not definitely tell us if is greater or smaller than unity. To have a robust conclusion, higher precision data are urgently needed.
From Fig.1, one finds a overall consistency with the global SM fit. For and varying in the range, the value of is found to be
| (21) |
The error is still significant and the center value gives a slightly large . Note that some previous analyses found problems to coincide with a small Chiang et al. (2004a); Gronau and Rosner (2005). The difference mainly originates from the data used in the fits. In the present paper, we use the updated data while in the previous ones the old data of and are used which corresponds to . As it is shown in Fig.1, a small will not make a good fit.
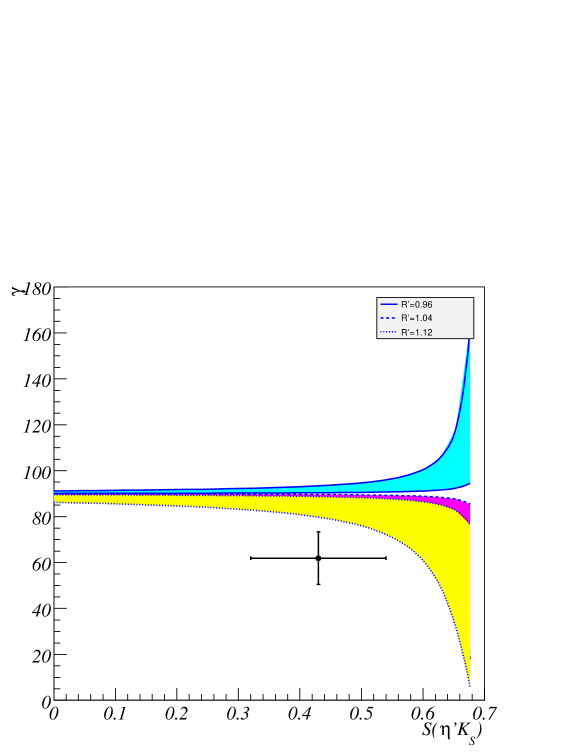
In Fig.2, a similar plot is made with the values of and taken from Eq.(20). Comparing with Fig.1, one sees a smoother dependence on and , for a smaller from Eq.(20) and , in the range, the value of is found to be confined in a narrow range of
| (22) |
Clearly, a large is favored in this case. The reason is that the smaller enhances , making the three curves closing to each other and forcing to be . In this case can reach only for , i.e. close to the from . One has to bear in mind that the measurement on is not very conclusive yet as there still exist discrepancy between Babar and Belle results Aubert et al. (2005); Abe et al. (2004). Using the PDG average method, the error should be enlarged by a factor of which is the square root of the chi-square value of the average. This gives . However, a large is still favored in the enlarged region. The theoretical prediction to based on QCD factorization prefer that is slightly greater than , Buchalla et al. (2005); Beneke (2005). This remains to be tested in the future experiment.
It follows from the above results that if is indeed around , a large is favored by the current data of only, which is independent of the data of and . Independent determination of the relative size of the color-suppressed tree diagram may provide us important hints on it’s origin. A possible explanation is that the extracted is an effective amplitude involving other important contributions such as: a large nonfactorizable -exchanging diagram Buras et al. (2004a, b, c), a large penguin type diagram contribution through internal loops, i.e. the charming penguin Ciuchini et al. (1997, 2001), large final state interactions Barshay et al. (2004); Cheng et al. (2005) etc. The exchange diagram only contributes to modes and will not affect and . The charming penguin always come together with the ordinary penguin diagrams. But the tree-penguin interferences are different in and . One can not expect a universal enhancement pattern of in all modes. The final state interaction is more process-dependent. Thus if the ratio can be precisely determined independently from various subsets, it is possible to distinguish some of the explanations. For instance, if large is confirmed in all the , and modes, the first explanation will not be favored.
IV New physics effects
We proceed to discuss the new physics contributions. When the weak phase is taken as known from , there are eight data points to constrain seven real parameters in system. The nonzero degree-of-freedom allows one to make cross-checks for consistency or explore new physics contributions.
The new physics may affect the observables in two different ways. One is through modifying mixing which makes . The consequence is that the mixing induced CP asymmetry for all the modes will be affected in the same manner, which is not very likely as the measurement of from agrees remarkably with all the indirect measurements of the unitarity triangle and so far no systematic deviations of from it’s global SM fit value are confirmed in other modes. The other way is that new physics contributes to decay amplitudes, most likely through loop processes. In this case the modifications to direct and mixing-induced CP asymmetries will be process dependent.
Taking the modes as an example, we parameterize the new physics contribution to penguin in the following form
| (23) |
where and are the strong and weak phases generated by new physics. It’s relative size to is denoted by . For simplicity, we assume that the new physics contribution respects the isospin symmetry under . This happens to the modes mainly contributing to the QCD penguins Kagan and Petrov (1997). For any specific models such as the two-Higgs-doublet model 2hd ; Wu and Zhou (2000b, 2001, 2004), the model Barger et al. (2004) etc. the relation between them is computable. In the presence of new physics, the expressions for CP asymmetries to the leading order are modified as follows
| (24) |
and the mixing-induced CP asymmetry is given by
Note that in this case is not affected as the new physics contributions to charged and neutral modes cancel. The difference between two direct CP asymmetries is not affected either. In the presence of new physics, the weak phase extracted from Eq.(18) will be an effective one denoted by , and is related to the true value of through
| (25) | |||||
Thus the deviation of the effective value from the true is a measure of the new physics effects and which can be used to extract new physics parameters or distinguish different new physics models Zhou and Wu (2000). The true value of can be obtained from other measurements such as through Atwood et al. (1997) or from global CKM fits. The new physics effects will be enhanced if the deviation of from unity is tiny. As the current data give a central value of , the effective is very sensitive to new physics. If the true value of is indeed around , for typical values of and taken from Eq.(19) and , the enhancement factor is about . As a consequence, significant difference of a few tens degree between and is possible for .
It has been argued recently that in general the new physics will not generate significant relative strong phases as the strong phases mainly originate from the long-distance rescatterings of the final states while new physics contributes only to short-distant partDatta and London (2004). In the case that the new physics strong phase is negligible, the combined new physics parameter can be directly extracted. As an illustration, we take the central value of and from Eq.(19) and in the range, which gives
| (26) |
It follows that for a large , the current data marginally agree with the SM, and the new physics receives only an upper bound.
For a smaller value of and in Eq.(20), a positive signal of nonzero is found
| (27) |
which demonstrates that the mode provide a good avenue to explore new physics contributions. Needless to say that the current experimental status is not conclusive yet and one can not draw a robust conclusion on the presence of new physics. The advantage of using Eq.(25) in modes to probe new physics is that besides new physics parameters the difference between the effective and the true only depends on the hadronic parameters and . The knowledge of the tree-penguin ratio and are not needed. Comparing with probing new physics through , although the flavor structure in is simpler, the tree-penguin interference can not be avoid and one has to combine it with where additional assumptions on new physics effects in penguin have to be madeLondon et al. (2005).
V conclusion
In summary, we have present a method for an independent determination of the weak phase from alone, which makes use of measurements of all the direct and mixing-induced CP asymmetries. The value of extracted from may be compared with the ones from other modes. The possible discrepancy may help us to understand the current puzzles in charmless decays. We have taken two sets of the ratio as inputs to analysis the implications of the recent data on modes. One is from from global , and fits which leads to a in agreement with the SM fit value. The other is from QCD factorization calculations which makes around . Within the SM, it implies that a large is independently favored in modes. New physics beyond SM can be singled out if obtained in modes is significantly different than the ones from other decay modes or other approaches. The value of obtained from are found to be sensitive to new physics contributions and can be used to extract new physics parameters if the new physics does not carry significant new strong phases.
References
- Charles et al. (2004) J. Charles et al. (CKMfitter Group) (2004), eprint hep-ph/0406184.
- Bona et al. (2005) M. Bona et al. (UTfit) (2005), eprint hep-ph/0501199.
- Beneke et al. (2001) M. Beneke, G. Buchalla, M. Neubert, and C. T. Sachrajda, Nucl. Phys. B606, 245 (2001), eprint hep-ph/0104110.
- Beneke and Neubert (2003) M. Beneke and M. Neubert, Nucl. Phys. B675, 333 (2003), eprint hep-ph/0308039.
- Keum et al. (2001) Y.-Y. Keum, H.-n. Li, and A. I. Sanda, Phys. Lett. B504, 6 (2001), eprint hep-ph/0004004.
- Keum (2002) Y.-Y. Keum (2002), eprint [http://arXiv.org/abs]hep-ph/0209208.
- Keum and Sanda (2003) Y. Y. Keum and A. I. Sanda, Phys. Rev. D67, 054009 (2003), eprint hep-ph/0209014.
- Bauer et al. (2004a) C. W. Bauer, D. Pirjol, I. Z. Rothstein, and I. W. Stewart, Phys. Rev. D70, 054015 (2004a), eprint hep-ph/0401188.
- Bauer et al. (2004b) C. W. Bauer, I. Z. Rothstein, and I. W. Stewart (2004b), eprint hep-ph/0412120.
- Grossman et al. (2005) Y. Grossman, A. Hocker, Z. Ligeti, and D. Pirjol (2005), eprint hep-ph/0506228.
- Zeppenfeld (1981) D. Zeppenfeld, Zeit. Phys. C8, 77 (1981).
- Savage and Wise (1989) M. J. Savage and M. B. Wise, Nucl. Phys. B326, 15 (1989).
- Chau et al. (1991) L.-L. Chau, H.-Y. Cheng, W. K. Sze, H. Yao, and B. Tseng, Phys. Rev. D43, 2176 (1991).
- Gronau et al. (1994) M. Gronau, O. F. Hernandez, D. London, and J. L. Rosner, Phys. Rev. D50, 4529 (1994), eprint hep-ph/9404283.
- Gronau et al. (1995) M. Gronau, O. F. Hernandez, and London, Phys. Rev. D52, 6374 (1995), eprint hep-ph/9504327.
- Gronau and Rosner (1996) M. Gronau and J. L. Rosner, Phys. Rev. D53, 2516 (1996), eprint hep-ph/9509325.
- Gronau and Rosner (2002) M. Gronau and J. L. Rosner, Phys. Rev. D66, 053003 (2002), eprint hep-ph/0205323.
- Chiang (2005) C.-W. Chiang (2005), eprint hep-ph/0502183.
- Wu and Zhou (2000a) Y.-L. Wu and Y.-F. Zhou, Phys. Rev. D62, 036007 (2000a), eprint [http://arXiv.org/abs]hep-ph/0002227.
- Zhou et al. (2001) Y. F. Zhou, Y. L. Wu, J. N. Ng, and C. Q. Geng, Phys. Rev. D63, 054011 (2001), eprint [http://arXiv.org/abs]hep-ph/0006225.
- He et al. (2001) X. G. He et al., Phys. Rev. D64, 034002 (2001), eprint hep-ph/0011337.
- Ali et al. (2004) A. Ali, E. Lunghi, and A. Y. Parkhomenko, Eur. Phys. J. C36, 183 (2004), eprint hep-ph/0403275.
- Chiang et al. (2004a) C.-W. Chiang, M. Gronau, J. L. Rosner, and D. A. Suprun, Phys. Rev. D70, 034020 (2004a), eprint hep-ph/0404073.
- Wu and Zhou (2005a) Y.-L. Wu and Y.-F. Zhou, Phys. Rev. D71, 021701 (2005a), eprint hep-ph/0409221.
- Wu and Zhou (2005b) Y.-L. Wu and Y.-F. Zhou, Phys. Rev. D72, 034037 (2005b), eprint hep-ph/0503077.
- Buras et al. (2004a) A. J. Buras, R. Fleischer, S. Recksiegel, and F. Schwab, Phys. Rev. Lett. 92, 101804 (2004a), eprint hep-ph/0312259.
- Buras et al. (2004b) A. J. Buras, R. Fleischer, S. Recksiegel, and F. Schwab, Nucl. Phys. B697, 133 (2004b), eprint hep-ph/0402112.
- Buras et al. (2004c) A. J. Buras, R. Fleischer, S. Recksiegel, and F. Schwab (2004c), eprint hep-ph/0410407.
- Yoshikawa (2003) T. Yoshikawa, Phys. Rev. D68, 054023 (2003), eprint hep-ph/0306147.
- Mishima and Yoshikawa (2004) S. Mishima and T. Yoshikawa, Phys. Rev. D70, 094024 (2004), eprint hep-ph/0408090.
- Buchalla et al. (2005) G. Buchalla, G. Hiller, Y. Nir, and G. Raz (2005), eprint hep-ph/0503151.
- Beneke (2005) M. Beneke (2005), eprint hep-ph/0505075.
- Kim et al. (2005a) C. S. Kim, Y. J. Kwon, J. Lee, and T. Yoshikawa (2005a), eprint hep-ph/0509015.
- He and McKellar (2004) X.-G. He and B. H. J. McKellar (2004), eprint hep-ph/0410098.
- Charng and Li (2004) Y.-Y. Charng and H.-n. Li (2004), eprint hep-ph/0410005.
- Kim et al. (2005b) C. S. Kim, S. Oh, and C. Yu (2005b), eprint hep-ph/0505060.
- Neubert (1999) M. Neubert, JHEP 02, 014 (1999), eprint [http://arXiv.org/abs]hep-ph/9812396.
- Gronau and Rosner (2003) M. Gronau and J. L. Rosner, Phys. Lett. B572, 43 (2003), eprint hep-ph/0307095.
- Imbeault et al. (2004) M. Imbeault, A. S.-L. Lemerle, V. Page, and D. London, Phys. Rev. Lett. 92, 081801 (2004), eprint hep-ph/0309061.
- Baek et al. (2005) S. Baek, P. Hamel, D. London, A. Datta, and D. A. Suprun, Phys. Rev. D71, 057502 (2005), eprint hep-ph/0412086.
- Dighe (1996) A. S. Dighe, Phys. Rev. D54, 2067 (1996), eprint hep-ph/9509287.
- Dighe et al. (1996) A. S. Dighe, M. Gronau, and J. L. Rosner, Phys. Lett. B367, 357 (1996), eprint hep-ph/9509428.
- Dighe et al. (1997) A. S. Dighe, M. Gronau, and J. L. Rosner, Phys. Rev. Lett. 79, 4333 (1997), eprint hep-ph/9707521.
- Fu et al. (2004) H.-K. Fu, X.-G. He, and Y.-K. Hsiao, Phys. Rev. D69, 074002 (2004), eprint hep-ph/0304242.
- Chiang et al. (2003) C.-W. Chiang, Z.-m. Luo, and J. L. Rosner, Phys. Rev. D67, 014001 (2003), eprint hep-ph/0209272.
- Wu et al. (2005) Y.-L. Wu, M. Zhong, and Y.-F. Zhou, Eur. Phys. J. C42, 391 (2005), eprint hep-ph/0405080.
- Leutwyler (1998) H. Leutwyler, Nucl. Phys. Proc. Suppl. 64, 223 (1998), eprint [http://arXiv.org/abs]hep-ph/9709408.
- Feldmann (2000) T. Feldmann, Int. J. Mod. Phys. A15, 159 (2000), eprint [http://arXiv.org/abs]hep-ph/9907491.
- Aubert et al. (2005) B. Aubert et al. (BaBar), Phys. Rev. Lett. 94, 191802 (2005), eprint hep-ex/0502017.
- Abe et al. (2004) K. Abe et al. (BELLE) (2004), eprint hep-ex/0409049.
- (51) Hevay flavor average group,http://www.slac.stanford.edu/xorg/hfag/rare.
- (52) M.Gronau and J.L.Rosner, Phys. Rev. D 53, 2516 (1996). A.S.Dighe, M.Gronau and J.L.Rosner,Phys. Lett. B 367, 357 (1996). [Erratum-ibid. B 377, 325 (1996)] A.S.Dighe, M.Gronau and J.L.Rosner,Phys. Lett. B 367, 357 (1996). [Erratum-ibid. B 377, 325 (1996)] A.S.Dighe, M.Gronau and J.L.Rosner,Phys. Rev. Lett. 79, 4333 (1997). A.Ali and C.Greub,Phys. Rev. D 57, 2996 (1998). M.Gronau and J.L.Rosner, Phys. Rev. D 61, 073008 (2000). C.W.Chiang and J.L.Rosner, Phys. Rev. D 65, 074035 (2002)[Erratum-ibid. D 68, 039902 (2003)]. H.Fritzsch, Phys. Lett. B 415, 83 (1997). H. Fritzsch and Y. F. Zhou,Phys. Rev. D 68, 034015 (2003).
- Beneke and Neubert (2002) M. Beneke and M. Neubert (2002), eprint [http://arXiv.org/abs]hep-ph/0210085.
- Aubert et al. (2002) B. Aubert et al. (BABAR) (2002), eprint [http://arXiv.org/abs]hep-ex/0207042.
- Abe et al. (2002) K. Abe et al. (Belle) (2002), eprint [http://arXiv.org/abs]hep-ex/0207098.
- Wu and Zhou (2003) Y.-L. Wu and Y.-F. Zhou, Eur. Phys. J. Direct C5, 014 (2003), eprint hep-ph/0210367.
- Lipkin (1991) H. J. Lipkin, Phys. Lett. B254, 247 (1991).
- Hewett et al. (2004) e. . Hewett, J. et al. (2004), eprint hep-ph/0503261.
- Chiang et al. (2004b) C.-W. Chiang, M. Gronau, Z. Luo, J. L. Rosner, and D. A. Suprun, Phys. Rev. D69, 034001 (2004b), eprint hep-ph/0307395.
- Beneke and Jager (2005) M. Beneke and S. Jager (2005), eprint hep-ph/0512351.
- Gronau and Rosner (2005) M. Gronau and J. L. Rosner, Phys. Rev. D71, 074019 (2005), eprint hep-ph/0503131.
- Ciuchini et al. (1997) M. Ciuchini, E. Franco, G. Martinelli, and L. Silvestrini, Nucl. Phys. B501, 271 (1997), eprint hep-ph/9703353.
- Ciuchini et al. (2001) M. Ciuchini, E. Franco, G. Martinelli, M. Pierini, and L. Silvestrini, Phys. Lett. B515, 33 (2001), eprint hep-ph/0104126.
- Barshay et al. (2004) S. Barshay, G. Kreyerhoff, and L. M. Sehgal, Phys. Lett. B595, 318 (2004), eprint hep-ph/0405012.
- Cheng et al. (2005) H.-Y. Cheng, C.-K. Chua, and A. Soni, Phys. Rev. D71, 014030 (2005), eprint hep-ph/0409317.
- Kagan and Petrov (1997) A. L. Kagan and A. A. Petrov (1997), eprint [http://arXiv.org/abs]hep-ph/9707354.
- (67) See. e.g T. P. Cheng and M. Sher,Phys. Rev. D 35, 3484 (1987), L. Wolfenstein and Y. L. Wu,Phys. Rev. Lett. 73, 2809 (1994), Y. L. Wu and L. Wolfenstein,Phys. Rev. Lett. 73, 1762 (1994),.
- Wu and Zhou (2000b) Y. L. Wu and Y. F. Zhou, Phys. Rev. D61, 096001 (2000b), eprint hep-ph/9906313.
- Wu and Zhou (2001) Y.-L. Wu and Y.-F. Zhou, Phys. Rev. D64, 115018 (2001), eprint hep-ph/0104056.
- Wu and Zhou (2004) Y.-L. Wu and Y.-F. Zhou, Eur. Phys. J. C36, 89 (2004), eprint hep-ph/0403252.
- Barger et al. (2004) V. Barger, C.-W. Chiang, P. Langacker, and H.-S. Lee, Phys. Lett. B598, 218 (2004), eprint hep-ph/0406126.
- Zhou and Wu (2000) Y.-F. Zhou and Y.-L. Wu, Mod. Phys. Lett. A15, 185 (2000), eprint hep-ph/0001106.
- Atwood et al. (1997) D. Atwood, I. Dunietz, and A. Soni, Phys. Rev. Lett. 78, 3257 (1997), eprint hep-ph/9612433.
- Datta and London (2004) A. Datta and D. London, Phys. Lett. B595, 453 (2004), eprint hep-ph/0404130.
- London et al. (2005) D. London, J. Matias, and J. Virto, Phys. Rev. D71, 014024 (2005), eprint hep-ph/0410011.