Transition from Baryonic to Mesonic
Freeze-Out
Abstract
The recently discovered sharp peak in the ratio in relativistic heavy-ion collisions is discussed in the framework of the statistical model. In this model a rapid change is expected as the hadronic gas undergoes a transition from a baryon-dominated to a meson-dominated gas. The transition occurs at a temperature = 140 MeV and baryon chemical potential = 410 MeV corresponding to an incident energy of = 8.2 GeV. The maximum in the ratio is well reproduced by the statistical model, but the change in the ratio is much less pronounced than the one observed by the NA49 collaboration. The calculated smooth increase of the ratio and the shape of the and ratios exhibiting maxima at different incident energies is consistent with the presently available experimental data. We conclude that the measured particle ratios with deviations agree with a hadronic freeze-out scenario. These deviations seem to occur just in the transition from baryon-dominated to meson-dominated freeze-out.
, , ,
The NA49 Collaboration has recently performed a series of measurements of Pb-Pb collisions at 20, 30, 40, 80 and 158 AGeV beam energies [1, 2, 3]. When these results are combined with measurements at lower beam energies from the AGS [4, 5, 6, 7, 8, 9] they reveal an unusually sharp variation with beam energy in the , with , and ratios. Such a strong variation with energy does not occur in pp collisions and therefore indicates a major difference in heavy-ion collisions. This transition has been referred to in Ref. [1] as the “horn”. A strong variation with energy of the ratio has been predicted on the basis of arguments put forward in [10]. It has also been suggested recently in Ref. [11] that this is a signal of the special critical point of the QCD phase diagram [12, 13, 14] at high baryon density. In this paper we explore another, less spectacular, possibility for the origin of the sharp maximum, namely as being due to the transition from a baryon-dominated to a meson-dominated hadronic gas. The distinction being based on whether the entropy of the hadronic gas is dominated by baryons or by mesons. For this purpose we study various quantities along the freeze-out curve [15] as a function of .
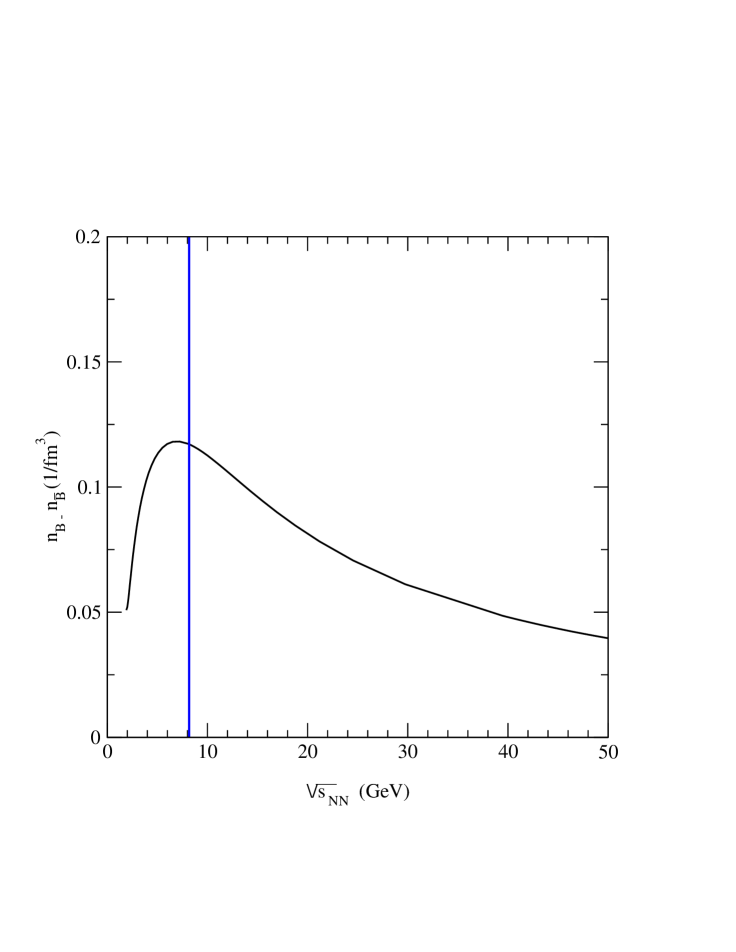
In the statistical model a steep rise at low energies and a subsequent flattening off leading to a mild maximum in the ratio, was predicted many years ago [16, 17, 18]. The sharpness of the observed peak therefore comes as a surprise. On the other hand, a sharp peak in the ratio was predicted by the statistical model [18] and is in good agreement with the data. While the statistical model cannot explain the sharpness of the peak in the ratio, there are nevertheless several phenomena, giving rise to the rapid change, which warrant a closer look at the model. In Fig. 1 we show the net baryon density calculated along the chemical freeze-out curve [15] as a function of . This curve shows a clear maximum with the net baryon density decreasing rapidly towards higher energies.
To get a better estimate of the statistical parameters in the transition region we show in Fig. 2 the entropy density as a function of beam energy following the freeze-out curve given in [15]. The separate contribution of mesons and of baryons to the total entropy is also shown in this figure. There is a clear change of baryon to meson dominance at = 8.2 GeV. Above this value the entropy is carried mainly by mesonic degrees of freedom. It is remarkable that the entropy density divided by is constant over the entire freeze-out curve, except for the low-energy region corresponding to the SIS energy region. The line denoting the transition from a baryon-dominated to a meson-dominated hadron gas is shown in Fig. 3. This line crosses the freeze-out curve at a temperature of MeV, when the baryon chemical potential equals = 410 MeV. The corresponding invariant energy is = 8.2 GeV.
The strong decrease in the net baryon density seen in Fig. 1 is due to the fact that low energies are characterized by a very low multiplicity of mesons and, correspondingly, a very large baryon-to-meson ratio. As a consequence, the baryon chemical potential is also very large. As the beam energy is increased, meson production increases and the baryon chemical potential decreases. The number of strange baryons produced in heavy-ion collisions at different collision energies will follow the net baryon density since a large baryon chemical potential will also enhance the number of hyperons.
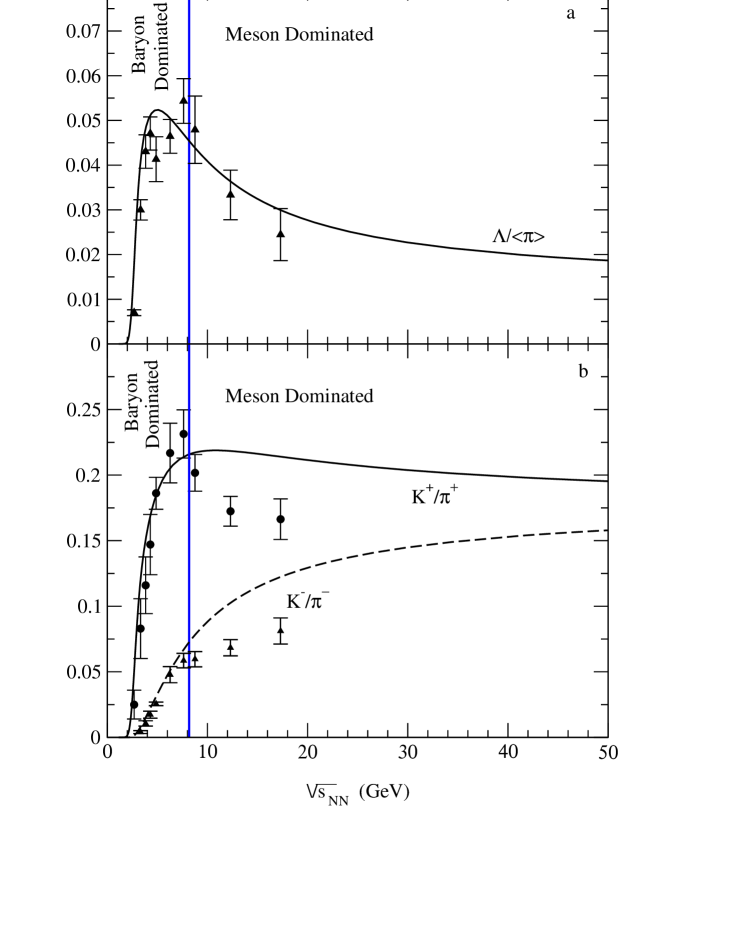
The corresponding ratio is shown in Fig. 4. As is well-known [19, 20], the statistical model description leads to a mild maximum in this ratio which does not reproduce the so-called “horn” observed by the NA49 collaboration [1]. The observed deviations at the highest SPS energy have been interpreted as a lack of full chemical equilibrium in the strangeness sector, leading to a strangeness suppression factor, , deviating from its equilibrium value by about thirty percent. Detailed fits using the statistical model in the region of the “horn” show rapid variations in [20] which do not lend themselves to any interpretation. There is no corresponding peak in the ratio because the production of is not tied to that of baryons. As the relative number of baryons decreases with increasing energy, there is no corresponding decrease in the number of as is the case with as these must be balanced by strange baryons.
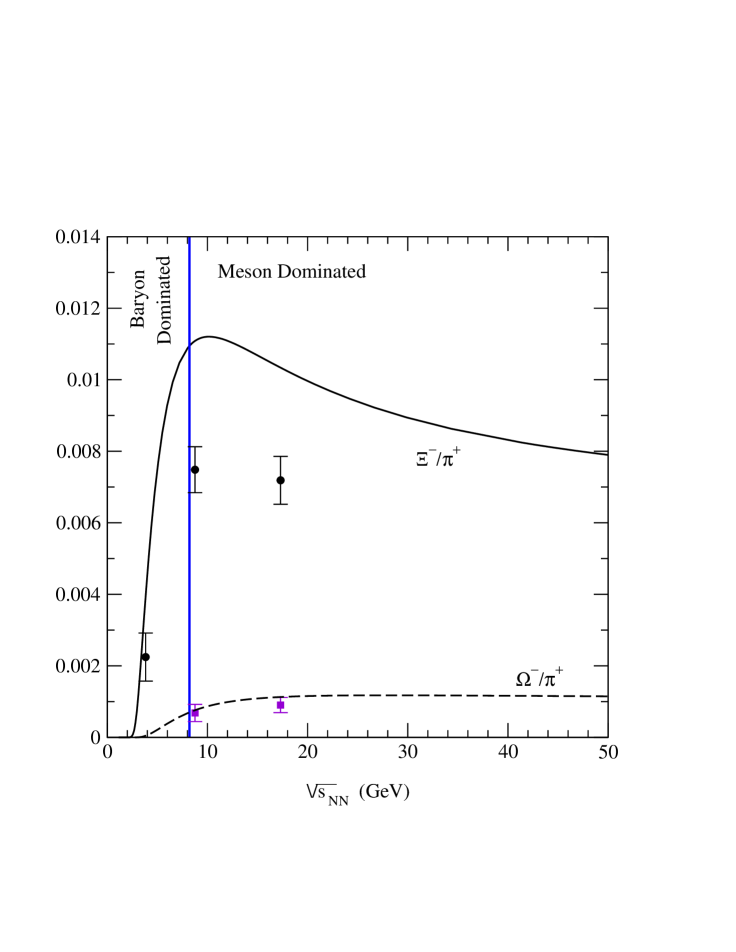
It is worth noting that the maxima in the ratios for multi-strange baryons occur at ever higher beam energies. This can be seen clearly in Fig. 5 for the ratio which peaks at a higher value of the beam energy. The ratio also shows a (very weak) maximum, as can be seen in Fig. 5. The higher the strangeness content of the baryon, the higher in energy is the maximum. This behavior is due to a combination of the facts that strangeness has to be balanced, the baryon chemical potential decreases rapidly with energy and the multi-strange baryons have successively higher thresholds. The values are listed in Table 1.
| Ratio | Maximum at | Maximum |
|---|---|---|
| (GeV) | Value | |
| 5.1 | 0.052 | |
| 10.2 | 0.011 | |
| 10.8 | 0.22 | |
| 27.0 | 0.0012 |
It is to be expected that if these maxima do not all occur at the same temperature, i.e. at the same beam energy, then the case for a phase transition is not very strong. The observed behavior seems to be governed by properties of the hadron gas. More detailed experimental studies of multi-strange hadrons will allow the verification or disproval of the trends shown in this paper. It should be clear that the ratio is very broad and shallow and it will be difficult to find a maximum experimentally.
In conclusion, while the statistical model cannot explain the sharpness of the peak in the ratio, its position corresponds precisely to a transition from a baryon-dominated to a meson-dominated hadronic gas. This transition occurs at a temperature 140 MeV, a baryon chemical potential 410 MeV and an energy 8.2 GeV. In the statistical model this transition leads to a sharp peak in the ratio, and to moderate peaks in the , and ratios. Furthermore, these peaks are at different energies in the statistical model. The statistical model predicts that the maxima in the , and occur at increasing beam energies.
If the change in properties of the above excitation functions were associated with a genuine deconfinement phase transition one would expect these changes to occur at the same beam energy. It is clear that more data are needed to clarify the precise nature of the sharp variation observed by the NA49 collaboration.
Acknowledgments
We thank C. Blume for his help with the NA49 data. We acknowledge the support of the German Bundesministerium für Bildung und Forschung (BMBF), the Polish State Committee for Scientific Research (KBN) grant 2P03 (06925), the National Research Foundation (NRF, Pretoria) and the URC of the University of Cape Town.
References
- [1] M. Gaździcki, (NA49 Collaboration), J. Phys. G: Nucl. Part. Phys. 30 (2004) S701.
- [2] S.V. Afanasiev et al., (NA49 Collaboration), Phys. Rev. C66 (2002) 054902.
- [3] T. Anticic et al., Phys. Rev. Lett. 93 (2004) 022302; C. Blume et al., SQM04 Proceedings, to appear in J. Phys. G.
- [4] L. Ahle et al., (E802 Collaboration), Phys. Rev. C57 (1998) 466.
- [5] L. Ahle et al., (E802 Collaboration), Phys. Rev. C60 (1999) 044904 and 064901.
- [6] L. Ahle et al., (E866/E917 Collaboration), Phys. Lett. B490 (2000) 53.
- [7] S. Albergo et al., Phys. Rev. Lett. 88 (2002) 062301.
- [8] S. Ahmad et al., Phys. Lett. B381 (1996) 3.
- [9] J. Klay et al., (E895 Collaboration), Phys. Rev. C68 (2003) 054905.
- [10] M. Gaździcki and M.I. Gorenstein, Acta Phys. Polonica B 30 (1999) 2705.
- [11] R. Stock, J. Phys. G: Nucl. Part. Phys. 30 (2004) S633.
-
[12]
M.G. Alford, K. Rajagopal and F. Wilczek, Phys. Lett. B442 (1998) 247;
Y.H. Atta and T. Ikeda, Phys. Rev. D 67 (2003) 014028. -
[13]
Z. Fodor and S.D. Katz, J. High Energy Phys. JHEP03 (2002) 014;
hep-lat/0402006. - [14] F. Karsch, K. Redlich and A. Tawfik, Phys. Lett. B 571 (2003) 67.
- [15] J. Cleymans and K. Redlich, Phys. Rev. Lett. 81 (1998) 5284.
- [16] J. Cleymans, H. Oeschler and K. Redlich, Phys. Rev. C59 (1999) 1663.
- [17] F. Becattini, J. Cleymans, A. Keränen, E. Suhonen, K. Redlich, Phys. Rev. C64 (2001) 024901.
- [18] P. Braun-Munzinger, J. Cleymans, H. Oeschler, K. Redlich, Nucl. Phys. A697 (2002) 902.
- [19] P. Braun-Munzinger, K. Redlich and J. Stachel, nucl-th/0304013 in Quark-Gluon Plasma 3, (eds.) R. Hwa and X.N. Wang.
- [20] F. Becattini, M. Gaździcki, A. Keränen, J. Manninen, R. Stock, Phys. Rev. C69 (2004) 024905.
- [21] S. Wheaton and J. Cleymans, THERMUS - A Thermal Model Package for ROOT, hep-ph/0407174.
-
[22]
C. Meurer et al., J. Phys. G 30 (2004) S14;
S.V. Afanasiev et al., Phys. Lett. B358 (2002) 275. - [23] P. Chung et al., Phys. Rev. Lett. 91 (2003) 202301.
- [24] C. Alt et al., nucl-ex/0409004.