Double Extensive Air Shower Induced by Ultra-High Energy Cosmic Tau-Neutrino
Abstract
We investigate the possibility of detecting ultra-high energy cosmic tau-neutrinos by means of a process involving a double extensive air shower, the so-called Double-Bang Phenomenon. In this process a primary tau-neutrino interacts with an atmospheric quark creating a first hadronic shower and a tau-lepton, which subsequently decays creating a second cascade. The number of these events strongly depends on the flux of tau-neutrinos arriving at the Earth’s atmosphere and can be used to test some theoretical models related to the production of ultra-high energy tau-neutrinos. We estimate the potential of the fluorescence detector of the Pierre Auger Observatory to observe Double-Bang events. We conclude that for tau-neutrinos with energies ranging from EeV to EeV the number of detected events vary from hundreds in a year to only few events in hundreds of years.
pacs:
13.15.+g, 96.40.PqI Introduction
It is believed that ultra-high energy cosmic neutrinos may play an important role to explain the origin of cosmic rays with energies beyond the GZK limit of few times eV Greisen (1966); Zatsepin and Kuz’min (1966), once that neutrinos hardly interact with cosmic microwave background or intergalactic magnetic fields, keeping therefore its original energy and direction of propagation. Even if they have masses or magnetic moments, or travel distances of the order of the visible universe, those characteristics do not change very much. Possible sources of these ultra-high energy neutrinos, like Active Galactic Nuclei and Gamma Ray Bursts, are typically located at thousands of Mpc Halzen and Saltzberg (1998); Halzen (1998). Considering that neutrinos come from pions produced via the process Halzen (1998), that there is an additional flux due to escaping neutrons and that about 10% of the neutrino flux is due to proton-proton () interactions, the proportionality of different neutrino flavors result: Learned and Pakvasa (1995). Nevertheless, observations of solar Holanda and Smirnov (2002) and atmospheric Fogli et al. (2001) neutrinos present compelling evidence of neutrino flavor oscillations. Such oscillations have been independently confirmed by terrestrial experiments. KamLAND Eguchi et al. (2003) observed disappearance confirming (assuming CPT invariance) what has been seen in solar neutrino detections and K2K Ahn et al. (2001, 2003) observed conversion compatible with what has been detected in atmospheric neutrino observations.
In order to understand these experimental results by means of neutrino oscillations, two scales of mass squared differences and large mixing angles have to be invoked. For solar and KamLAND observations, eV2 and . And for atmospheric neutrino and K2K, eV2 and . Moreover LSND experiment Athanassopoulos et al. (1995) may have observed transition which can be also explained by neutrino oscillations with a large mass scale, eV2. Such results will soon be checked by MiniBooNE Bazarko (2002). These scales require four neutrino oscillation framework (or three, if LSND results will not be confirmed by MiniBooNE experiment) which imply, for ultra-high energies of the order 1 EeV or higher, oscillation lengths much smaller than typical distances from the sources of ultra-high energy neutrinos. Consequently when neutrino flavor oscillations are taken into consideration the flavor proportion will be modified to . Therefore one expects a considerable number of tau-neutrinos arriving at the Earth.
In this paper we investigate the possibility of detecting ultra-high energy cosmic tau-neutrinos by means of a process in which a double Extensive Air Shower (EAS) is identified, the so-called Double-Bang (DB) Phenomenon. In that kind of event a tau-neutrino interact with a quark via charged current creating one cascade of hadronic particles and a lepton tau which subsequently decays producing a second cascade. DB Phenomenon was first proposed for detectors where the neutrino energy should be around PeV Learned and Pakvasa (1995). It does not happen with neutrinos different from tau. The electron generated by an electron-neutrino immediately interacts after being created and the muon generated by a muon-neutrino, on the other hand, travel a much longer distance than the size of the detector before interacting or even decaying. So we do not have DB events from them.
In order to identify a DB Phenomenon we have to look for two Extensive Air Showers (EAS) in the same direction of propagation inside the field of view (f.o.v.) of the detector, i.e., in the physical space around the detector in which an event can be triggered.
In the Pierre Auger Observatory aug (1997), a hybrid detection technique will be used to make a detailed study of cosmic rays at energies mainly around 10 EeV and beyond. The two techniques consist of an array of detectors spread on the ground (the ground array detector also called surface detector) and an optical detector used to probe longitudinal development of EAS by recording the fluorescence light emitted by the excited nitrogen molecules of the Earth’s atmosphere. It has been shown that the Auger Observatory can detect atmospheric near-horizontal air showers generated by neutrinos with the surface detector Parente and Zas ; Capelle et al. (1998); Wilczyński (2000); Ave et al. ; Bertou et al. ; Athar (2003). We concentrate here on a different approach to study the possibility of detecting events induced by ultra-high energy tau-neutrinos, the DB events, using the fluorescence detector of that observatory.
We conclude that the features of the Pierre Auger Fluorescence Detector favor the observation of DB events with tau-neutrino energies varying from EeV) to EeV), despite the low efficiency of the fluorescence detector at energies smaller than 1 EeV. We estimate the number of DB events observed in the fluorescence detector varying from hundreds in a year to few events in hundreds of years depending mainly on the primary tau-neutrino flux.
This paper is organized in the following way: Section II has a brief introduction to the DB Phenomenon. Section II.1 shows some results of the DB events simulated and Section II.2 describe how we calculate the number of events in the Pierre Auger Fluorescence Detector. Section III has the number of events calculated for different models of ultra-high energy neutrino flux and discuss how could we take some physical information from that. The conclusions are in Section IV, in which we discuss also the background events.
II The Ultra-High Energy Double-Bang and the Auger Observatory
Studying the characteristics of the fluorescence detector, such as its efficiency and f.o.v. and the characteristics of the DB events generated by ultra-high energy tau-neutrinos, one can estimate the rate of that kind of event expected in the Auger Observatory.
Fig. 1 shows a schematic view of an ultra-high energy DB with the detector position and the time integrated development of the two showers, one created by the high-energy tau-neutrino interacting with a nucleon in the atmosphere and the other created by the decay of the tau generated in the first interaction of the tau-neutrino. The f.o.v. of the fluorescence detector will be comprehended between angles near the horizontal () and , and a radius of approximately 30 km. The maximal height from where the DB can be triggered by the fluorescence detector is h and is its projection in the DB propagation axis. The zenith angle is represented by .
We considered only showers moving away from the detector since, in the opposite case, a large amount of Čerenkov light arrives together with the fluorescence light, spoiling a precise data analysis Bellido (1998).
The total amount of light emitted by the first cascade is related to the energy transfered to the quark at the moment of the first tau-neutrino interaction, which we will define as . The neutrino energy is the sum of the tau energy and , i. e., . For charged current interactions above 0.1 EeV, approximately 20% of the neutrino energy is transfered to the quark Quigg et al. (1986). The second cascade, resulting from the tau decay, carries an energy of approximately and is visible when the tau decay is hadronic, which happens with a branching ratio of around 64% Groom et al. (2000).
Therefore, very roughly, we have and and the relation between and is given by: . The distance traveled by the tau before decaying in laboratory frame is where and is the mean life time of the tau, that has an error of approximately 0.4% Groom et al. (2000).
II.1 Simulations
In order to infer the possibility of observing DB events in atmosphere and detecting them in the Pierre Auger Fluorescence Detector, we first simulate the longitudinal development of the showers. For simplicity, we numerically simulate DB events using protons as primary particles. We create two separated showers using the relations of energy () and distance () between the two EAS of a DB in the way presented in the previous section. In fact, it has been argued that it is difficult to distinguish if a ultra-high energy EAS was created by a proton or a neutrino Bahcall and Ostriker (1996); Jain et al. , at least when the cross section is extrapolated from the Standard Model. An important difference is the probability of interaction in the atmosphere, that can be smaller for a vertical neutrino than for a proton. There are also some works that study the differences between the longitudinal development of EAS generated by protons, heavier nuclei and different neutrino flavors Jain et al. ; Ambrosio et al. (2003). In reference Ambrosio et al. (2003) they use CORSIKA+Herwig Monte Carlo simulations to have electron and muon-neutrinos as primary particles, but not tau-neutrinos. So the simulations we have made to study DB events still are a good approximation. We discuss how to distinguish events that could masquerade tau-neutrino induced DB events in the conclusions.
Two different approaches can be taken to evaluate the longitudinal development of a DB. At first we used Gaisser-Hillas parameterization Gaisser and Hillas (1977). This method, nevertheless is not reliable to determine the depth of the shower maximum and the point of first interaction, specially for arrival angles larger than . At this point, the CORSIKA simulation seems to be a good approach Moura Jr. (2001). Here we use its version 6.00.
Fig. 2 and Fig. 3 present the main results of the simulations with the CORSIKA program. They show the longitudinal development of the DB for different incident angles chosen among the simulated events. Table 1 and Table 2 show the parameters used in the simulations. In these tables, the points of first and second interactions are chosen fixed parameters. The distance between the first and second interactions, as we pointed out above, is in accordance with the tau mean decay length () in the laboratory frame. Because of the small cross section of the neutrino, the probability of interaction in the top of the atmosphere is about the same for any point.
| 111Zenith angle measuring the shower incident axis inclination | 1st. int.222Altitude of the first interaction in the atmosphere | 333Projection in the vertical axis of the distance the tau runs before it decays | 2nd. int.444Altitude where the tau decays | h555Maximum altitude from where the fluorescence light of the DB can be detected, for km (see Fig. 1) | h (g/cm2)666Same as h, but in units of g/cm2, also called atmospheric depth | 777Projection of h in the DB propagation axis |
| 24.3 | 14.3 | 10 | 11 | 231 | 15.6 | |
| 19.6 | 11.6 | 8 | 9.5 | 291 | 16.6 | |
| 15.5 | 8.5 | 7 | 7.7 | 377 | 18.2 | |
| 10.2 | 5.2 | 5 | 5.5 | 515 | 21.3 |
| 1st. int. | 2nd. int. | h | h (g/cm2) | |||
|---|---|---|---|---|---|---|
| 33.6 | 28.6 | 5 | 11 | 231 | 15.6 | |
| 28.2 | 23.2 | 5 | 9.5 | 291 | 16.6 | |
| 22.1 | 17.1 | 5 | 7.7 | 377 | 18.2 | |
| 13.5 | 10.5 | 3 | 5.5 | 515 | 21.3 |
II.2 The number of events
To calculate the possible number of events in the Pierre Auger Fluorescence Detector, first consider for simplicity one detector with a site seeing of 360o. Then we can write the equation:
| (1) |
where,
| (2) |
is the probability of detection of a DB in the Auger Observatory, given by the product of the probability of the tau-neutrino to interact in the atmosphere and the probability of the DB to be triggered by the fluorescence detector. is the flux of high-energy neutrinos depending on the model of the extragalactic source of high-energy cosmic rays. , , and are the energy of the incident neutrino, area over the f.o.v. of the detector, time of data acquisition and solid angle around the detector, respectively.
The interaction probability is given approximately by:
| (3) |
where is the average cross section of the neutrino-nucleon interaction and , the average total number of nucleons per squared centimeter at the interaction point in the atmosphere. , where is the Avogadro’s number and is the atmospheric slant depth at the neutrino-nucleon interaction point.
Considering the Earth’s curvature, the slant depth can be approximately written as:
| (4) |
where is the path along the arrival direction from infinity until the interaction point in the atmosphere, is the atmospheric density, the vertical height, is the distance between the interaction point and the point toward the particle goes through on Earth (the slant height), and , the zenith angle. The atmospheric depth as a function of the zenith angle is shown in Fig. 4.
As the cross section of neutrinos with ultra-high energies is unknown, usually one adopts the extrapolation of parton distribution functions and Standard Model parameters far beyond the reach of experimental data. In this way, one can estimate a value for the cross section of the neutrino-nucleon interaction of about cm2, for energies around 1 EeV. Some authors say that this extrapolation gives a neutrino-nucleon cross section that is too high Kusenko and Weiler but others use models that increase this same cross section to typical hadronic cross section values Jain et al. . In this work we use the extrapolation of the Standard Model cross section.
The trigger probability is given by:
| (5) |
where is the fraction of the time the fluorescence detector will work ( because the fluorescence detector can only operate in clear moonless nights), is the hadronic branching ratio of tau decay (), is the probability of the DB to be seen by the detector and is the efficiency of the detector.
We define the probability of the DB to be seen by the fluorescence detector as:
| (6) | |||||
where, as we have seen in Section II, is the distance traveled by the tau in laboratory frame and , as can be seen in the Fig. 1, is the size of the shower axis inside the f.o.v. of the detector. We made a rough approximation to account only for the showers moving away from the detector, so that . Then we measure where the vertical plane containing the shower axis passes through the center of the fluorescence detector.
The efficiency is the convolution of the energy efficiency and the efficiency depending on distance . As the fluorescence detector has no measurement of yet, but only expectations based on simulations, we constructed one function based on simulations that grows logarithmically from 0 to 1 in the interval of neutrino incident energy 0.3 88 Barbosa (2000). if the energy is lower than the energies in this range and if the energy is higher than that. is a Gaussian distribution centered at the point 15 km far from the detector, but for simplicity in the calculation we used a step function 20 km long centered at the same point. It does not make a great difference in the final result.
III Results and Discussion
Because the Auger Observatory Fluorescence Detector will be constituted of four detectors with a site seeing of 180o, we have to multiply the result of Eq. 1 by 2. Then using Eq. 1 we calculated the number of events which can be seen in Tables 3 and 4 for different models of ultra-high energy cosmic ray flux and in different energy intervals.
| Models () | 888EeV | 999EeV | 101010EeV | 111111EeV |
|---|---|---|---|---|
| TD-92 (0) | 260 | 450 | 180 | 70 |
| TD-92 (0.5) | 2.8 | 5.7 | 2.8 | 1.5 |
| MPR | 2.4 | 3.6 | 1.1 | 0.3 |
| TD-92 (1) | 0.14 | 0.37 | 0.25 | 0.2 |
| AGN - 95J | 0.15 | 0.22 | 0.07 | 0.02 |
| TD-92 (1.5) | 0.06 | 0.15 | 0.1 | 0.08 |
| WB | 0.05 | 0.08 | 0.02 | 0.01 |
| TD-96 (1) |
From Table 3 one can learn which is the energy interval which is relevant to detect DB events in the Auger fluorescence detector. It is, approximately, 0.63 2. The neutrino flux used here for the model AGN-95J is an approximation that takes roughly the average between the models A and B in reference Mannheim (1995). Table 4 shows the expected number of DB events in three years according to the ultra-high energy cosmic rays source models, when a Standard Model extrapolation for the is used.
| Models () | (GeV-1m-2s-1sr-1) | (3yrs)-1 |
|---|---|---|
| TD-92 (0) | ||
| TD-92 (0.5) | ||
| MPR | ||
| TD-92 (1) | ||
| AGN - 95J | ||
| TD-92 (1.5) | ||
| WB | ||
| TD-96 (1) |
Based on the simulations shown in Section II.1, one can have an idea of the longitudinal development of the DB as a function of the incident angle and energy of the primary neutrino. It is the convolution of the terms and in Eq. 5 that describes the restriction in the energy interval observed in the simulations and Table 3. For relatively low energies the efficiency of the detector is also low and, as can be seen in Eq. 6, for energies higher than 2 EeV the factor is too small.
There is also a restriction for the neutrino incident zenith angle. For zenith angles smaller than 55o, because the lower atmospheric density, the development of the shower is slower and there is a superposition of the two EAS. The DB still can be triggered but in a more sophisticated way by comparing the longitudinal development of the EAS. Fig. 5 shows events with incident angles equal to . In the simulations on the top of Fig. 5 we can observe the two overlapped showers such that they look like a single ordinary EAS. Even in that case one can see that it is possible to identify a DB because both the maximum of the charged particles number and the longitudinal development of the shower are not compatible with a “single-bang” of the same energy, which is shown in the lowest plot of Fig. 5. For zenith angles larger then 75o, since h (see Fig. 1) is too low, it is difficult to detect the first EAS.
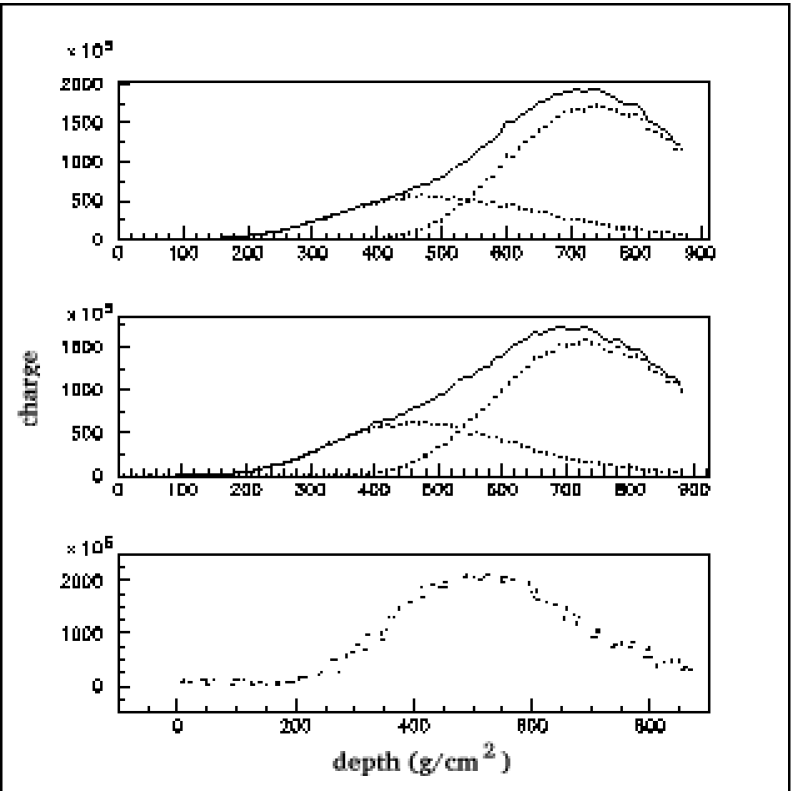
We simulated sixty DB events for each different energy and angle that we present. The results have a root mean square deviation for the maximum of the showers of approximately 30 g/cm2. As the maximum of the DB (top and central plots) in Fig. 5 is around 700 g/cm2 and the maximum of the ordinary EAS (lowest plot) is around 500 g/cm2, it is easy to differentiate between the depth of the maximum of a DB and an ordinary EAS in the simulations we made. If a higher energy proton will masquerade a lower energy DB depends on the accuracy of the detector to determine the energy of the primary particle. Because of the mean life time of the tau, only relatively low energy DB will be superimposed looking like an ordinary EAS. So if you detect an ordinary EAS profile of relatively high energy ( EeV), that cannot be considered a DB event.
To study the relation between the cross section and the potential of the Pierre Auger Fluorescence Detector to detect DB events we wrote the neutrino cross section as , where is a free parameter which depends on the model and cm is the Standard Model extrapolation for which have 10% accuracy within the energy range EeV when compared with the results of the CTEQ4-DIS parton distributions Gandhi et al. (1998).
To account for models that gives a cross section different from the extrapolation of the Standard Model cross section we just vary . It is a naive approximation but gives an idea of how the number of events can increase or decrease if the cross section is not standard. For instance, if the cross section is of order 10 times higher then the standard in the energy range EeV, then even the WB upper bound for the ultra-high energy cosmic ray flux predict a rate of more than 1 event in 3 years in the Pierre Auger Fluorescence Detector.
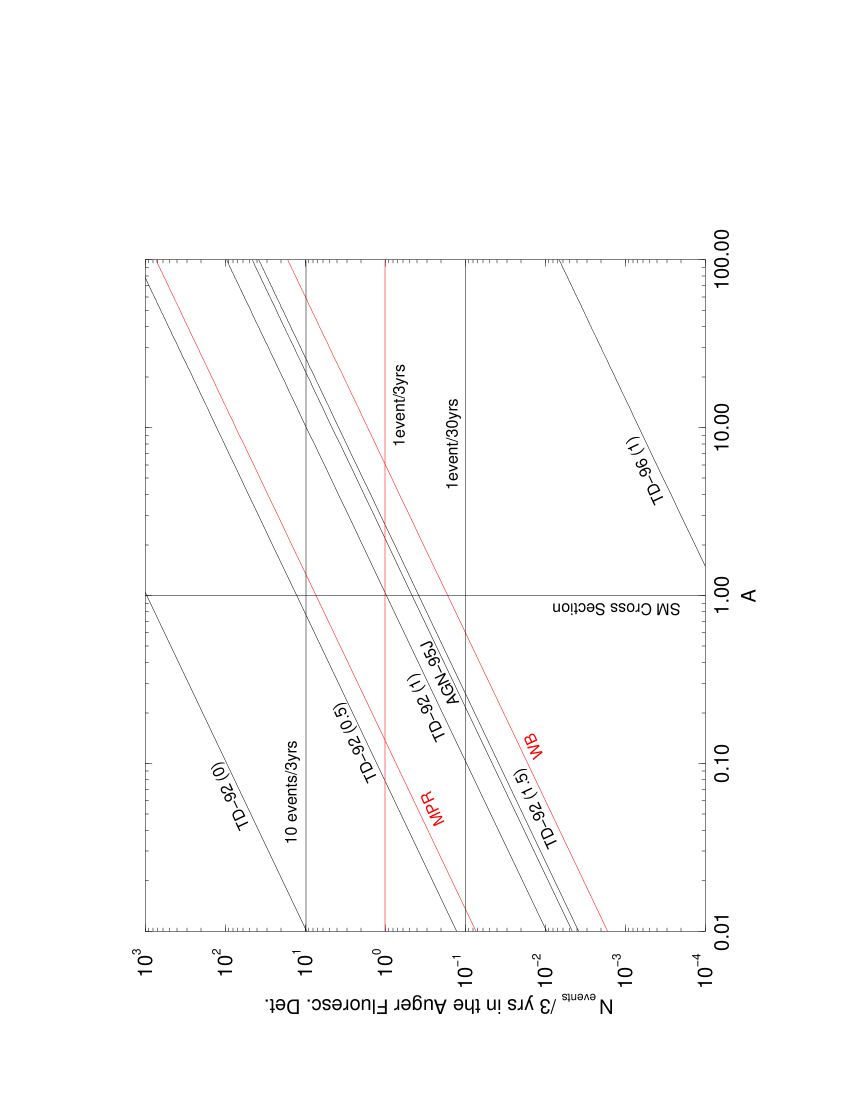
The horizontal lines in Fig. 6 are number of events chosen for comparison (1 event in 3 years is considered the lower limit for the rate of events in the Auger Observatory). The vertical line shows the extrapolated Standard Model cross section. The other lines show the number of events for different models of ultra-high energy cosmic ray flux depending on . For instance, we can see from this figure that assuming the Standard Model extrapolated cross section, if the Observatory measure a number of events around one in three years, models like TD-96(1), TD-92(0) and TD-92(0.5) will be excluded, and the more compatible with the measurements will be TD-92(1).
IV Conclusion
Taken into consideration neutrino oscillations, one expect that one third of the high-energy neutrino flux arriving at the Earth should be composed of tau neutrinos. These neutrinos can interact in the Earth’s atmosphere generating a double shower event named Double-Bang Phenomenon. Many recent works have studied the potential of the Pierre Auger Observatory to detect horizontal air showers generated by ultra-high energy neutrinos with the surface detector. Here we specifically investigate the potential of the fluorescence detector of that observatory to observe DB events.
DB events have very particular characteristics in the Auger Observatory. Different from the neutrino events in the surface detector, DB events do not need to come from the very near-horizontal angles. Despite the low probability of interaction in the atmosphere, we can also have tau neutrinos creating DB events with incident angles from approximately 55o to 75o. DB events also have a lower energy, around 1 EeV, different from the energies around 50 EeV and beyond expected for an ordinary EAS generated by the highest energy cosmic rays. In the range of energy approximately between 0.6 EeV and 2 EeV a considerable part of the two EAS that characterize a DB can be detected by the fluorescence detector and then we have a DB trigger.
The number of DB events depends on many parameters like arrival flux, cross section, energy and incident direction of the neutrinos, and efficiency of the detector. Models like MPR, TD-92(1) and AGN-95J generate a number of events of around one in three years in the Pierre Auger Fluorescence Detector. This is because the energy range where the DB can be detected is very strict. For energies less then 0.6 EeV the efficiency of the detector is too low and for energies greater then 2 EeV the two EAS are too separated.
Concerning the background, the probability for a proton to generate a DB and masquerade the DB generated by a neutrino depends on two possibilities: 1) that the primary proton interaction generates some fragment that will give rise to a secondary shower deep in the atmosphere with energy higher then the first. 2) that another shower created by some independent particle interacts deep in the atmosphere masquerading the second EAS of the DB.
In the possibility 1, the second EAS will be created by the decay or interaction of the fragment deep in the atmosphere. We consider that the primary proton looses roughly half of its energy to the secondary particles that constitute the EAS, and so it is very hard that the second EAS has more energy than the first one. Now, considering that for this high-energies we have a cosmic ray flux of the order of 1 particle per km2 per year and that the only particles that could interact deeply in the atmosphere are neutrinos, generating the second independent EAS near the detector, the chance that the proton and this second independent neutrino come from the same solid angle direction interacting in a time interval of the tau decay in the laboratory frame of s is approximately (at most) 1 in 108, what exclude the possibility 2. The direction of the two EAS can be identified specially if two fluorescence detectors trigger the same DB event (with only one detector, it must be difficult to know the direction of the EAS in the plane that contains the EAS and the detector).
Based on this assumptions, can be a good parameter to identify DB events if the error and the average in the energy measure is within certain specific value. The error in the energy measured by the fluorescence detector will depend mainly on the atmospheric conditions but hardly will exceed 50%. For a DB event the situation is optimistic because the most important is the relation between the energies of the two EAS and this error is smaller than the error of the absolute energy of an ordinary EAS. We can make a conservative estimation of the error in the average ratio considering the error in the absolute energy of 50%. This will give a relative error to the energy ratio of 70%. So, since in average as deduced in Section II, then considering such an error we find 95% of the events such that the energy ratio . Then is a good parameter to identify DB events.
Despite the fact the DB Phenomenon can be very rare, it is very important to be prepared for its detection, specially in case the Pierre Auger ground array detect near-horizontal air showers which can indicate a sign for electron and/or muon neutrinos. Consequently oscillations imply a considerable number of tau neutrinos too. With such a motivation, the Auger Observatory could calibrate its trigger to be more sensitive to energies around 1 EeV or increase the number of fluorescence detectors.
The potential of the DB Phenomenon to acquire valuable information both in particle and astrophysics is irrefutable. For instance, the cross section and flux of the ultra-high energy neutrinos are speculative and can be investigated with DB events.
Acknowledgements.
We thank Carlos Escobar, Vitor de Souza, Henrique Barbosa, Ricardo Sato and Walter Mello of the Auger collaboration in the Instituto de Física at UNICAMP for valuable help and comments on the present work. This research was partially supported by “Conselho Nacional de Desenvolvimento Científico e Tecnológico - CNPq” and “Fundação de Amparo à Pesquisa do Estado de São Paulo - FAPESP”References
- Greisen (1966) K. Greisen, Phys. Rev. Lett. 16, 748 (1966).
- Zatsepin and Kuz’min (1966) G. T. Zatsepin and V. A. Kuz’min, JETP Letters 4, 78 (1966).
- Halzen and Saltzberg (1998) F. Halzen and D. Saltzberg, Phys. Rev. Lett. 81, 4305 (1998).
- Halzen (1998) F. Halzen, Lectures on neutrino astronomy: Theory and experiment, Lectures presented at the TASI School (1998), eprint astro-ph/9810368.
- Learned and Pakvasa (1995) J. G. Learned and S. Pakvasa, Astropart. Phys. 3, 267 (1995).
- Holanda and Smirnov (2002) P. C. Holanda and A. Y. Smirnov, Phys. Rev. D 66, 113005 (2002).
- Fogli et al. (2001) G. L. Fogli, E. Lisi, and A. Marrone, Phys.Rev. D 64, 093005 (2001), eprint hep-ph/0105139.
- Eguchi et al. (2003) K. Eguchi et al., Phys. Rev. Lett. 90, 021802 (2003).
- Ahn et al. (2001) S. H. Ahn et al., Phys. Lett. B 511, 178 (2001).
- Ahn et al. (2003) S. H. Ahn et al., Phys. Rev. Lett. 90, 041801 (2003).
- Athanassopoulos et al. (1995) C. Athanassopoulos et al., Phys. Rev. Lett. 75, 2650 (1995).
- Bazarko (2002) A. Bazarko, in Proceedings of the 31st International Conference on High Energy Physcis (ICHEP02) (Amsterdam, 2002), eprint hep-ex/0210020.
- aug (1997) Pierre auger project design report (1997), http://www.auger.org/admin/DesignReport/index.html.
- (14) G. Parente and E. Zas, eprint astro-ph/9606091.
- Capelle et al. (1998) K. S. Capelle, J. W. Cronin, G. Parente, and E. Zas, Astropart. Phys. 3, 321 (1998).
- Wilczyński (2000) H. Wilczyński, Tech. Rep. GAP-00-020, Auger Colaboration (2000), http://www.auger.org/admin-cgi-bin/woda/gap_notes.pl/.
- (17) M. Ave, R. A. Vázquez, E. Zas, J. A. Hinton, and A. A. Watson, eprint astro-ph/0003011.
- (18) X. Bertou, P. Billoir, O. Deligny, C. Lachaud, and A. Letessier-Selvon, eprint astro-ph/0104452 v3.
- Athar (2003) H. Athar, Nucl. Phys. Proc. Suppl. 122C, 305 (2003), eprint hep-ph/0210244.
- Bellido (1998) J. A. Bellido, Tech. Rep. GAP-98-027, Auger Colaboration (1998), http://www.auger.org/admin-cgi-bin/woda/gap_notes.pl/.
- Quigg et al. (1986) C. Quigg, M. H. Reno, and T. P. Walker, Phys. Rev. Lett. 57, 774 (1986).
- Groom et al. (2000) D. E. Groom et al., European Phys. J. C 15, 23 (2000).
- Bahcall and Ostriker (1996) J. N. Bahcall and J. P. Ostriker, eds., Unsolved Problems in Astrophysics (Princeton, 1996), chap. 17 - J. W. Cronin - The Highest Energy Cosmic Rays, Princeton Series in Astrophysics.
- (24) A. Jain, P. Jain, D. W. McKay, and J. P. Ralston, eprint hep-ph/0011310 v2.
- Ambrosio et al. (2003) M. Ambrosio et al., Tech. Rep. GAP-2003-013, Auger Colaboration (2003), http://www.auger.org/admin-cgi-bin/woda/gap_notes.pl/.
- Gaisser and Hillas (1977) T. K. Gaisser and M. Hillas, in Proceedings of the 15th International Cosmic Rays Conference (1977), p. 353, vol. 8.
- Moura Jr. (2001) C. A. Moura Jr., Master’s thesis, Instituto de Física ‘Gleb Wataghin’ - UNICAMP (2001).
- (28) A. Kusenko and T. Weiler, eprint hep-ph/0106071 v2.
- Barbosa (2000) H. M. J. Barbosa, Master’s thesis, Instituto de Física ‘Gleb Wataghin’ - UNICAMP (2000), pages 111-122.
- Bhattacharjee et al. (1992) P. Bhattacharjee, C. T. Hill, and D. N. Schramm, Phys. Rev. Lett. 69, 567 (1992).
- Sigl (1996) G. Sigl, Space Science Reviews. 75, 375 (1996).
- Mannheim (1995) K. Mannheim, Astropart. Phys. 3, 295 (1995).
- Bahcall and Waxman (2001) J. Bahcall and E. Waxman, Phys. Rev. D 64, 023002 (2001), eprint hep-ph/9902383 v2.
- Rachen et al. (2001) J. P. Rachen, R. J. Protheroe, and K. Mannheim, Phys. Rev. D 63, 023003 (2001), eprint astro-ph/9812398 v3.
- Gandhi et al. (1998) R. Gandhi, C. Quigg, M. H. Reno, and I. Sarcevic, Phys. Rev. D 58, 093009 (1998).