QCD phase diagram at small densities
from simulations with
imaginary
Abstract
We review our results for the QCD phase diagram at baryonic chemical potential . Our simulations are performed with an imaginary chemical potential for which the fermion determinant is positive. For 2 flavors of staggered quarks, we map out the phase diagram and identify the pseudo-critical temperature . For , this is an analytic function, whose Taylor expansion is found to converge rapidly, with truncation errors far smaller than statistical ones. The truncated series may then be continued to real , yielding the corresponding phase diagram for MeV. This approach provides control over systematics and avoids reweighting. We outline our strategy to find the (2+1)-flavor critical point.
1 Introduction
Substantial progress has been accomplished over the last two years toward the numerical determination of QCD properties at finite density. This progress has not come through a solution of the “sign problem”, which prohibits standard Monte Carlo simulations because the Dirac determinant is no longer real positive at non-zero chemical potential . The standard approach to the sign problem, which requires statistics growing exponentially with the volume and the chemical potential, is still current. Rather, progress has come through a change to a more pragmatic attitude. It makes sense to explore the region of small chemical potential, with methods whose failure at large has become acceptable. This is because information so obtained is phenomenologically important, especially for heavy-ion collisions where the net quark density remains small.
Three approaches are currently pursued, and reviewed in these proceedings: a two-parameter reweighting, in and , of simulations [2]; a Taylor expansion of truncated to its lowest non-trivial order [3]; a study at imaginary , followed by analytic continuation of a truncated Taylor series to real . is limited to small volumes because of the sign problem; is in addition restricted to smaller chemical potentials, and the systematic error due to the Taylor truncation is unknown. We have adopted : it can be used for arbitrarily large volumes since it has no sign problem, and systematic errors coming from analytic continuation can be controlled. We review this approach here, applied to the determination of the pseudo-critical line between confinement and deconfinement [1].
2 QCD at real and imaginary chemical potential
The grand canonical partition function
can be considered for a complex chemical potential
. Two general properties suffice to
constrain the phase structure as a function of :
- is an even function of : ,
where .
- A non-periodic gauge transformation, which rotates
the Polyakov loop by a center element but leaves unchanged,
is equivalent to a shift in [4]:
| (1) |
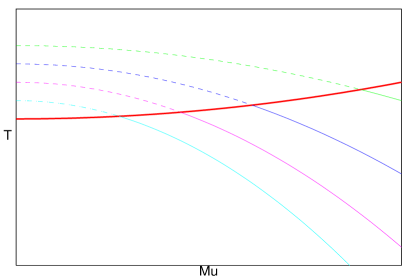
For QCD (), these two properties lead to transitions at critical values of the imaginary chemical potential, , separating regions of parameter space where the Polyakov loop angle falls in different sectors. Perturbative and strong coupling considerations led the authors of [4] to predict at a first-order phase transition at high temperature (deconfined phase) and a crossover at low temperature (confined phase). The resulting phase diagram in the plane is periodic, and depicted in Fig. 1.
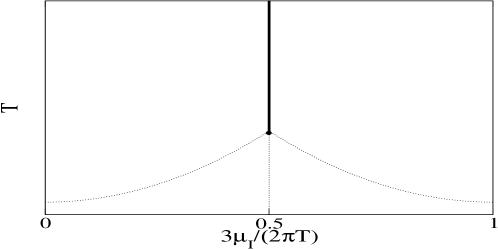
The non-analyticity closest to the origin, at , limits the prospects of analytic continuation. Our strategy, following [5], consists of fitting by a Taylor series in observables measured at , then continuing the truncated Taylor series to real . Convergence of the Taylor expansion can only be checked for , i.e. MeV.
3 Analyticity of the (pseudo-) critical line
The phase transition or crossover between confinement and deconfinement, as (or ) is varied while keeping fixed, is characterized by a peak of the susceptibility for observable . The critical line is thus defined implicitly via
| (2) |
In a finite volume , is analytic, and from the implicit function theorem also is. Moreover, it is an even function of just like , so that it can be expanded in powers of :
| (3) |
Analytic continuation between real and imaginary (for ) is accomplished by flipping the sign of .
4 Numerical results for two light flavors
We have studied QCD with 2 flavors of staggered fermions ( lattice, quark mass , R-algorithm). The lattice spacing is fm, and sizeable corrections can be expected in the continuum extrapolation.
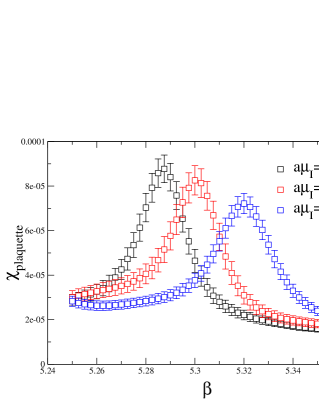
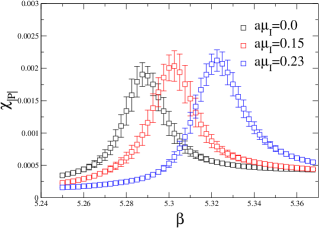
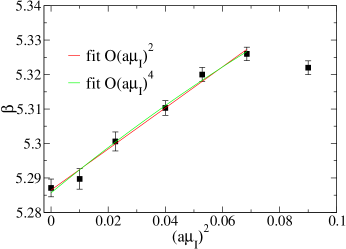
The predicted nature of the transition at is confirmed, and the phase diagram is that of Fig. 1. The confinement-deconfinement transition line is obtained from the peaks of the plaquette, quark condensate and Polyakov loop susceptibilities, which give consistent values (see Fig. 2). These values are then fitted by a Taylor series in over the interval . The data are well described by a linear fit, and agreement hardly improves with a quadratic fit (see Fig. 3a). The quadratic coefficient is zero within errors. Therefore, we can safely approximate the critical line as
| (4) |
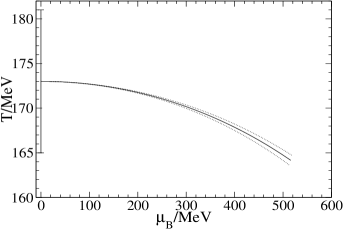
We translate into physical units using the perturbative two-loop -function, which suffices for our present accuracy. This yields, as a function of the baryonic chemical potential
| (5) |
using MeV, while the next-order term is statistically insignificant up to MeV (see Fig. 3b). Similar results have been obtained for 4 flavors [6].
5 How to find the (2+1)-flavor critical endpoint
In the case of 3 flavors (degenerate or not), the deconfinement “transition” changes from crossover to first-order at a critical point , which can be identified by a study of cumulant ratios or Lee-Yang zeroes. As the quark mass is varied, the critical point describes an analytic curve (Fig. 4), which can be Taylor expanded. On the lattice:
| (6) |
As in Section 4, data can be obtained at imaginary , then analytically continued to real by flipping the sign of .
References
- [1] Ph. de Forcrand and O. Philipsen, Nucl. Phys. B 642 (2002) 290 [arXiv:hep-lat/0205016]; arXiv:hep-lat/0209084.
- [2] Z. Fodor and S. D. Katz, JHEP 0203 (2002) 014 [arXiv:hep-lat/0106002].
- [3] C. R. Allton et al., Phys. Rev. D 66 (2002) 074507 [arXiv:hep-lat/0204010].
- [4] A. Roberge and N. Weiss, Nucl. Phys. B 275 (1986) 734.
- [5] M. P. Lombardo, Nucl. Phys. Proc. Suppl. 83 (2000) 375 [arXiv:hep-lat/9908006]; A. Hart, M. Laine and O. Philipsen, Phys. Lett. B 505 (2001) 141 [arXiv:hep-lat/0010008].
- [6] M. D’Elia and M. P. Lombardo, arXiv:hep-lat/0209146.