[
Possible
detection of relic neutrinos and determination of
their mass:
quantitative analysis⋆
Abstract
We consider the possibility that a large fraction of the ultrahigh energy cosmic rays (UHECRs) are decay products of Z bosons which were produced in the scattering of ultrahigh energy cosmic neutrinos (UHECs) on cosmological relic neutrinos (Rs). We compare the observed UHECR spectrum with the one predicted in the above Z-burst scenario and determine the mass of the heaviest R as well as the necessary UHEC flux via a maximum likelihood analysis.
ITP-Budapest 569 DESY 01-070
]
I Introduction
Big-bang cosmology predicts the existence of the cosmic microwave background radiation (CMBR) and a similar background of Rs with an average number density of cm-3 per light neutrino species ( MeV). However, the Rs have not been detected until now.
A possibility for their detection was discussed some time ago: the UHEC spectrum should have absorption dips at energies eV (1 eV/) due to resonant annihilation with the Rs into Z bosons of mass [1, 2, 3]. Recently it was realized that the same annihilation mechanism might already be visible in the UHECR spectrum [4, 5] at energies above the predicted Greisen-Zatsepin-Kuzmin (GZK) cutoff [6, 7, 8] around eV. It was argued that the UHECRs above the GZK cutoff are mainly protons from Z decay.
This hypothesis was discussed in several papers [9, 10, 11, 12, 13, 14]. We report here on our recent quantitative investigation of the Z-burst scenario, where we have determined the mass of the heaviest R as well as the necessary UHEC flux via a maximum likelihood analysis [15].
Our comparison of the Z-burst scenario with the observed UHECR spectrum was done in four steps. First, we determined the probability of Z production as a function of the distance from Earth. Secondly, we exploited collider experiments to derive the energy distribution of the produced protons in the lab system. Thirdly, we considered the propagation of the protons, i. e. we determined their energy losses due to pion and production through scattering on the CMBR and due to their redshift. The last step was the comparison of the predicted and observed spectra and the extraction of the mass of the R and the necessary UHEC flux.
II Z-burst spectrum
Our prediction of the contribution of protons
from Z-
⋆Talk to be presented
at the 27th International Cosmic Ray Conference, Hamburg, Germany,
August 7-15, 2001.
bursts to the UHECR spectrum, for degenerate masses (), can be summarized as
| (2) | |||||
where the total time and angle integrated detector area and the normalization factor , which is proportional to the sum of the fluxes at centre-of-mass (CM) energy , are determined later by the comparison with the UHECR data. is the energy of the protons arriving at Earth. Further important ingredients in our prediction (2) are: the UHEC fluxes at the resonant energy and at distance to Earth, the number density of the Rs, the Z production cross section at CM energy , the energy distribution of the produced protons with energy , and the probability that a proton created at a distance with energy arrives at Earth above the threshold energy .
The last three building blocks, , , and , are very well determined. At LEP and SLC millions of Z bosons were produced and their decays analyzed with extreme high accuracy. We used existing published [16, 17, 18, 19] and some improved unpublished [20] data to determine the proton momentum distribution . Due to the large statistics, the uncertainties of our analysis related to Z decay turned out to be negligible. Similarly, the CMBR is known to a high accuracy. It plays the key role in the determination of the probability [21, 22], which takes into account the fact that protons of extragalactic (EG) origin and energies above eV lose a large fraction of their energies [6, 7] due to pion and production through scattering on the CMBR and due to their redshift. , in the form as it has been calculated for a wide range of parameters by two of the present authors [22], was an indispensible tool in our quantitative analysis.
Less accurately known in Eq. (2) are the first two ingredients, the flux of UHECs, , and the neutrino number density .
The former was assumed to have the form , where is the redshift and where characterizes the source evolution (see also [3, 10]). The flux at Earth, , has been determined by the fit to the UHECR data. In our analysis we went up to distances (cf. (2)) corresponding to redshift (cf. [23]), and uncertainties of the expansion rate [24] were included.
The neutrino number density has been treated in the following way. For distances below 100 Mpc we varied the shape of the distribution between the homogeneous case and that of , the total mass distribution obtained from peculiar velocity measurements [25]. In this way we took into account that the density distribution of Rs as hot dark matter (DM) follows the total mass distribution; however, with less clustering. It should be noted that for distances below 100 Mpc the peculiar velocity measurements [25] suggest relative overdensities of at most a factor 2 3, depending on the grid spacing. We did not follow the unnatural assumption of having a relative overdensity of in our neighbourhood, as it was assumed in earlier investigations of the Z-burst hypothesis [4, 5, 9, 10, 12]. Our quantitative results turned out to be rather insensitive to the variations of the overdensities within the considered range, whose effect is included in our final error bars. For scales larger than 100 Mpc the R density was taken according to the big-bang cosmology prediction, cm-3.

III Determination of and UHEC flux
We compared the predicted spectrum (2) of protons from Z-bursts with the observed UHECR spectrum (cf. Fig. 1). Our analysis included UHECR data of AGASA [26, 27], Fly’s Eye [28, 29, 30], Haverah Park [31, 32], and HIRES [33]. Due to normalization difficulties we did not use the Yakutsk [34] results.
The predicted number of UHECR events in a bin was taken as
| (3) |
where is the lower bound of the energy bin. The first term is the usual power-law behavior, which describes the data well for smaller energies [26, 27]. For this term we studied two possibilities. In the first case we assumed that the power part is produced in our galaxy. Thus no GZK effect was included for it (“halo”). In the second – in some sense more realistic – case we assumed that the protons come from uniformly distributed, EG sources and suffer from the GZK cutoff (“EG”). In this case the simple power-law-like term is modified, by taking into account the probability , and falls off around eV (see Fig. 1). The second term of the flux in Eq. (3) corresponds to the spectrum of the Z-bursts, Eq. (2). A and are normalization factors. Note that the following implicit assumptions have been made through the form of Eq. (3): i) We have assumed (and later checked) that the UHE photons from Z-bursts can be neglected. ii) We have assumed that there are no significant additional primary UHE proton fluxes beyond the extrapolation of the above power-law. This constraint will be relaxed in a future publication [35].
The expectation value for the number of events in a bin is given by Eq. (3). To determine the most probable value for we used the maximum likelihood method and minimized [36] the ,
| (4) |
where is the total number of observed events in the bin. As usual, we divided each logarithmic unit into ten bins. Since the Z-burst scenario results in a quite small flux for lower energies, the “ankle” is used as a lower end for the UHECR spectrum: . Our results are insensitive to the definition of the upper end (the flux is extremely small there) for which we choose . The uncertainties of the measured energies are about 30% which is one bin. Using a Monte-Carlo method we included this uncertainty in the final error estimates.
In our fitting procedure we had four parameters: and . The minimum of the function is at which is the most probable value for the mass, whereas gives the 1 (68%) confidence interval for . Here , , are defined in such a way that the function is minimized in and at fixed .
Qualitatively, our analysis can be understood in the following way. In the Z-burst scenario a small R mass needs large in order to produce a Z. Large results in a large Lorentz boost, thus large . In this way the shape of the detected energy () spectrum determines the mass of the R. The sum of the necessary UHEC fluxes was then determined from the obtained normalization .
Our best fits to the observed data can be seen in Fig. 1, for evolution parameter . We found a neutrino mass of eV for the “halo”- and eV for the “EG”-case, respectively. The first numbers are the 1 , the numbers in the brackets are the 2 errors. This gives an absolute lower bound on the mass of the heaviest of eV at the 95% CL. The fits are rather good; for 21 non-vanishing bins and 4 fitted parameters they can be as low as . We determined for a wide range of cosmological source evolution () and Hubble parameter ( km/sec/Mpc) and observed only a moderate dependence on them. The results remain within the above error bars. We performed a Monte-Carlo analysis studying higher statistics. In the near future, Auger [37, 38] will provide a ten times higher statistics, which reduces the error bars in the neutrino mass to one third of their present values.
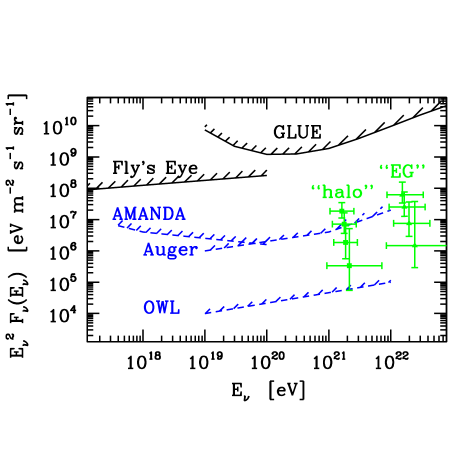
The necessary UHEC flux at has been obtained from our fit values of the normalization . We have summarized them in Fig. 2, together with some existing upper limits and projected sensitivities of present, near future and future observational projects. It is apparent that the flux determination depends much more on the evolution uncertainties than the mass determination. The necessary flux appears to be well below present upper limits and is within the expected sensitivity of AMANDA, Auger, and OWL.
IV Comparison with from oscillations
One of the most attractive patterns for masses is similar to the one of the charged leptons or quarks: the masses are hierarchical, thus the mass difference between the families is approximately the mass of the heavier particle. Using the mass difference of the atmospheric oscillation for the heaviest mass [24], one obtains values between 0.03 and 0.09 eV. It is an intriguing feature of our result that the smaller one of the predicted masses is compatible on the 1.3 level with this scenario.
Another popular possibility is to have 4 neutrino types. Two of them – electron and sterile neutrinos – are separated by the solar oscillation solution, the other two – muon and tau – by the atmospheric oscillation solution, whereas the mass difference between the two groups is of the order of 1 eV. We studied this possibility, too. On our mass scales and resolution the electron and sterile neutrinos are practically degenerate with mass and the muon and tau neutrinos are also degenerate with mass . The best fit and the 1 region in the plane is shown in Fig. 3 for the “EG”-case. The dependence of this result on the cosmological evolution and on the UHEC spectrum will be discussed elsewhere [35]. Since this two-mass scenario has much less constraints the allowed region for the masses is larger than in the one-mass scenario.

V Differences with respect to Yoshida et al. (1998)
Numerical simulations of Z-burst cascades for eV, taking into account all known EG propagation effects, were performed by Yoshida et al. [10]. Based on case studies, relative overdensities of Rs ranging from on a scale of 5 Mpc were argued to be necessary in order to get a successful description of the UHECR events and rate above the GZK cutoff without violating lower energy photon flux limits and without invoking inconceivable UHEC fluxes. For such large overdensities, most of the UHECRs from Z-bursts originate nearby and their attenuation to the Earth can be neglected. In our case, with realistic overdensities on scales Mpc, most of the UHECRs from Z-bursts originate from cosmological distances. Therefore, despite of the fact that by construction the overall rate of UHECRs from Z-bursts observed at Earth is the same in both investigations, the predicted spectra are quite different. No large overdensity is needed to reproduce the data. Note that the EG scenario is dominated not by the nearby Z-burst but by the pile-up of Z-burst protons due to the GZK effect (cf. Fig. 1).
VI Conclusions
We reported on a comparison of the predicted spectrum of the Z-burst hypothesis with the observed UHECR spectrum [15]. The mass of the heaviest R turned out to be eV for halo and eV for EG scenarios. The second mass, with a lower bound of eV on the 95% CL, is compatible with a hierarchical mass scenario with the largest mass suggested by the atmospheric oscillation. The above masses are in the range which can be explored by future laboratory experiments like the decay endpoint spectrum and the less decay [13, 44]. They compare also favourably with the tau(?) neutrino mass range eV found recently from a detailed analysis of the latest CMBR measurements [45]. We analysed a possible two-mass scenario and gave the corresponding confidence level region. The necessary UHEC flux was found to be consistent with present upper limits and detectable in the near future.
Acknowledgements.
We thank S. Barwick, O. Biebel, S. Bludman, W. Buchmüller, K. Mannheim, H. Meyer, W. Ochs, and K. Petrovay for useful discussions. We thank the OPAL collaboration for their unpublished results on hadronic Z decays. This work was partially supported by Hungarian Science Foundation grants No. OTKA-T34980/T29803/T22929/M28413/OM-MU-708.REFERENCES
- [1] Weiler, T., Phys. Rev. Lett. 49, 234, 1982.
- [2] Roulet, E., Phys. Rev. D 47, 5247, 1993.
- [3] Yoshida, S. et al., Astrophys. J. 479, 547, 1997.
- [4] Fargion, D., Mele, B. and Salis, A., Astrophys. J. 517, 725, 1999.
- [5] Weiler, T.J., Astropart. Phys. 11, 303, 1999; 12, 379, 2000 (Err.).
- [6] Greisen, K., Phys. Rev. Lett. 16, 748, 1966.
- [7] Zatsepin, G.T. and Kuzmin, V.A., Pisma Zh. Eksp. Teor. Fiz. 4, 114, 1966.
- [8] Bhattacharjee, P. and Sigl, G., Phys. Rept. 327, 109, 2000.
- [9] Waxman, E., astro-ph/9804023
- [10] Yoshida, S., Sigl, G., and Lee, S., Phys. Rev. Lett. 81, 5505, 1998.
- [11] Gelmini, G. and Kusenko, A., Phys. Rev. Lett. 82, 5202, 1999.
- [12] Blanco-Pillado, J.J., Vázquez, R.A., and Zas, E., Phys. Rev. D 61, 123003, 2000.
- [13] Päs, H. and Weiler, T.J., hep-ph/0101091
- [14] Fargion, D. et al., astro-ph/0102426
- [15] Fodor, Z., Katz, S.D., and Ringwald, A., hep-ph/0105064
- [16] Akers, R. et al., Z. Phys. C 63, 181, 1994.
- [17] Abreu, P. et al., Nucl. Phys. B 444, 3, 1995.
- [18] Buskulic, D. et al., Z. Phys. C 66, 355, 1995.
- [19] Abe, K. et al., hep-ex/9908033
- [20] Abe, K. et al., OPAL PN299, unpublished.
- [21] Bahcall, J.N. and Waxman, E., Astrophys. J. 542, 543, 2000.
- [22] Fodor, Z. and Katz, S.D., Phys. Rev. D 63, 023002, 2001.
- [23] Waxman, E., Astrophys. J. 452, L1, 1995.
- [24] Groom, D.E. et al., Eur. Phys. J. C 15, 1, 2000.
- [25] Dekel, A. et al., Astrophys. J. 522, 1, 1999.
- [26] Takeda, M. et al., Phys. Rev. Lett. 81, 1163, 1998.
- [27] Takeda, M. et al., astro-ph/9902239
- [28] Bird, D.J. et al., Phys. Rev. Lett. 71, 3401, 1993.
- [29] Bird, D.J. et al., Astrophys. J. 424, 491, 1994.
- [30] Bird, D.J. et al., Astrophys. J. 441, 144, 1995.
- [31] Lawrence, M.A., Reid, R.J.O., and Watson, A.A., J. Phys. G 17, 773, 1991.
- [32] Ave, M. et al., Phys. Rev. Lett. 85, 2244, 2000.
- [33] Kieda, D. et al., in Proceedings of the 26th International Cosmic Ray Conference, Salt Lake, 1999.
- [34] Efimov, N.N. et al., in Proc. of the Astrophysical Aspects of the Most Energetic Cosmic Rays (World Scientific, Singapore, 1991).
- [35] Fodor, Z., Katz, S.D., and Ringwald, A., in preparation.
- [36] Fodor, Z. and Katz, S.D. Phys. Rev. Lett. 86, 3224, 2001.
- [37] Guerard, C.K., Nucl. Phys. Proc. Suppl. 75A, 380, 1999.
- [38] Bertou, X., Boratav, M., and Letessier-Selvon, A., Int. J. Mod. Phys. A15, 2181, 2000.
- [39] Baltrusaitis, R.M. et al., Phys. Rev. D 31, 2192, 1985.
- [40] Gorham, P.W. et al., astro-ph/0102435
- [41] Barwick, S., www.ps.uci.edu/~amanda
- [42] Capelle, K.S. et al., Astropart. Phys. 8, 321, 1998.
- [43] Ormes, J.F. et al., in Proc. of the 25th International Cosmic Ray Conference, Potchefstroom, 1997.
- [44] Farzan, Y., Peres, O.L.G., and Smirnov, A.Yu., hep-ph/0105105
- [45] Wang, X., Tegmark, M., and Zaldarriaga, M., astro-ph/0105091