Lattice QCD at non-zero chemical potential and
the resonance gas model
BI-TP 2004/04
Abstract
We present results from lattice calculations on the thermodynamics of QCD at non-zero temperature and baryon chemical potential and discuss the role of resonances for the occurrence of the transition to the quark-gluon plasma in hot and dense matter. Properties of a hadronic resonance gas are compared to lattice results on the equation of state at zero as well as non-zero baryon chemical potential. Furthermore, it is shown that the quark mass dependence of the transition temperature can be understood in terms of lines of constant energy density in a resonance gas.
1 Introduction
Today properties of strongly interacting matter at high temperature and non-zero baryon number density are analyzed within the field theoretic framework given by the theory of strong interactions – Quantum Chromo Dynamics (QCD). Two aspects of this theory, which describes the interaction among their elementary constituents, quarks and gluons, are of central importance for our understanding of the different phases of QCD at non-zero temperature and density as well as for our understanding of the experimentally observed spectrum of hadronic bound states – confinement and chiral symmetry breaking. The chiral symmetry, which is spontaneously broken in QCD with massless quark flavors, as well as the center symmetry, realized in the gauge field sector of -color QCD in the limit of infinitely heavy quarks, put strong constraints on qualitative aspects of the QCD phase diagram[1, 2]. In fact, quite general considerations concerning universal properties of the QCD phase transition rely on these symmetries. Many of the emerging predictions concerning the order of the QCD transition and concerning universal properties in the vicinity of second order phase transitions in QCD have been verified over the last 20 years in numerical studies of lattice regularized QCD[3].
In our attempt to reach a deeper understanding of the physics behind the occurrence of the QCD phase transition, mechanisms like the dual Higgs mechanism, monopole condensation or vortex percolation have been identified[4], which characterize the drastic modifications of the QCD vacuum that occur at the critical temperature. However, none of these considerations provides insight into the question which properties of QCD set the scale and control quantitative aspects of the transition from hadronic matter at low temperature and density to the quark gluon plasma (QGP) at high temperature and/or density.
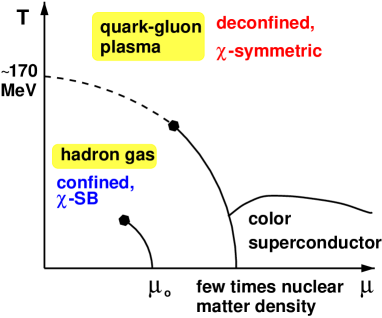
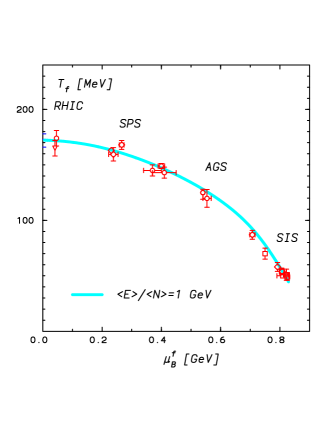
Long before lattice calculations provided first evidence for a phase transition in strongly interacting matter[5] the inevitable need for critical behavior in hadronic matter has been discussed in the framework of resonance gas models[6]. It has been noticed that ordinary hadronic matter cannot persist at arbitrary high temperatures and densities[6]; the copious production of resonances will lead to a natural end of the temperature and density regime in which hadrons can exist. It also has been suggested that the properties of dense hadronic matter and the role of resonances could be studied experimentally in heavy ion collisions[7]. Indeed, in such experiments it has been found that the abundances of various particle species are well described by a hadronic resonance gas model[8] which is characterized by two equilibrium parameters, temperature, , and baryon chemical potential, . Both depend on the center of mass energy in these collisions; with increasing energy the temperature of the resonance gas increases and the relevant baryon chemical potential decreases. At RHIC the baryon chemical potential is quite small ( MeV) while the temperature of the resonance gas reaches 177 MeV[9]. This is in good agreement with the transition temperature to the quark-gluon plasma phase, MeV, found in lattice calculations[10] of 2-flavor QCD at vanishing baryon chemical potential . Recent exploratory lattice calculations also show that the transition temperature drops slowly with increasing baryon chemical potential[11, 12, 13] and that the smooth transition at small turns into a second order transition at a critical point[11] where is about 10% smaller than the transition temperature at and estimates for range from MeV[11] to MeV[14]. The anticipated QCD phase diagram and the freeze-out curve determined from the particle abundances observed in various heavy ion experiments are shown in Fiq. 1.
In this paper we want to discuss evidence provided by lattice calculations for the contribution of hadron resonances to the thermodynamics of QCD. We will analyze the equation of state and the quark mass dependence of the QCD transition temperature. Furthermore, we will address the question to what extend the freeze out temperature observed in heavy ion experiments is related to the phase boundary for the transition to the QGP calculated in lattice QCD.
2 Lattice results on and the equation of state
2.1
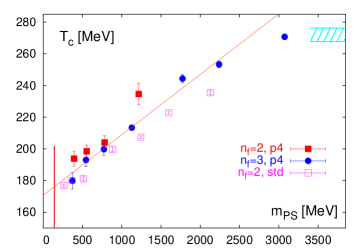
Studies of the quark mass dependence of the transition to the high temperature phase of QCD show that the transition temperature decreases gradually with decreasing quark mass111Quark masses used in lattice calculations are bare parameters of the QCD Lagrangian which need to be renormalized. In order to avoid any discussion of the renormalization of quark masses it is more appropriate to discuss the quark mass dependence of thermodynamic observables in terms of a well controlled physical parameter. E.g. we will use here the lightest pseudo-scalar meson (pion) mass, . To express this in physical units (MeV) we use zero temperature lattice calculations of the string tension and set the scale by using MeV.. Over a wide range of pion mass values, , the transition temperature depends linearly on and the slope seems to be more or less independent of the number of flavors (Fig. 2(left)). In Ref. 10 the mass dependence of has been parametrized as,
| (1) |
For smaller pion masses one may expect that chiral symmetry leads to modifications of this linear relation222In the case of a second order transition in 2-flavor QCD one expects to find for small values of the pseudo-scalar mass, , where is a combination of critical exponents of the 3-, -model.; for GeV the transition temperature will approach a constant as all meson and baryon masses become larger than the (almost) quark mass independent glueball-masses and thus will decouple from the thermodynamics.
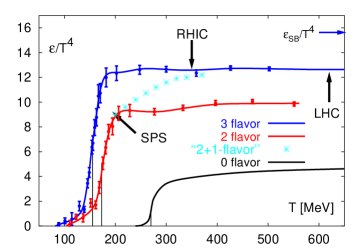
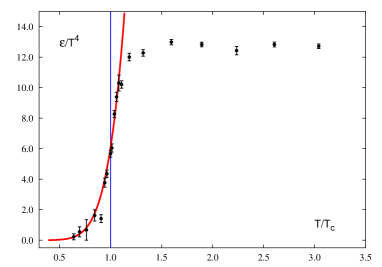
The change in transition temperature between the light quark mass and infinite quark mass regime goes along with a change in , the critical energy density expressed in units of the transition temperature, by more than an order of magnitude (Fig. 2(right)), i.e. for MeV and for . This large change reflects the large difference in the number of degrees of freedom which control the high temperature ideal gas limit. However, it does not at all suggest that the critical energy density itself changes significantly. In fact, when taking into account the shift in for both cases it seems that the critical energy density itself does not change much. Although statistical errors are still large both cases are consistent with a critical energy density in the range GeV/fm3.
2.2
Lattice simulations at non-zero baryon chemical potential333We use here the notion of baryon chemical potential although lattice calculations are performed in terms of the quark chemical potential . generally suffer from the problem that the fermion contribution to the QCD partition function is no longer represented by a positive definite quantity; the fermion determinant becomes complex. This excludes the application of standard Monte Carlo simulation techniques[15]. This problem has, however, been avoided in recent studies of the dependence of the transition temperature on the chemical potential[11, 12, 13] as well as calculations of the equation of state[16, 17] at non-zero baryon chemical potential by using extrapolation techniques applied to numerical results obtained at .
At fixed temperature and small values of the chemical potential the pressure may be expanded in a Taylor series around ,
| (2) |
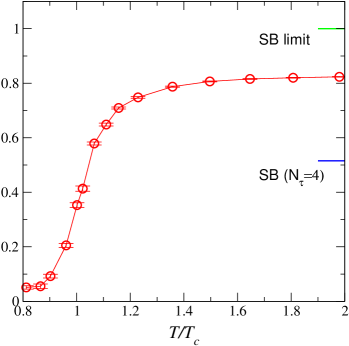
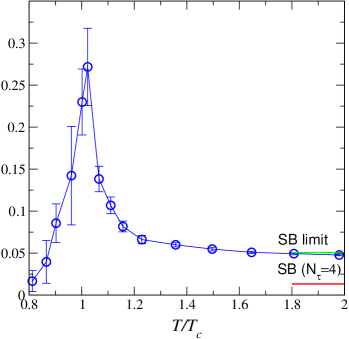
where the expansion coefficients are given in terms of derivatives of the logarithm of the QCD partition function, . The series is an even series in . The first coefficient, , just gives the pressure studied for some time in finite temperature lattice calculations at . The first non-zero coefficient, , is proportional to the quark number susceptibility at which also has been studied in the past[18]. The relevant expansion coefficients entering the calculation of the pressure and quark number susceptibility in a Taylor expansion of the partition function up to [17],
| (3) |
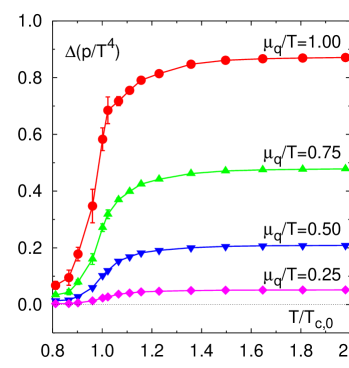
are shown in Fig. 3. In Fig. 4(left) we show corresponding results on the change in pressure, Similar results have been obtained using a reweighting technique[16]. A comparison with the pressure calculated at shows that at and for the enforced presence of a non-zero baryon number adds about 30% to the overall pressure in the system. This also confirms that the Taylor expansion converges rapidly up to .
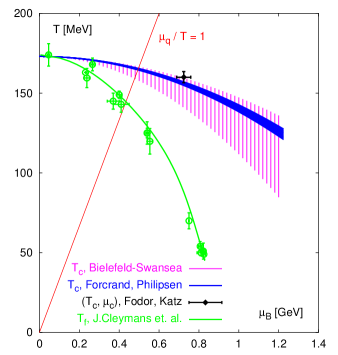
The reweighting approach[11, 12] as well as the analytic continuation of results obtained in simulations with an imaginary chemical potential[13] have also been used to determine the -dependence of the transition temperature. These results are shown in Fig. 4(right). We note that for small values of the chemical potential the lines shown in this figure do not correspond to a phase transition but rather characterize a rapid but smooth crossover from the hadronic to the plasma phase. Also shown in the figure is an estimate of the chiral critical point[11], i.e. a second order phase transition point, , in the QCD phase diagram. For the transition is expected to become a first order phase transition.
Although the different methods used to determine do seem to give compatible results, a detailed quantitative comparison is difficult as all calculations performed so far have used different discretization schemes and/or quark mass values. Moreover, the estimates have partly been obtained on rather small lattices with unimproved gauge and fermion actions and/or too large quark masses. The current quantitative results thus need to be improved and confirmed in future calculations. A first analysis of the quark mass dependence of the transition line for 3-flavor QCD[19] seems to indicate that the -dependence becomes stronger with decreasing quark mass and that the chiral critical point in the physically realized case of (2+1)-flavor QCD shifts to smaller values of the baryon chemical potential[14], MeV.
3 Thermodynamics of the hadronic resonance gas
3.1
In Hagedorn’s approach to the thermodynamics of strongly interacting matter[6] critical behavior arises because any increase in energy of an ensemble of strongly interacting hadrons is predominantly used to generate new resonances rather than transforming it into kinetic energy of the constituents. Energy thus is not used for heating up the system any further. The exponentially rising spectrum of resonances, , leads to the occurrence of a critical (limiting) temperature, .
A similar mechanism is known to lead to critical behavior in purely gluonic systems, i.e. in the gauge theories. Here the fluctuations of color flux tubes (string) lead to an exponentially rising excitation spectrum which again leads to critical behavior. Calculations of the critical temperature, , within the Nambu-Goto model yield[20],
| (4) |
which only depends on the space-time dimension, , and, in particular, is independent of the color degrees of freedom. Lattice calculations of the phase transition temperature of gauge theories in 3 and 4 space-time dimensions, indeed, yield critical temperatures, which are in good agreement with the string model predictions. Some results from lattice calculations[21] are summarized in Table 1 and compared with the string model prediction.
| 3 | 2 | 1.08(1) | 4 | 2 | 0.69(2) |
| 3 | 0.97(1) | 3 | 0.632(2) | ||
| string | model: | 0.977 | string | model: | 0.691 |
This clearly suggests that resonances play an essential role in triggering the occurrence of the deconfinement transition, although the order of the transition and, in those cases where the transition is second order, also universal properties of the transition are controlled by the global center symmetry of the gauge theories. It thus is interesting to explore what role the (exponentially) rising hadronic resonance spectrum plays for the occurrence of the transition to the plasma phase in the physical, light quark mass regime.
A first hint at the importance of resonances for the occurrence of the QCD transition may be obtained from the energy density at . In the limit of massless quark flavors the sector of massless Goldstone bosons would contribute to the energy density with , if this contribution can be approximated by an ideal gas of non-interacting bosons. The calculations of the energy density shown in Fig. 2(right) have been performed with quark masses which correspond to a pion mass of about MeV. Their contribution to the energy density thus is exponentially suppressed. A free gas of massive relativistic particles would contribute
| (5) |
to the energy density. Here for bosons, for fermions and is the degeneracy factor of the particle state. For this yields which shows that quite a few hadronic degrees of freedom are needed to saturate the value of the energy density found in lattice calculations at .
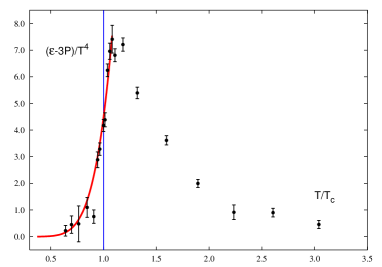
In a gas of non-interacting resonances energy density and pressure are given as sum over the single particle contributions, e.g. , where labels the masses, , of experimentally known mesons and baryons. In order to compare the resonance gas model with lattice results we, however, have to take into account that the latter are not obtained from calculations performed with the physically realized light quark mass spectrum. A corresponding analysis has been performed in Refs. 22,23. The resulting comparison between a modified resonance gas model and lattice data for (2+1)-flavor QCD[10] is shown in Fig. 5. Similar agreement has been obtained for 2-flavor QCD by suppressing the contribution of ”strange” hadrons. This shows that resonance can account for the rapid rise of the energy density observed in lattice calculations for .
3.2
The resonance gas model does make quite stringent predictions for the thermodynamics at non-vanishing chemical potential[22, 23]. As all baryons in QCD are heavy compared with the temperature regime of interest, i.e. for , the contribution of baryons to the thermodynamics can be handled in the Boltzmann approximation. This leads to a factorization of the temperature and fugacity, , dependence of thermodynamic observables. The pressure of a gas of baryons and their resonances thus can be written as
| (6) |
where is given by a sum over all baryons and their resonances,
| (7) |
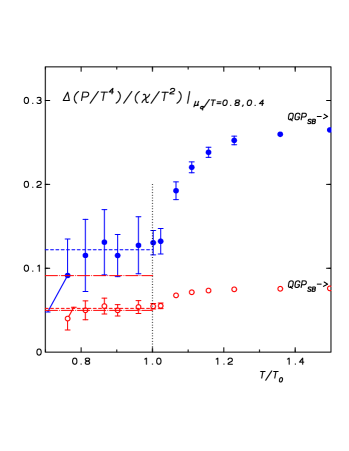
As the mesonic part of a gas of non-interacting resonances does not depend on the baryon chemical potential the change in pressure due to a non-vanishing chemical potential is entirely determined by the baryonic sector, . This, of course, also holds for derivatives with respect to at fixed temperature. The factorization of the and -dependent terms then leads to simple relations among various thermodynamic observables. For instance, one finds for the baryonic susceptibility,
| (8) | |||||
This relation is particularly interesting as it suggests that the ratio does not depend on details of the hadron mass spectrum and thus can directly be compared with lattice calculations performed with un-physically large quark masses. Such a comparison is shown in Fig. 6(left). The agreement between the lattice results and the resonance gas model relation is quite striking, although it has to be noted that the current lattice analysis has been performed using a Taylor series expansion to order only. This truncation, of course, eliminates any true density driven singular behaviour and, for instance, cannot lead to a divergent susceptibility. Large fluctuations which could occur in the vicinity of a phase transition are suppressed. This also is true for the resonance gas model approach, which does not lead to true singular behaviour as long as it is formulated in terms of a finite set of resonances.
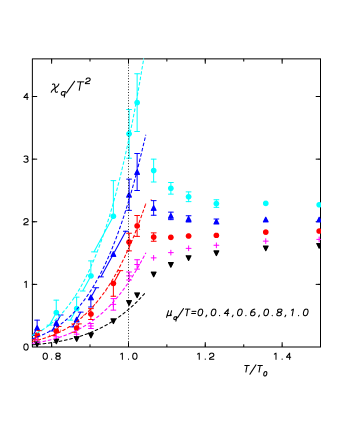
The resonance gas model also yields a reasonably good description of the temperature dependence of thermodynamic quantities at fixed fugacity. This, of course, involves information on the explicit form of the resonance spectrum. Taking again into account that lattice simulations so far have been performed with unphysical quark mass values one can directly compare the quark number susceptibilities calculated in the resonance gas model and on the lattice. This is shown in Fig. 6(right).
4 The critical temperature
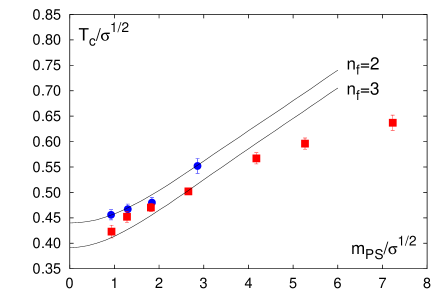
The good agreement between lattice results on the QCD equation of state in the low temperature phase and the resonance gas model raises the question whether we can also understand the dependence of the QCD transition temperature on the quark mass in terms of a resonance gas. The similarity of the ”critical” energy densities found in the infinite quark mass limit and for (moderately) light quark masses suggests that the transition to the quark gluon plasma phase occurs at approximately constant energy density, irrespective of the quark mass values or the physical masses of the hadronic resonances. This assumption is the basis for the comparison of transition temperatures in 2 and 3 flavor QCD with lines of constant energy density calculated in a resonance gas model[22]. Results are shown in Fig. 7. Up to pseudo-scalar masses GeV the agreement with the hadronic resonance gas is quite reasonable. For larger pseudo-scalar masses the glueball sector does start to play an increasingly important role as the heavy hadrons decouple from the thermodynamics and the ”lighter” glueballs yield the largest contribution to the energy density. Aside from the inclusion of glueball states in the resonance gas[22] one eventually also has to take into account that thermal effects may strongly influence the glueball spectrum close to the transition temperature[24]. Doing so the qualitative features of the quark mass dependence of can be modeled in the entire mass regime.
Finally, let us consider the lines of constant energy density in the - plane. Separating the meson and baryon contribution to the energy density,
| (9) |
where is the baryonic contribution to the energy density at , one now can follow the strategy applied also in the lattice calculations and determine the lines of constant energy density from a leading order Taylor expansion. Expanding around the transition point at vanishing chemical potential, , yields,
| (10) |
We note that the denominator on the right hand side is just the specific heat in a resonance gas at . This shows that one does expect a quite weak dependence of the transition temperature on the chemical potential, if the transition at is close to a second order transition. Although this is in qualitative agreement with the weak -dependence of the transition line observed in lattice calculations it seems that the resonance gas still leads to a somewhat stronger variation with . A more direct comparison in the limit of physical quark masses would be desirable here.
5 Conclusions
We have shown that the hadronic resonance gas model is able to describe quite a few quantitative and qualitative results obtained in lattice calculations on the thermodynamics of the low temperature hadronic phase of QCD as well as basic properties of the transition line to the high temperature phase. This suggests that the copious production of hadronic resonance indeed plays an important role in triggering the transition to the quark gluon plasma phase of QCD. Unfortunately, a direct comparison of lattice calculations with an non-interacting gas of resonances given directly in terms of the experimentally known hadron spectrum is at present not yet possible. If one wants to compare the current lattice calculations, which still are being performed with too heavy quark masses, with the hadronic resonance gas some phenomenological input on the quark mass dependence of hadron resonances is required. However, it will soon be possible to further reduce or even eliminate the present ambiguities. With the availability of a new generation of Teraflops computers for lattice QCD it soon will become possible to perform studies of QCD thermodynamics with an ”almost” realistic spectrum of quark masses.
Acknowledgements
This paper summarizes talks given at the conferences on ”Finite Density QCD” and ”Confinement 2003” held in July 2003 in Nara and Wako, Japan, respectively. I would like to thank the organizers, in particular A. Nakamura and H. Suganuma, for the hospitality extended to me during these very exciting and stimulating meetings. Attending these conferences has also been made possible through a travel grant of the German Research foundation (DFG).
References
- [1] B. Svetitsky and L.G. Yaffe, Phys. Rev. D26 (1982), 963.
- [2] R.D Pisarski and F. Wilczek, Phys. Rev. D29 (1984), 338.
- [3] F. Karsch, Lect. Notes Phys. 583 (2002), 209.
- [4] for a discussion and further references see e.g., Proceedings of the International Workshop on Understanding deconfinement in QCD (World Scientific 2000, Edts: D. Blaschke, F. Karsch and C. D. Roberts).
- [5] L.D. McLerran and B. Svetitsky, Phys. Lett. B98 (1981), 195; J. Kuti, J. Polonyi and K. Szlachanyi, Phys. Lett. B98 (1981), 199; J. Engels, F. Karsch, I. Montvay and H. Satz, Phys. Lett. B101 (1981), 89.
- [6] R. Hagedorn, Nuovo Cimento 35 (1965), 395.
- [7] G.F. Chapline, M.H. Johnson, E. Teller and M.S. Weiss, Phys. Rev. D8 (1973), 4302.
- [8] J. Cleymans and K. Redlich, Phys. Rev. Lett. 81 (1998), 5284.
- [9] P. Braun-Munzinger, D. Magestro, K. Redlich and J. Stachel, Phys. Lett. B518 (2001), 41.
- [10] F. Karsch, E. Laermann and A. Peikert, Nucl. Phys. B605 (2001), 579.
- [11] Z. Fodor and S. Katz, JHEP 0203 (2002), 014.
- [12] C. R. Allton, S. Ejiri, S. J. Hands, O. Kaczmarek, F. Karsch, E. Laermann and C. Schmidt, Phys. Rev. D66 (2002), 074507.
- [13] Ph. deForcrand and O. Philipsen, Nucl. Phys. B642 (2002), 290.
- [14] S. Ejiri, C. R. Allton, S. J. Hands, O. Kaczmarek, F. Karsch, E. Laermann and C. Schmidt, hep-lat/0312006.
- [15] for a recent review on simulation techniques explored at non-zero baryon chemical potential see: A. Muroya, A. Nakamura, C. Nonaka and T. Takaishi, Prog. Theor. Phys. 110 (2003), 615.
- [16] Z. Fodor, S.D. Katz and K.K. Szabo, Phys. Lett. B568 (2003), 73.
- [17] C. R. Allton, S. Ejiri, S. J. Hands, O. Kaczmarek, F. Karsch, E. Laermann and C. Schmidt, Phys. Rev. D68 (2003), 014507.
- [18] S. Gottlieb, W. Liu, D. Toussaint, R.L. Renken and R.L. Sugar, Phys. Rev. Lett. 59 (1987), 2247.
- [19] F. Karsch, C. R. Allton, S. Ejiri, S. J. Hands, O. Kaczmarek, E. Laermann and C. Schmidt, hep-lat/0309116.
- [20] R.D. Pisarski and O. Alvarez, Phys. Rev. D26 (1982), 3735.
- [21] J. Fingberg, U. M. Heller and F. Karsch, Nucl. Phys. B392 (1993), 493; B. Beinlich, F. Karsch, E. Laermann and A. Peikert, Eur. Phys. J. C6 (1999), 133; J. Engels, F. Karsch, E. Laermann, C. Legeland, M. Lütgemeier, B. Petersson and T. Scheideler, Nucl. Phys. Proc. Suppl. 53 (1997), 420.
- [22] F. Karsch, K. Redlich and A. Tawfik, Eur. Phys. J. C29 (2003), 549.
- [23] F. Karsch, K. Redlich and A. Tawfik, Phys. Lett. B571 (2003), 67.
- [24] N. Ishii, H. Suganuma and H. Matsufuru, Phys. Rev. D66 (2002), 094506.