LTH 535 Cost of dynamical quark simulations: O() improved Wilson fermions††thanks: Contribution to panel discussion at “Lattice 2001”, Berlin
Abstract
I report on cost estimates and algorithmic performance in simulations using 2 flavours of non-perturbatively O() improved Wilson quarks together with the Wilson plaquette action.
Several collaborations have employed O() improved Wilson fermions, following the non-perturbative determination of the clover coefficient for flavours in the range [1]. UKQCD, QCDSF and JLQCD perform simulations on physically large volumes () using periodic boundary conditions [2, 3, 4], whereas ALPHA use Schrödinger functional (SF) boundary conditions on small volumes () [5, 6]. In the following I shall discuss the two types of simulations separately.
1 RESULTS FROM UKQCD & QCDSF
Run parameters for the UKQCD and QCDSF simulations are listed in Table I of [2] and Table 2 of [3], respectively. Additional runs, which are included here, have since been performed, and their details will be published elsewhere.
Integrated autocorrelation times, , for hadron masses, are poorly known. One therefore relies on estimated from the average plaquette, which shows an unexpected slight decrease for smaller quark masses (see Table II of [2]). Given the poor understanding of autocorrelation times, UKQCD have chosen a constant separation of 40 HMC trajectories between “independent” configurations for all data sets. Thus, any scaling of with the quark mass (or, equivalently, ) has not been folded into the cost analysis.
The number of operations per independent configuration is modelled according to
| (1) |
The available run data on provided by QCDSF are as yet not sufficient to constrain the dependence well enough, and hence we have used only, setting the coefficient equal to the value quoted in ref. [7], i.e. . The performance observed by QCDSF on is consistent with this value.
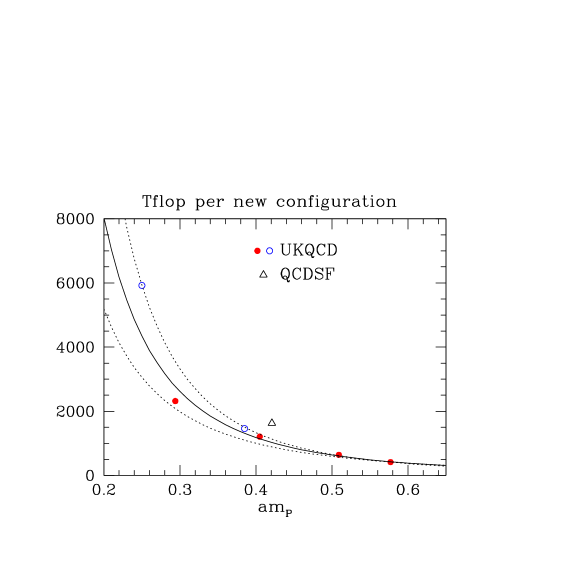
Fits to the prefactor and in eq. (1) were performed to the UKQCD subset of the data. Update times were converted into using the CRAY T3E’s sustained speed of 275 Mflops per processor (32bit and assembler). This yields
| (2) |
where the errors have been estimated by fitting different subsets of data points. The corresponding curves are shown in Fig. 1. The estimate for agrees with the value quoted in [7], whereas the prefactor in eq. (2) is roughly 10 times larger. The reason for this is so far unknown.
In order to estimate the CPU effort required to repeat the quenched benchmark for the light hadron spectrum [8], we assume that the smallest lattice spacing and quark mass each account for 50% of the total. Furthermore, using O() improvement implies that one can use larger lattice spacings without compromising the continuum extrapolations. The following estimates are based on 400 configurations on a smallest lattice spacing of , with , and a minimum pion mass of , corresponding to a dynamical quark mass :
| [Tflops years] | ||
|---|---|---|
| 0.17 | ||
| 0.12 | 250 | |
| 0.09 | 550 |
2 RESULTS FROM ALPHA
ALPHA simulate massless quarks on small volumes with SF boundary conditions. The box size is thus the only scale in the problem. In particular, the condition number of the fermion matrix is determined by , which implies that the rôle of in eq. (1) is taken over by . The appropriate cost formula for the SF is therefore
| (3) |
A detailed algorithmic study, including a cost analysis, has been published in [5]. ALPHA were able to extract precise autocorrelation data for the relevant observable, i.e. the running coupling in the SF scheme . For one finds that trajectories with a relative error of 5–10%.
ALPHA have used an alternative measure of the cost of their simulations. The quantity defined in eq. (3.1) of [5] is expected to differ from eq. (3) by an overall factor . Fig. 2, taken from [5], shows a plot of versus for . It suggests a scaling of (dashed line in Fig. 2), which implies in eq. (3).

The benchmark for ALPHA is the determination of the running of and the extraction of the -parameter. The results of [6] imply that lattice sizes of should be sufficient to determine the step scaling function for flavours with similar accuracy as in [9]. The total CPU effort is estimated to be of the order of 0.1 Tflops years, which is within reach on machines like APE1000. This estimate does not, however, include the computation of a low-energy scale such as for , which is necessary to express in physical units.
Acknowledgements I thank Alan Irving, Karl Jansen, Dirk Pleiter and Rainer Sommer for their help in preparing this contribution.
References
- [1] K. Jansen & R. Sommer, Nucl. Phys. B530 (1998) 185
- [2] UKQCD Collab. (C.R. Allton et al.), Phys. Rev. D65 (2002) 054502
- [3] QCDSF Collab. (H. Stüben), Nucl. Phys. Proc. Suppl. 94 (2001) 273
- [4] JLQCD Collab. (S. Aoki et al.), Nucl. Phys. Proc. Suppl. 94 (2001) 233; Nucl. Phys. Proc. Suppl. 106 (2002) 224
- [5] ALPHA Collab. (R. Frezzotti et al.), Comput. Phys. Commun. 136 (2001) 1
- [6] ALPHA Collab. (A. Bode et al.), Phys. Lett. B515 (2001) 49
- [7] T. Lippert et al., Nucl. Phys. Proc. Suppl. 83 (2000) 182.
- [8] CP-PACS Collab. (S. Aoki et al.), Phys. Rev. Lett. 84 (2000) 238
- [9] ALPHA Collab. (S. Capitani et al.), Nucl. Phys. B544 (1999) 669