Search for the Decay using
Abstract
We report on a search for the decay , carried out as a part of E799-II, a rare decay experiment at Fermilab. Within the Standard Model, the decay is dominated by direct CP violating processes, and thus an observation of the decay implies confirmation of direct CP violation. Due to theoretically clean calculations, a measurement of is one of the best ways to determine the CKM parameter . No events were observed, and we set an upper limit at the 90% confidence level.
pacs:
PACS numbers: 11.30.Er, 12.15.Hh, 13.20.Eb, 14.40AqThe decay is dominated by direct CP violating processes within the Standard Model through second order diagrams such as Z penguins [1]. Indirect CP violating and CP conserving contributions are expected to be highly suppressed [2, 3, 4, 5] for the following reasons. First order decay diagrams, which lead to relatively large indirect CP violation in , do not contribute to because of the absence of tree level flavor changing neutral current. Indirect CP violating contribution via second order diagrams is suppressed by five order of magnitude (). Long-distance indirect CP violating and CP conserving contributions from and intermediate states, which are significant in and , do not exist in because the neutrinos in the final state do not couple to virtual photons [6].
Following the Wolfenstein parametrization of the CKM matrix [7, 8], is proportional to . The uncertainty of the hadronic matrix element in is eliminated by the experimental measurement of and the lifetime of , which leads to an uncertainty of % in the expectation of . In addition, due to the small uncertainty (%) in the next-to-leading order QCD correction [9], gives direct access to . The current knowledge of the CKM parameters[10] allows us to predict to be [11]. The uncertainty comes directly from the input CKM parameters. As the theoretical calculations are unambiguous, an observation of the decay at the sensitivity of would indicate the existence of direct CP violation, and an observation outside the predicted range would indicate new physics [12].
It is experimentally difficult to search for because the signature is only an isolated . The current upper limit, at the 90% confidence level, was obtained by using decay [13]. We report on the search for in the Dalitz decay mode (, ) with the E799-II experiment using the KTeV detector at Fermilab. The data were collected in 44 days of running in 1997. Using the Dalitz decay of ’s made it possible to reconstruct decay vertex position of the ’s, allowing us to measure , the ’s momentum transverse to the beam direction. The played an important role in background suppression.
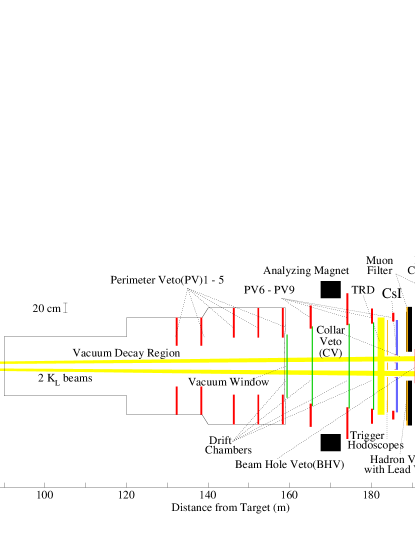
Figure 1 shows a plan view of the KTeV detector. The elements of the detector relevant to this search are described below. Kaons were produced by 800 GeV proton beam, with a typical intensity of protons per 19 sec beam pulse, that struck a 30 cm long beryllium-oxide target at a targeting angle of 4.8 mrad. In the first (second) half of the run period, two neutral side-by-side beams with a solid angle of 0.25 sr (0.35 sr) each were defined by collimators downstream of the target. A 7.6 cm long lead absorber was placed to reduce photons in the beams. A series of sweeping magnets removed charged particles in the beams. The two beams entered a 69 m long evacuated decay volume starting 90 m from the target. The vacuum was kept at torr. The downstream end of the volume was sealed by a vacuum window made of Kevlar and Mylar. The thickness of the vacuum window assembly was 0.0035 radiation lengths () in total [14]. The neutral beam was mainly composed of neutrons and ’s with other long lived neutral particles, such as ’s and ’s. The relative ratios of neutron, , and to at the beginning of the vacuum decay region were measured to be 3.5, 0.02 and , respectively. The average kaon momentum was 70 GeV/c. Approximately 3% of the kaons decayed inside the vacuum decay region.
The position and momentum of charged particles were measured using a spectrometer consisting of four drift chambers, two upstream and two downstream of a dipole analyzing magnet. The magnet had a momentum kick of 205 MeV/c. Each chamber consisted of two orthogonal views ( and ), and had approximately 100 m single-hit position resolution per view. An electromagnetic calorimeter with dimensions of 1.9 m 1.9 m and 27 in depth was used for photon detection and electron identification [15]. It was composed of 3100 pure CsI crystals. The calorimeter had two holes located near the center of the array to allow neutral beams to pass through. The energy resolution of the calorimeter was below 1% averaged over the electron energy range 2 to 60 GeV. A scintillator hodoscope was placed just upstream of the calorimeter for charged particle triggering. There were 8 Transition Radiation Detectors (TRD’s) between the spectrometer and the trigger hodoscope for e/ separation. The TRD’s consisted of polypropylene fiber mats as radiators and active MWPC volumes.
The hermetic photon veto system detected photons missing the fiducial area of the calorimeter. The system consisted of 3 sets of counters: perimeter vetoes (PV) 1-9, a collar veto (CV) and a beam hole veto (BHV). Each photon veto counter had a sandwich structure of lead (tungsten in the CV) and scintillator. The total depth of radiator was 16 for PV’s, 8.6 for CV, and 30 (equivalent to 1 nuclear interaction length) for BHV. The PV covered the outer part of the calorimeter and the fiducial volume. The CV was placed just upstream of the calorimeter and around the two beam holes. The BHV was located downstream of the calorimeter and in the neutral beam region. The BHV was segmented into two transverse sections (one per beam) and three longitudinal sections (10 each). The first longitudinal section was designed to detect photons, and the last one to detect neutrons. Downstream of the calorimeter, there was a 10 cm lead wall followed by a scintillator plane (hadron veto) to reject charged pions.
The trigger was designed to accept events with two electrons and a photon so that and decays were accepted. The decays were used to measure the number of decayed ’s. The trigger hodoscope and drift chambers were used to select two charged track events. The calorimeter was required to have an energy deposit greater than 18 (24) GeV in the first (second) part of the running period. Events with significant energy in the photon or hadron vetoes were rejected. Events with three or four clusters in the calorimeter with a minimum energy of 1 GeV were selected by the hardware cluster counting system [16]. The TRD pulse height information was used to identify electrons at trigger level.
The strategy in offline selection was to identify decays by reconstructing the invariant mass () and selecting high events in order to suppress backgrounds. The cut was used because ’s from have a higher kinematic limit than those from most of background processes.
In order to avoid human bias in the determination of selection criteria, a blind analysis was performed. A masked region was defined in the vs plane as and . Monte Carlo (MC) simulation was used to optimize all cuts while data within the masked region were hidden.
The offline event selection began with the identification of decays by requiring . There were five categories in the remaining backgrounds such as: (); ; hyperon decays; and ; beam background. Below we describe the cuts to suppress each background.
One serious background was decays where a photon was radiated from the electron or overlapped accidentally, and the pion was misidentified as an electron. Electrons were selected by requiring where is the energy deposited in the calorimeter and is the momentum measured by the spectrometer. This cut was 94% efficient for detecting both electrons and 0.4% for a pion. The transverse shower shape at the calorimeter was also used to distinguish electrons from pions. The confidence level to identify pions formed from the 8 TRD’s was required to be less than 1%, which gave a 95.0% efficiency for electrons. Events with out-of-time accidental energy in the calorimeter were rejected. The photon energy was required to be greater than 3 GeV because accidental and radiated photons typically have lower energy. Dalitz decays, which favor low , were selected by requiring , where is the invariant mass of the electron pair. Defining as the angle between a photon and a positron (electron) in the kaon rest frame, was required to be less than -1.5, because and in semileptonic decays prefer a wide opening angle, thus a peak of zero in the distribution. These two kinematic cuts rejected 99.6% of events with a signal efficiency of 78%.
Backgrounds involving decays with unreconstructed charged particles, such as , were suppressed by eliminating events with more activity in the drift chambers than expected from two charged track events.
High momentum ’s and ’s could reach the decay region in spite of their short life time. Decays of these hyperons could lead to backgrounds such as and , because of undetected neutrons. These backgrounds were reduced by requiring the position, or decay distance from the target, to be greater than 120 m. Since hyperons decaying in the decay region had higher energy than kaons, typically 200 to 300 GeV/c, events with photon energy greater than 50 GeV were rejected. In order to suppress backgrounds with neutrons such as , the energy deposited to the third segment of BHV was required to be less than 200 minimum ionizing particles equivalent. This cut was applied only for the side of BHV when the decay vertex was found in the region to minimize the signal loss due to accidental activity.
The and backgrounds were suppressed by the photon veto system. The thresholds for measured photon energy were set to 200 MeV for PV1 and PV2, 250 MeV for PV3, 100 MeV for the rest of PV’s, 1 GeV for CV, and 5 GeV (8.5 GeV) for the first section of BHV on the same (opposite) side as the reconstructed decay position. The electromagnetic calorimeter was also used as a part of the photon veto system. The number of clusters with energy greater than 1 GeV was required to be three, and events with extra clusters with energy greater than 250 MeV were rejected. The photon veto requirements rejected 99.5% of and over 99.99% of events, while 41% of the signals, as measured by events, was lost. Most of the signal loss arose from the BHV, because the high rate neutral beams (13 MHz and 44 MHz neutron) struck the BHV.
Another background was associated with ’s produced by beam interactions with detector materials, primarily the vacuum window. Figure 2 shows the vs distribution for data. There was a cluster of events at m, the location of the vacuum window. To reject such events, the decay vertex position in was required to be less than 150 m.
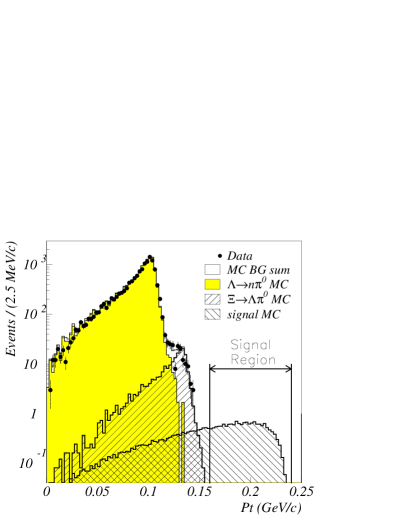
The remaining backgrounds were primarily from hyperon decays, which had a well-reconstructed decay in the fiducial region. These were rejected by requiring to be as shown in Figure 3. The cut on the high end was determined from the kinematic limit of decays, allowing for resolution. The main peak arose from , and the shoulder at 135 MeV/c was from . The MC events were normalized by the absolute number of decayed ’s, ’s and ’s. With this absolute normalization, the agreement between data and MC distributions is excellent. Combining and cuts, the efficiency for was less than , and to for the other decay backgrounds, while the signal efficiency was 46%.
In order to verify the MC simulation and our understanding of the backgrounds, events around the masked region were compared between data and MC as shown in Figure 4. The region (f), which had the largest discrepancy of all the regions, had a Poisson probability of 5.6% for observing 10 events when 6.5 events were expected. The good agreement between the expectation and the data in both the shape and the number of events validates the Monte Carlo simulation and our understanding of the backgrounds. Even if one or more of the cuts is relaxed, the agreement is still excellent.
Using the MC, the background levels except for those from beam interactions were estimated and summarized in Table I. In the case of backgrounds associated with beam interactions, the sideband data were used for the estimation. Using the shape of the tail in the distribution for the 240 MeV/c region, as shown in Figure 2, the contamination of backgrounds to the signal region was expected to be 0.04 events (no correlation between and was found). In total, background events were expected.
The signal acceptance for ’s decaying between 90 m and 160 m from the target and with a momentum range of 20 to 220 GeV/c was calculated from MC to be 0.152%. The acceptance for was similarly calculated to be 0.815%. The single event sensitivity (SES) of this search can be expressed as:
where , , and represent the acceptance, the number of observed events and the branching ratio of each mode, respectively. Based on the above equation with an observed number of events of 15951 and a branching ratio of [17], the SES was calculated to be , where the sources and sizes of the errors are summarized in Table II. The uncertainties on branching ratios of and contributed a large part of the systematic error.
Finally, we examined the signal region and found no events. Since no signal events were observed, the 90% confidence level upper limit on the branching ratio was determined to be .
We define “background limit” as SES multiplied by the number of expected backgrounds. This figure of merit shows the experimental potential for rare decay searches because it takes account not only a SES but also an expected background level. The “background limit” in this search is . This is a factor of 49 lower than the “background limit” of reference [13], in which the SES is with an expectation of 3.7 background events. Even with this better technique, direct CP violation has not been observed in this mode. To observe the at the Standard Model level, a search with four orders of magnitude better “background limit” will be required.
We gratefully acknowledge the support and effort of the Fermilab staff and the technical staffs of the participating institutions for their vital contributions. This work was supported in part by the U.S. Department of Energy, The National Science Foundation and The Ministry of Education and Science of Japan. In addition, A.R.B., E.B. and S.V.S. acknowledge support from the NYI program of the NSF; A.R.B. and E.B. from the Alfred P. Sloan Foundation; E.B. from the OJI program of the DOE; K.H., T.N. and M.S. from the Japan Society for the Promotion of Science.
REFERENCES
- [1] L.S. Littenberg, Phys. Rev. D39, 3322(1989).
-
[2]
J.S. Hagelin and L.S. Littenberg,
MIU-THP-89/039(1989). - [3] G. Buchalla and G. Isidori. hep-ph/9806501(1998).
- [4] J.L. Ritchie and S.G. Wojcicki, Rev. Mod. Phys. 65, 1149(1993).
- [5] K. Hanagaki, PhD thesis, Osaka University, 1998.
- [6] D. Rein and L.M. Sehgal, Phys. Rev. D39, 3325(1989).
- [7] M. Kobayashi and T. Maskawa, Prog. Theory. Phys. 49, 652(1973); N. Cabibbo, Phys. Rev. Lett. 10, 531(1963).
- [8] L. Wolfenstein, Phys. Rev. Lett. 51, 1945(1983).
- [9] G. Buchalla and A.J. Buras, Nucl. Phys. B398, 285(1993); G. Buchalla and A.J. Buras, Nucl. Phys. B400, 225(1993); A.J. Buras, Phys. Lett. B333, 476(1994).
- [10] P. Paganini, F. Parodi, P. Roudeau, and A. Stocchi. hep-ph/980229(1998); A.J. Buras, hep-ph/9711217(1997).
- [11] C. Dib, I. Dunietz and F.J. Gilman, Mod, Phys. Lett. A6, 3573(1991); A.J. Buras, Phys. Lett. B333, 476(1994); W.J. Marciano and Z. Parsa, Phys. Rev. D53, R1(1996); G. Buchalla and A.J. Buras, Phys. Rev. D54, 6782(1996).
- [12] Y. Grossman and Y. Nir, Phys. Lett. B398, 163(1997); T. Hattori, T. Hasuike, and S. Wakaizumi, hep-ph/9804412(1998).
- [13] J. Adams et al., Phys. Lett. B447, 240(1999).
- [14] E.D. Zimmerman, Nucl. Inst. and Meth. A426, 229(1999).
- [15] A. Roodman, in Proceedings of the Seventh International Conference on Calorimetry in High Energy Physics, edited by E. Cheu et al. (World Scientific, Singapore, 1998), p. 89.
- [16] C. Bown et al., Nucl. Inst. and Meth. A369, 248(1996).
- [17] Particle Data Group, European Phyical Journal C3, 1(1998).


| Decay mode | Expected number of events |
|---|---|
| Total |
| Source of Error | Size(%) |
| Statistical error | 0.79 |
| 5.5 | |
| 2.7 | |
| MC statistics | 0.81 |
| Drift Chamber inefficiency | 1.89 |
| Energy measurement | 0.80 |
| Momentum measurement | 0.07 |
| TRD efficiency | 1.88 |
| Total of systematic error | 6.78 |