Measurement of the 1s-2s energy interval in muonium
Abstract
The 1s-2s interval has been measured
in the muonium () atom by Doppler-free two-photon laser spectroscopy.
The frequency separation of the states was determined to be 2 455 528 941.0(9.8) MHz
in good agreement with quantum electrodynamics.
The muon-electron mass ratio can be extracted and is found to be 206.768 38(17).
The result may be interpreted as measurement of the muon-electron charge
ratio as .
pacs:
36.10.-k,32.30.-rWe report a high precision laser measurement of the 1s-2s interval in muonium [1, 2, 3]. The hydrogen-like muonium atom (M=) consists of leptons from two different particle generations, an antimuon () and an electron () [4]. The energy levels of the atom can be calculated to the required accuracy within the framework of bound state quantum electrodynamics (QED) [5, 6]. From high energy electron-positron scattering experiments it is known that leptons have no internal structure down to dimensions of m and may therefore be considered point-like objects [7]. Unlike in the natural atoms or in hydrogen-like systems, which contain at least one hadron, there is no complication in the theoretical description of M associated with the finite size and the internal structure of its constituent particles [8, 9]. Contributions arising in weak interaction from Z boson exchange, and from strong interaction due to vacuum polarisation loops containing hadrons, are well understood. Furthermore, precision measurements of electromagnetic transitions promise accurate values for fundamental constants. In addition, the M atom is an ideal system for testing standard theory [1, 10], fundamental symmetries in physics and to search for yet unknown interactions [11].
The M formation techniques available at present favour the production of atoms in the 1s state. For this reason the ground state hyperfine structure interval [10] and the 1s-2s interval [1] have been measured with highest accuracy. The muon lifetime of 2.20 s limits the natural line width of both transitions to 145 kHz (FWHM).
The M 1s-2s transition offers a clean determination of the muon mass which is required for the interpretation of experiments on the muon magnetic anomaly [12] and for a determination of the weak interaction Fermi coupling constant GF from upcoming measurements of the muon lifetime [13]. Neglecting hyperfine structure, the theoretical value for the 1s-2s interval is (theory) = 2 455 528 935.4(1.4) MHz [5, 6, 14] and is mainly determined by the well known Rydberg constant [15]. There is a significant 1.187 THz (4800 ppm) contribution from the reduced mass of the system. The accuracy of the theoretical value of (theory) is dominated by the present knowledge of the muon mass to 120 ppb [10]. The QED corrections amount to 7056 MHz (2.9 ppm) and are known to 20 kHz (0.008 ppb) [14]. They differ from those in atomic hydrogen (H) and deuterium (D), where they have been verified to very high accuracy, through muon mass dependent terms. Here the largest such effect is 18.1 MHz due to relativistic recoil [5, 6].
The ,F=1–,F=1 two-photon transition in M was excited Doppler-free with two counter-propagating laser beams. The experiment was performed using the intense pulsed muon source at the ISIS synchrotron of the Rutherford Appleton Laboratory (RAL) in Chilton, UK. The accelerator operates at 50 Hz repetition rate and provides in its DEVA beam area 3500 per pulse at p=26.5 MeV/c momentum and p/p=10% momentum bite. Muonium atoms were formed by electron capture after stopping the muons close to the surface of a target of SiO2 powder (Cabosil M5, Cabot Company). About 80 atoms per pulse left the target through its surface. They have a thermal Maxwell Boltzmann velocity distribution with an average velocity =7.4(1) corresponding to 296(10) K [16]. The M production was monitored continuously by detecting positrons from the decay in M atoms in vacuo with a telescope consisting of two proportional wire chambers each with two planes of orthogonally oriented wires [16]. The atoms interacted 8 mm above the target surface with pulsed laser light at 244 nm wavelength. This beam was reflected 5 times back and forth between two mirrors to enhance the overlap with the atom cloud. A third mirror directed the beam back onto itself. On average there were 1.5(5) M atoms in the laser beam per pulse.
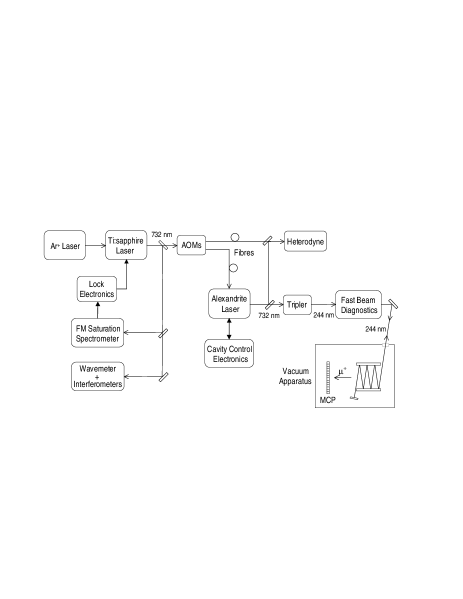
The required UV light was generated by frequency tripling the output of a solid state pulsed laser system (Fig. 1) . The first stage is an Ar-ion pumped cw Ti:sapphire laser (Microlase MBR-110). At the fundamental wavelength of = 732 nm it produced a beam with 0.5 MHz bandwidth and 500 mW output power. The cw laser frequency was offset stabilised by double passing an acousto-optic modulator (AOM) to a hyperfine component of an R-branch line in 127I2. This was observed by Doppler-free frequency modulation spectroscopy of thermally excited iodine vapour enclosed in a hot cell (650∘C) with a cold finger at 39∘C. Suitable iodine reference lines were identified [17] and their frequencies have been calibrated for M ( component of the 5-13 R(26) line) and D ( components of the 5-12 R(137) line) in preparation for this experiment in collaboration with the National Physical Laboratory in Teddington, UK [18].
In the following stage an alexandrite ring laser amplifier (Light Age PAL-101/PRO) was seeded with 3.5 mW of cw light. In order that the output pulse should coincide in time with the presence of M atoms, the Q-switch was opened at a fixed point in the accelerator cycle, and a cavity length control system was developed [19] to ensure resonance with the cw seed at this time. When the laser was operated at 1.2 times threshold inversion, seeded, single longitudinal mode, TEM00, output pulses were produced on more than 95% of shots, typically of 35 mJ energy and 125 ns pulse length, at 25 Hz. The heterodyne beat of the two lasers was recorded using fractions of each beam brought together on a fast photodiode (Hamamatsu S2381), with the cw frequency shifted by 200 MHz. The high mode purity enabled clean records to be obtained, as shown in Fig. 2. These signals, together with the time dependent intensity, were digitised for every laser pulse, using 1 GHz (DL515, home made) VME flash ADC systems. At the 732 nm wavelength of this experiment, changes in the refractive index of the alexandrite rods during the pulse, due to inversion depletion [19], were large enough to produce a chirp swing of up to 120 MHz in the instantaneous frequency, if not corrected. By applying fast high voltage ramps to a pair of electro-optic modulators [20] in the cavity the chirp swing was reduced to 6.5 MHz, with a 3.4 MHz wide distribution. The pulse to pulse distribution of the average chirp was set close to zero with a spread of 7 MHz.
In the final stage, two 15 mm long lithium triborate (LBO) crystals were used to frequency double with minimum walk-off the output of the alexandrite laser. Mixing with the residual fundamental radiation in a 12 mm long -barium borate (BBO) crystal then gave the frequency tripled output at 244 nm. Pulse energy was 3.3 mJ and length 86 ns, on average, and the spatial profile retained the smooth Gaussian character of the input. After expansion in a telescope, the beam was sent some 10 m to the interaction region, where its rms radius was 0.6(2) mm. The profile of the outgoing and the retro reflected beams (Fig.1) were recorded on every shot using a 128128 pixel photodiode array (EG&G, Reticon RA0128N). The UV light frequency could be varied by setting the AOM frequency to any value within a 60 MHz interval.
The 1s-2s transition was detected through the photoionisation of the excited 2s state in the same laser field. The muon released in this process was electrostatically accelerated to 2 keV energy in a pulsed, two-stage device, which was turned on 50 ns after the end of every laser pulse. When the laser was on, the residual electric field in the fiducial volume was kept below 5 V/cm which limited a possible dc Stark effect to below 120 kHz. The muons were guided along a 1.66 m long path through a 90∘ electrostatic mirror and a 90∘ bending magnet, onto a microchannel plate detector (MCP). The transport system was mass selective and had a 7% momentum range. The MCP was surrounded by scintillation detector telescopes covering 94% solid angle for detecting the positrons from muon decays as part of an event signature. The muon detector was shielded by a 10 cm thick lead enclosure and provided less than 2.8 background counts per day in the expected 74 ns wide time of flight window for the muons. This time interval corresponds to 6 standard deviations of the muon time of flight distribution, which had an average of 1.16 s. The number of MCP counts as a function of laser frequency represents the atomic signal.
For the M measurements 25 preselected values of the AOM frequency were chosen. Every minute one of them was randomly chosen. In total 3 million laser shots were fired which produced a seeded pulse with a chirp swing below 15 MHz. Altogether 99 events were found (Fig. 3). To obtain the theoretical line shape, we calculated numerically for a randomly selected sample of 20% of all the laser pulses the probability for a resonant ionisation event using a line shape theory which is based on a density matrix model. This allows the inclusion in each case of the recorded time dependent phase shift, the intensity and the beam cross section for the laser light; details are given in reference [21, 22]. We verified that the remaining 80% and all the pulses which produced an event had the same average distributions for chirp, chirp swing, intensity and spatial profiles. The signal amplitude was obtained from matching the integrals over the experimentally observed and the theoretically predicted line shapes. The line centre was obtained using the maximum likelihood fitting procedure for a Poisson distribution [23] with the line centre as the only free parameter. Data were recorded and analysed for two different M production targets within 34 hours of actual running. When both data sets were treated independently the line centres agreed within 3.7(9.5) MHz; the statistical significance of both independent results can be verified in a Kolmogorov-Smirnov test which gives a significance level of 99% and 44% respectively.
From the measured line centre frequency (Table I) deductions of 976.4 MHz for hyperfine structure and of 0.8 MHz for the second order systematic Doppler shift were made. The result is (expt.) = 2 455 528 941.0(9.8) MHz for the centroid 1s-2s transition frequency. The contributions to the uncertainty are 9.1 MHz from statistics and 3.7 MHz due to randomly distributed systematic shifts which include a 0.84 MHz calibration uncertainty of the I2 lines, 0.5 MHz due to frequency locking stability and a 3.4 MHz uncertainty caused by the residual linear Doppler shift due to the finite crossing angle of less than 55 rad between the counter propagating laser beams and 1.2 MHz from the estimated accuracy of the line shape calculations.
The experimental setup has been tested and the analysis procedures were verified using measurements of the two hyperfine components of the 1s-2s transition in D (Fig.4). The atoms were produced in a 99.99% He and 0.01% D2 gas discharge and guided into the interaction region with a teflon tube. For this isotope, the density can be kept low enough at mbar residual gas pressure to avoid detector saturation and significant line shape distortion. A transition frequency was obtained (see Table I) in very good agreement with theory and previous cw laser experiments. The dominant uncertainty arises from the calibration of the relevant I2 line. The M–D isotope shift in the 1s-2s transition is = 11 203 456.2(13.1) MHz, where the uncertainty is to equal parts due to statistics in the M transition and the calibration of the iodine reference line for D.
Our experimental value of agrees well with (theory) and with earlier less accurate experiments [1, 2, 3], the accuracy of which had been affected strongly by laser amplifier chirp effects [20]. The Lamb shift contribution to has been extracted to = 7 049.4(9.9) MHz; this is the most precise experimental Lamb shift value for M available today. From a comparison between experimental and theoretical values for we deduced the muon-electron mass ratio as = 206.768 38(17) in agreement with = 206.768 277(24) from the most recent determination of the muon magnetic moment [10].
For hydrogen-like systems the leading order for the gross structure energy is proportional to where Z is the nuclear charge in units of the electron charge and is the fine structure constant. By comparing (expt.) and (theory) we found for the - charge ratio . This is the best verification of charge equality in the first two generations of particles. We note that the existence of one single fundamental quantised unit of charge is solely an experimental fact for which no associated underlying symmetry has yet been revealed.
Our reported measurement here was statistics limited. In future the accuracy of the 1s-2s transition frequency could be improved using the novel technology employed here, with extended running and by a more restrictive selection for laser pulses with low chirp swing. Significant progress could be expected from a cw laser experiment which could be performed with higher numbers of M atoms produced by high flux muon beams which may become available at planned future accelerator sites such as a Japanese Hadron Facility, the Oak Ridge Spallation Source and the front end of a muon collider.
We would like to acknowledge the support from the German BMBF, the EPSRC of the United Kingdom, the American NSF, the European INTAS and NATO. The support from RAL staff members and the very stable performance of the ISIS accelerator were essential for the success of the experiment. We thank K. Pachucki and S. Karshenboim for sharing with us their latest knowledge on the status of the theory and J. Walling of Light Age Inc. and J. Hares of Kentech Ltd. for technical advice.
REFERENCES
- [1] F. Maas et al., Phys. Lett. A 187, 247 (1994)
- [2] K. Jungmann et al., Z. Phys. D21, 241 (1991)
- [3] S. Chu et al. Phys. Rev. Lett. 60,101 (1988); K. Danzmann et al., Phys. Rev. A39, 6072 (1989)
- [4] V.W. Hughes and G. zu Putlitz, in: Quantum Electrodynamics, T. Kinoshita (ed.), World Scientific, p. 822 (1990)
- [5] K. Pachucki et al., J. Phys. B 29, 177 (1996)
- [6] S. Karshenboim, Z. Phys. D 39, 109 (1997); see also: hep-ph/9712347 (1997)
- [7] H.U. Martyn, in: loc.cit. [4], p. 92
- [8] M.G. Boshier et al., Comm. At. Mol. Phys. 33, 17 (1996)
- [9] A. Huber et al., Phys. Rev. Lett.80, 468 (1998); see also: S. Bourzeix et al., Phys.Rev.Lett. 75, 384 (1996) and D. Berkeland et al. Phys. Rev. Lett. 75, 2470 (1995)
- [10] W. Liu et al., Phys. Rev. Lett. 82, 711 (1999)
- [11] L. Willmann et al., Phys. Rev. Lett. 82, 49 (1999)
- [12] R.M. Carey et al, Phys. Rev. Lett. 82, 1632 (1999)
- [13] K. Nagamine et al., experiment at RIKEN RAL muon facility; see also: J. Kirkby et al., PSI experiment R-99-06; R. Carey et al., PSI experiment R-99-07
- [14] S. Karshenboim and K. Pachucki, priv. com. (1999)
- [15] C. Schwob et al., Phys. Rev. Lett.82, 4960 (1999); see also: E.R. Williams et al., Phys. Rev. Lett. 81, 2404 (1998) and Th. Udem et al., Phys. Rev. Lett.79, 2646 (1997)
- [16] K.A. Woodle et al., Z. Phys. D 9, 59 (1988); see also: A.C. Janissen et al., Phys. Rev. A42, 161 (1990);
- [17] I. Lane et al. publication in preparation (1999)
- [18] S.L. Cornish et al., publication in preparation (1999); and S.A. Bagayev et al., publication in preparation (1999)
- [19] P. Bakule et al., publication in preparation (1999)
- [20] I. Reinhard et al., Appl. Phys. B 63 , 467 (1996)
- [21] V. Yakhontov and K. Jungmann, Z. Phys. D38, 141 (1996)
- [22] V. Yakhontov, R. Santra and K. Jungmann, J. Phys. B 32, 1615(1999)
- [23] S. Brandt, Statistical and Computational Methods in Data Analysis, North Holland, Amsterdam (1976)
| muonium | deuterium | |||||
| Frequency | stat. uncert. | system. uncert. | Frequency | stat. uncert. | system. uncert. | |
| AOM and Lock Offset | ||||||
| +Stability of Lock | ||||||
| Uncert. Line. Calc. | ||||||