{Authlist} The CHORUS Collaboration
The present results on the oscillation search by the CHORUS experiment at CERN are summarized. A fraction of the neutrino interactions collected in 1994-1997 has been analysed, searching for charged current interactions followed by the lepton decay into a negative hadron, electron, or into a muon. A sample of 126,229 events with an identified muon in the final state and 19,436 events without an identified muon in the final state have been located in the emulsion target. Within the applied cuts, no candidate has been found. This result leads to a 90% C.L. limit on the mixing probability. A exclusion plot is also presented corresponding to 90% C.L. limit on the mixing probability of .
\submittedContributed paper to the XIX International Symposium on Lepton and Photon Interactions at High Energies
9-14 August 1999, Stanford University, USA
The CHORUS experiment has recently reported [1, 2, 3] a limit on oscillation obtained by the analysis of a subsample of neutrino interactions, taken in 1994-1996, both with and without an identified in the final state. This paper contains an update of the statistics of the subsample of events with an identified in the final state.
The experimental setup and the characteristics of the CERN wide band neutrino beam are summarized in [1] and described in more detail in [4].
1 The apparatus
The CHORUS apparatus combines a 770 kg nuclear emulsion target with various electronic detectors : a scintillating fibre tracker system, trigger hodoscopes, an air-core magnet, a lead/scintillator calorimeter and a muon spectrometer.
Details about the experimental setup and the performances of the sub-detectors can be found in [4].
2 Data collection and event selection
In the 1994-1997 period, CHORUS has collected 2,271,000 triggers corresponding to protons on target. Of these, 458,601 have a muon identified in the final state (the so-called events) and 116,049 do not (the so-called events) and a vertex position compatible with one of the four emulsion target stacks.
All tracks, associated to the interaction vertex, with an angle smaller than 0.4 rad from the beam axis and bigger than 0.05 rad from the direction of a secondary beam nearby are selected for further analysis. The second requirement avoids possible confusion arising from the large emulsion background of muons originating from this beam. The selected tracks are searched for in the emulsion if their charge is negative and their momentum is in the range GeV/c and GeV/c for hadrons and muons, respectively.
It should be noted that the energy deposition in the calorimeter has not been used to select electrons or unidentified muons. However the small contribution of the leptonic decay modes to the data sample is taken into account in the evaluation of the sensitivity.
| 1994 | 1995 | 1996 | 1997 | |
|---|---|---|---|---|
| Protons on target | ||||
| Emulsion triggers | 422,000 | 547,000 | 617,000 | 719,000 |
| to be scanned | 66,911 | 110,916 | 129,669 | 151,105 |
| to be scanned | 17,731 | 27,841 | 32,548 | 37,929 |
| scanned so far | 46,169 | 52,130 | 98,548 | 108,796 |
| scanned so far | 10,639 | 13,364 | 23,760 | 19,344 |
| vertex located (in the 33 most upstream plates) | 19,581 | 21,809 | 38,919 | 45,920 |
| vertex located (in the 33 most upstream plates) | 3,491 | 4,023 | 6,758111For 1996 and 1997 the decay search on 0 is not yet finished and the relative statistics are not included in the current limit | 5,164111For 1996 and 1997 the decay search on 0 is not yet finished and the relative statistics are not included in the current limit |
3 Scanning procedure
3.1 Vertex location
The various steps leading to the plate containing the vertex by means of fully automatic microscopes are identical to those described in [1, 2]. They are applied to the muon for the events and to all the negative tracks for the events. Each track is searched for in the interface emulsion sheets positioned between the scintillating fibre tracker detector and the target emulsion stack. The found tracks are then followed upstream in the target emulsion, using track segments reconstructed in the most upstream 100 m of each plate, until the track disappears. This plate is referred to as the vertex plate, since it should contain the primary neutrino vertex or the secondary (decay) vertex from which the track originates. The three most downstream plates of each stack are used to validate the matching with the interface emulsion sheets and are not considered as possible vertex plates. The scanning results are summarized in Table 1. The mean efficiency of this scan-back procedure is found to be for events and for events. A detailed simulation of the scanning criteria shows that the difference mainly reflects the poorer quality of the hadron track predictions at the interface emulsion sheets, due to the difficulty of reconstruction inside a dense hadronic shower and the larger multiple scattering owing to the lower average momentum.
3.2 Decay search
Once the vertex plate is defined, automatic microscope measurements are performed to select the events potentially containing a decay topology (kink). Different algorithms have been applied, as a result of the progress in the scanning procedures and of the improving performance in speed of the scanning devices. They are described in [1, 2] and briefly recalled here.
In the first procedure, the event is selected either when the scan-back track has a significant impact parameter with respect to the other predicted tracks or when the change in the scan-back track direction between the vertex plate and the exit from the emulsion corresponds to an apparent transverse momentum, , larger than 250 MeV/c. For the selected events and for those with only one predicted track, digital images of the vertex plate are recorded and are analysed off-line for the presence of a kink.
The second procedure is restricted to the search of long decay paths. In this case the vertex plate is assumed to contain the decay vertex of a charged parent particle produced in a more upstream plate. With this procedure only kink angles larger than 0.025 rad are detected.
For the events selected by either one of these procedures, a computer assisted eye-scan is performed to assess the presence of a secondary vertex and measure accurately its topology. A decay candidate must satisfy the following criteria:
-
1.
the secondary vertex appears as a kink without black prongs, nuclear recoils, blobs or Auger electrons;
-
2.
the transverse momentum of the decay muon (hadron) with respect to the parent direction is larger than 250 MeV/c (to eliminate decays of strange particles);
-
3.
the kink, in the channel, occurs within three plates downstream from the neutrino interaction vertex plate. Because of the lower background, the kink search in the muonic decay channel was extended to five plates, with a gain in efficiency of about 8%.
No decay candidate has been found satisfying the selection criteria.
4 Experimental check of the kink finding efficiency
The kink finding efficiency, , has been evaluated by Monte Carlo simulation and experimentally checked looking at hadron interactions and dimuon events.
On a sample of about 55 m of hadron tracks scanned in emulsion 21 neutrino interaction events with a hadron interaction have been detected within the applied cuts during the decay search procedure. This result is in good agreement with the expected value of () from Monte Carlo simulation.
Part of the dimuon sample (two muons in the final state) collected in 1995 and 1996 has been analysed searching for the reaction with the subsequent muonic decay of the . Assuming a charm yield of about , in the sample scanned we expect dimuon events and we found 25 events. This result shows that Monte Carlo simulation and real data are in good agreement. Although the number of events is too low to draw quantitative conclusions, we can take these results as qualitative checks of the simulation of the automatic scanning procedure.
5 Sensitivity and backgrounds
In this section we discuss the expected background from known sources and, in absence of candidates, we derive limits on the and oscillation parameters. Both signal efficiencies and background estimation have been evaluated from large samples of events, generated according to the relevant processes and passed through a GEANT [5] based simulation of the detector response. The output is then processed through the same reconstruction chain as used for data. The simulated tracks in emulsion are used to estimate the efficiencies of each scanning step. Apart from the kink detection efficiency, only ratios of acceptances enter the calculation of the experimental result and most of the systematic uncertainties of the simulation cancel out.
5.1 Background estimates
The main source of potential background in the muonic channel is the charm production. We expect less than 0.2 events in the current sample from the anti-neutrino components of the beam:
followed by
in which the escapes the detection or is not identified.
The sources of background for the hadronic decay channel are:
-
•
the production of negative charmed particles from the anti-neutrino components of the beam. These events constitute a background if the primary or remains unidentified. Taking into account the appropriate cross-sections and the branching ratios, in the present sample we expect events from these sources;
-
•
the production of positive charmed mesons in charged current interactions, if the primary lepton is not identified and the charge of the charmed particle daughter is incorrectly measured. We expect events from this source in the present sample;
-
•
the associated charm production both in charged (when the primary muon is lost) and neutral current interactions, when one of the charmed particles is not detected. The cross-section for charm-anticharm pair production in neutral current interactions relative to the total charged current cross-section has been measured [6] to be . The production rate of associated charm in charged current interactions is unknown, but an upper limit is available ( [6]). In the present sample, the estimated background from this process represents events;
-
•
the main background to the hadronic decays is due to so-called hadronic “white kinks”, defined as 1-prong nuclear interactions with no heavily ionizing tracks (black and grey tracks in emulsion terminology) and no evidence for nuclear break up (evaporation tracks, recoils, blobs or Auger electrons). Published data allowing to determine the white kink interaction cross-section are scarce [7, 8]. In a dedicated experiment with 4 GeV pions at KEK [7], a very steep fall-off in was observed and only 1 out of 58 observed kinks had a larger than 300 MeV/c. Since the experimental information of the dependence is statistically poor at large values, a Monte Carlo simulation, based on a modified version of FLUKA [9, 10], has been performed. The results of this simulation are in good agreement with the dependence of the KEK measurement. An effective white kink mean free path in emulsion, m, is obtained for a cut at 250 MeV/c, using the pion energy spectrum as observed in the 0 sample. The above result is compatible with the 4 observed events with 250 MeV/c, at all distances from the primary vertex, along a total path of m of scan-back tracks. This corresponds to a background estimate of 0.5 events within three plates downstream from the primary vertex for the 0 sample of 1994 and 1995. The analysis on the larger statistics now available is in progress. From the study of the events with long apparent decay length we will be able to determine, in a way largely free of systematics, the number of expected events with a kink within three plates from the primary vertex. In addition, the different kinematical properties of this background with respect to the signal can be used, if necessary, to discard these events without spoiling the sensitivity of the experiment.
The prompt contamination of the beam [11] is a background common to both the hadronic and muonic decay channels. For the present sample the expected background is less than 0.1 events.
5.2 Sensitivity to the oscillation
In the approximation of a two-flavour mixing scheme, the probability of appearance in an initially pure beam can be expressed as
where
-
-
is the incident neutrino energy;
-
-
is the neutrino flight length to the detector;
-
-
is the effective mixing angle;
-
-
is the difference of the squared masses of the two assumed mass eigenstates;
-
-
is the fraction of with energy originating at a distance between and from the emulsion target.
The channels considered in the oscillation search we describe in this paper are:
1) , 2) , 3) and 4) (the is not identified) channels.
The expected number, (), of observed decays into a channel of branching ratio is then given by
| (1) |
with
With proper averaging (denoted by ), can also be written as a function of :
| (2) |
where
-
-
(the number of located charged current interactions corresponding to the considered event sample) and (the product of and the relative fraction of the 0 sample for which the analysis has been completed);
-
-
. It takes into account quasi-elastic interactions, resonance production and deep inelastic interactions ();
-
-
(); -
-
is the average efficiency of the decay search procedure for the accepted events ().
To allow an easy combination of the results from the 1 and 0 event samples, it is useful to define the “equivalent number of muonic events” of the 0 sample as
| (3) |
The 90% C.L. upper limit on the oscillation probability then simplifies to
| (4) |
where and .
In the above formula, the numerical factor 2.38 takes into account the total systematic error (17%) following the prescription given in [13]. The systematic error is mainly due to the uncertainty of the Monte Carlo simulation of the scanning procedures.
The estimated values of the quantities appearing in this expression are given in Table 2. No statistical errors are quoted since they are much smaller than the systematic uncertainty.
Using the present sample the following 90% C.L. limit is obtained
| (5) |
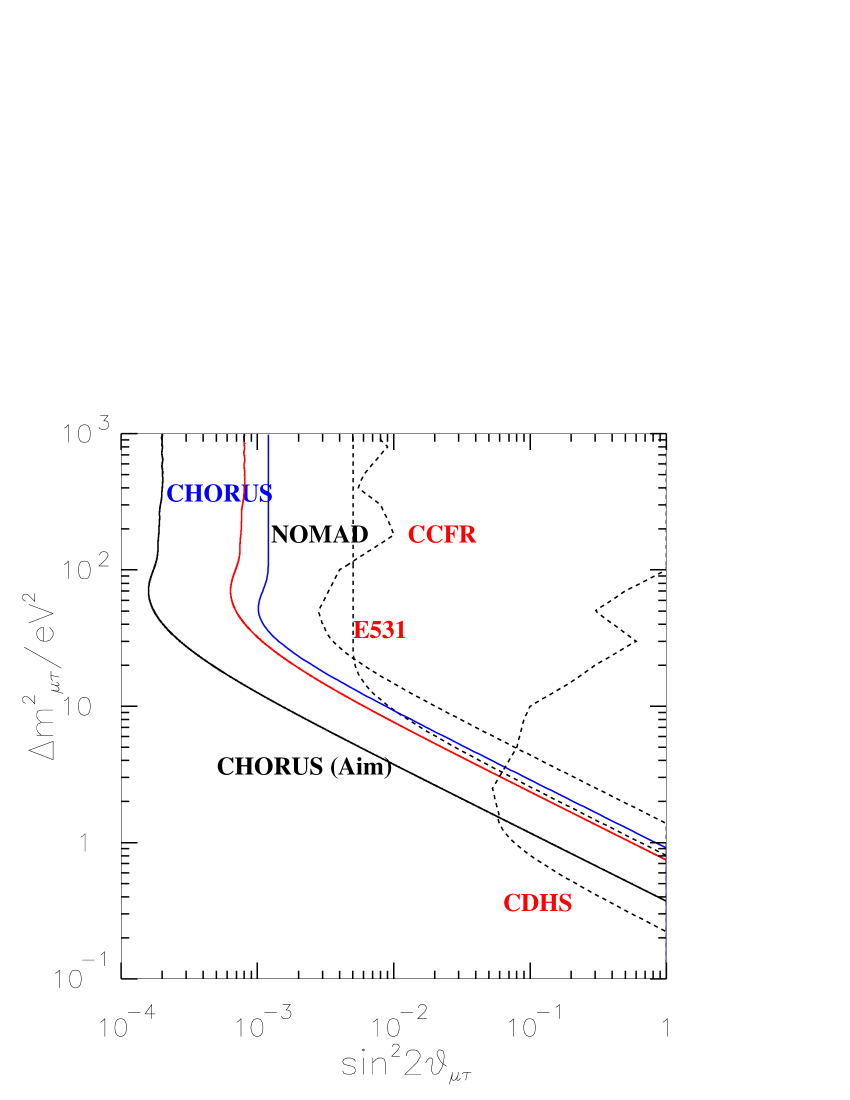
In a two flavour mixing scheme, the 90% C.L. excluded region in the (, ) parameter space is shown in Figure 1. Maximum mixing between and is excluded at 90% C.L. for ; the large are excluded at 90% C.L. for .
| 1994 | 1995 | 1996 | 1997 | |
|---|---|---|---|---|
| 19,581 | 21,809 | 38,919 | 45,920 | |
| 1.89 | 1.89 | 1.89 | 1.89 | |
| 0.93 | 0.93 | 0.93 | 0.93 | |
| 0.39 | 0.39 | 0.39 | 0.39 | |
| 0.17 | 0.17 | - | - | |
| 0.093 | 0.093 | - | - | |
| 0.026 | 0.026 | - | - | |
| 0.53 | 0.35 | 0.37 | 0.37 | |
| 0.24 | 0.25 | - | - | |
| 0.12 | 0.13 | - | - | |
| 0.22 | 0.23 | - | - | |
| 11,987 | 14,769 | - | - |
5.3 Sensitivity to the oscillation
The SPS neutrino beam contains a component which amounts to 0.9% of the integrated flux. The negative result of the search for interactions can therefore be used to set limits on the oscillation. The evaluation of the limit has been performed with the technique described in section 5.2, with the replacement of the energy dependent flux by the flux. The difference between the and energy spectra - the average energy of component is 20 GeV higher - leads to differences in the acceptance for interactions. In the case of the beam, the increase of the cross-section with energy improves the sensitivity to interactions, while the kinematic cuts and reconstruction inefficiencies affecting high energy events contribute to lower the acceptance.
Using the present sample the following 90% C.L. limit is obtained
| (6) |
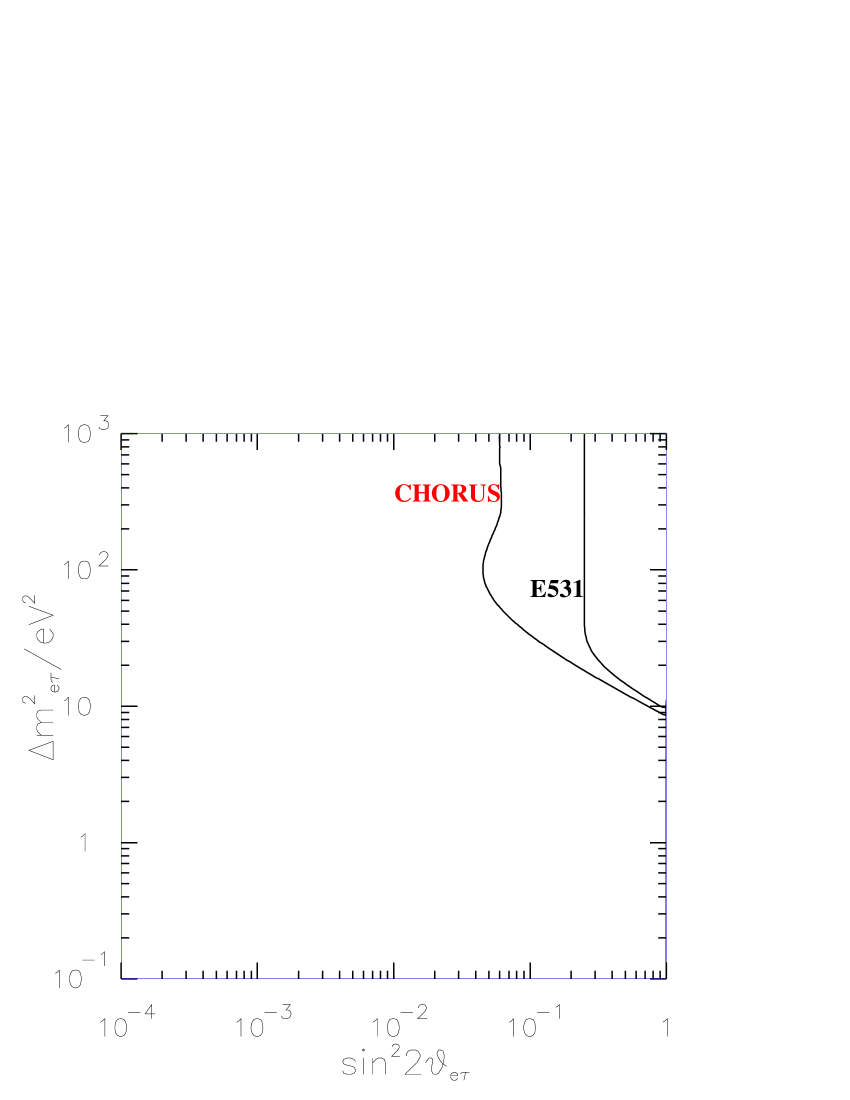
The 90% C.L. excluded region in the (, ) parameter space is shown in Figure 2. Maximum mixing between and is excluded at 90% C.L. for ; the large are excluded at 90% C.L. for .
6 Conclusions
The emulsion scanning methods, previously described in [1, 2], have been applied to a fraction of the 1994-1997 data. No decay candidate has been found, leading to a more stringent 90% C.L. upper limit on the oscillation probability (). Based on the same statistics, the 90% C.L. upper limit on the oscillation probability is .
The dominant background to the search is due to “white kink” secondary interactions in the channel. A direct measurement of this background process is in progress and kinematic cuts are planned for its reduction. Furthermore, a second phase of the analysis (with better efficiencies, larger statistics and faster automatic emulsion scanning) has started with the aim of reaching the design sensitivity [15].
References
- [1] E. Eskut et al., CHORUS Collaboration, Phys. Lett. B 424 (1998) 202.
- [2] E. Eskut et al., CHORUS Collaboration, CERN-EP/98-73. Accepted for publication on Phys. Lett. B.
- [3] O. Sato (CHORUS Collaboration), in Neutrino 98, proceedings of the 18th International Conference on Neutrino Physics and Astrophysics, Takayama, Japan, edited by Y. Suzuki and Y. Totsuka, to appear on Nucl. Phys. B (Proc. Suppl.).
- [4] E. Eskut et al., CHORUS Collaboration, Nucl. Instr. and Meth. A401 7 (1997).
- [5] GEANT 3.21, CERN Program Library Long Writeup W5013.
- [6] N. Ushida et al., E531 Collaboration, Phys. Lett. B206 375 (1988).
- [7] K. Kodama et al., FERMILAB P803 Proposal (1993), Appendix D.
- [8] F. Baldassarre et al., Nuovo Cimento XXI, 3 (1961) 459.
- [9] A. Fassò, A. Ferrari, J. Ranft and P.R. Sala, “New developments in FLUKA modelling of hadronic and EM interactions”, in Proceedings of the 3rd workshop on “Simulating Accelerator Radiation Environment”, SARE-3, KEK-Tsukuba, May 7–9 1997, H. Hirayama ed., KEK report Proceedings 97-5, p. 32 (1997).
- [10] A. Ferrari, T. Rancati and P.R. Sala, “FLUKA applications in high energy problems: from LHC to ICARUS and atmospheric showers”, in Proceedings of the 3rd workshop on “Simulating Accelerator Radiation Environment”, SARE-3, KEK-Tsukuba, May 7–9 1997, H. Hirayama ed., KEK report Proceedings 97-5, p. 165 (1997).
- [11] B. Van de Vyver, Nucl. Instr. and Meth. A385 91 (1997).
- [12] Particle Data Group, Phys. Rev. D54 1 (1996).
- [13] R.D. Cousins and V.L. Highland, Nucl. Instr. and Meth. A320 331 (1992).
- [14] P. Astier et al., Phys. Lett. B 424 (1999) 16.
- [15] N. Armenise et al., CHORUS Collaboration, CERN-PPE/93-131.